HAL Id: hal-02999698
https://hal.archives-ouvertes.fr/hal-02999698
Submitted on 17 Nov 2020
HAL is a multi-disciplinary open access
archive for the deposit and dissemination of
sci-entific research documents, whether they are
pub-lished or not. The documents may come from
teaching and research institutions in France or
abroad, or from public or private research centers.
L’archive ouverte pluridisciplinaire HAL, est
destinée au dépôt et à la diffusion de documents
scientifiques de niveau recherche, publiés ou non,
émanant des établissements d’enseignement et de
recherche français ou étrangers, des laboratoires
publics ou privés.
Distributed under a Creative Commons Attribution| 4.0 International License
from the NutriNet-Santé cohort study
Emmanuelle Kesse-Guyot, Pauline Rebouillat, Laurence Gamet-Payrastre,
Benjamin Allès, Léopold Fezeu, Nathalie Druesne-Pecollo, Bernard Srour, Wei
Bao, Mathilde Touvier, Pilar Galan, et al.
To cite this version:
Emmanuelle Kesse-Guyot, Pauline Rebouillat, Laurence Gamet-Payrastre, Benjamin Allès, Léopold
Fezeu, et al.. Prospective association between organic food consumption and the risk of type 2 diabetes:
findings from the NutriNet-Santé cohort study. International Journal of Behavioral Nutrition and
Physical Activity, BioMed Central, 2020, 17 (1), �10.1186/s12966-020-01038-y�. �hal-02999698�
R E S E A R C H
Open Access
Prospective association between organic
food consumption and the risk of type 2
diabetes: findings from the NutriNet-Santé
cohort study
Emmanuelle Kesse-Guyot
1*, Pauline Rebouillat
1, Laurence Payrastre
2, Benjamin Allès
1, Léopold K. Fezeu
1,
Nathalie Druesne-Pecollo
1, Bernard Srour
1, Wei Bao
3, Mathilde Touvier
1, Pilar Galan
1, Serge Hercberg
1,4,
Denis Lairon
5and Julia Baudry
1Abstract
Background: Organic food (OF) consumption has substantially increased in high income countries, mostly driven by
environmental concerns and health beliefs. Lower exposure to synthetic pesticides has been systematically documented among consumers of organic products compared to non-consumers. While experimental studies suggest that pesticides currently used in food production may be associated with type 2 diabetes (T2D), no well-conducted prospective studies have investigated the potential association between consumption of organic products and the risk of T2D, controlling for potential confounding factors. The objective of this prospective study was to estimate the association between OF consumption and the risk of T2D.
Methods: A total of 33,256 participants (76% women, mean (SD) age: 53 years (14)) of the French NutriNet-Santé prospective cohort study who completed the organic food frequency questionnaire were included (2014–2019). The proportion of OF in the diet (as weight without drinking water) was computed. The associations between the proportion of OF in the diet (as 5% increment and as quintiles) and the risk of T2D were estimated using multivariable Hazard Ratio (HR) and 95% confidence interval (95% CI) derived from proportional hazards models adjusted for confounders (sociodemographic, anthropometric, lifestyle, medical and nutritional factors).
Results: During follow-up (mean = 4.05 y, SD = 1.03 y, 134,990 person-years), 293 incident cases of T2D were identified. After adjustment for confounders including lifestyle (physical activity, smoking status, alcohol consumption) and nutritional quality of the diet assessed by the adherence to the French food-based dietary guidelines, OF consumption was associated with a lower risk of T2D. Participants with the highest quintile of OF consumption, compared with those with the lowest quintile, had 35% lower risk of T2D (95% CI = 0.43–0.97). Each increment of 5% in the proportion of OF in the diet was associated with 3% lower risk of T2D (HR 0.97, 95% CI = 0.95–0.99).
Conclusions: In this large prospective cohort study, OF consumption was inversely associated with the risk of T2D. Further experimental and prospective studies should be conducted to confirm these observations.
(Continued on next page)
© The Author(s). 2020 Open Access This article is licensed under a Creative Commons Attribution 4.0 International License, which permits use, sharing, adaptation, distribution and reproduction in any medium or format, as long as you give appropriate credit to the original author(s) and the source, provide a link to the Creative Commons licence, and indicate if changes were made. The images or other third party material in this article are included in the article's Creative Commons licence, unless indicated otherwise in a credit line to the material. If material is not included in the article's Creative Commons licence and your intended use is not permitted by statutory regulation or exceeds the permitted use, you will need to obtain permission directly from the copyright holder. To view a copy of this licence, visithttp://creativecommons.org/licenses/by/4.0/. The Creative Commons Public Domain Dedication waiver (http://creativecommons.org/publicdomain/zero/1.0/) applies to the data made available in this article, unless otherwise stated in a credit line to the data.
* Correspondence:e.kesse@eren.smbh.univ-paris13.fr
1Sorbonne Paris Nord University, Inserm, Inrae, Cnam, Nutritional
Epidemiology Research Team (EREN), Epidemiology and Statistics Research Center– University of Paris (CRESS), F- 93017 Bobigny, France
(Continued from previous page)
Clinical trial registry: The study was registered at ClinicalTrials.gov (NCT03335644). Keywords: Organic food, Pesticides, Diabetes, Nutrition, Cohort
Research in context
What is already known about this subject? (max-imum of 3 bullet points)
– While plant-based organic foods, containing few pesticide residues, are perceived as healthier by con-sumers, there are few studies on the links between organic food consumption and health
– Experimental studies suggest a role of pesticides on diabetes development but epidemiological data are lacking
What is the key question? (one bullet point only; formatted as a question)
– Is organic food consumption associated with type 2 diabetes independently of confounders
What are the new findings? (maximum of 3 bullet points)
In this population-based prospective cohort, after ad-justment for sociodemographic, anthropometric, life-style, medical and dietary factors, an increase of 5 points in the proportion of OF in the diet was associ-ated with a 3% decrease in T2D risk.
Participants with the highest quintile of OF consumption, compared with those with the lowest quintile, had 35% lower risk of T2D (95% CI = 0.43– 0.97).
Upon confirmation, these findings suggest that potential benefits of organic food consumption may contribute to T2D prevention.
How might this impact on clinical practice in the foreseeable future? (one bullet point only)
– These findings warrant replication, confirmation, and investigation in particular to be able to draw causal inference in future studies.
Introduction
The prevalence of type 2 diabetes (T2D) has significantly increased over recent decades, concomitantly to the obesity epidemic, making diabetes the fourth leading cause of global disability [1] and contributing largely to the global disability burden [2]. Currently in European countries, about 60 million people are living with dia-betes and, in 2010 [3]. Diabetes is a multifactorial disease and scientific literature has underlined, beyond genetic and psychosocial factors, the crucial role of adiposity and several lifestyles-related factors, including physical
activity, smoking, alcohol consumption and dietary pat-terns, in diabetes etiology [1].
According to a recent meta-analysis, there is a high level of evidence that processed meat, red meat and sweetened beverage consumption increases the risk of T2D, while whole grain consumption decreases the risk [4]. Other po-tential dietary factors involved in T2D etiology, although graded lower certainty, include fruit, vegetables, fish, nuts and dairy products (especially yoghurt) [4].
Among the emergent risk factors, exposure to environ-mental contaminants including pesticides is of major concern. Occupational exposure to pesticides has been associated with metabolic disorders [5–7]. In general population, exposure to pesticide residues is often multi-sources but diet is the most important route in the gen-eral population [8]. In particular, organochlorine com-pounds, highly persistent but now banned from agriculture in Europe, have been systematically associ-ated with an increased risk of T2D [9]. Although scien-tific evidence for other types of pesticides is still limited, some epidemiological or experimental studies in animals support the biological plausibility that exposure to sev-eral classes of pesticides can affect the risk of obesity or diabetes [5,10,11]. Indeed, some specific molecules (py-rethroids, organophosphates, and organochlorides), are potential endocrine disruptors, responsible for possible metabolic disorders [12, 13]. For instance, a recent re-view reported a role of currently used organophos-phorus, carbamate and pyrethroid pesticides in the incidence of diabetes [14]. In France, the organic agricul-ture is based on the European organic principles prohi-biting use of synthetic fertilizers and pesticides and promoting the diversification of crops and livestock [15]. In terms of nutritional content, organic plant-based foods exhibit higher concentrations in some antioxidants such as carotenoids while organic animal-based foods exhibit higher concentrations in n-3 fatty acids [16]. Be-sides, a recent European Food Safety Authority report indicated that 44% of conventional crop-based food con-tained at least one quantifiable pesticide residue, vs 6.5% in organic-labeled foods (OF) [17]. In turn, OF con-sumption has been related to lower urinary pesticide ex-posure in a broad range of settings and different populations [16]. This is in line with our previous find-ings showing that high consumers of OF in subsample of the NutriNet-Santé cohort exhibited lower exposure to pesticide residues except for spinosad authorized in organic farming [18, 19]. Moreover, a recent
cross-sectional study conducted in the United States found that participants in the National Health and Nutrition Examination Survey reporting purchasing OF had a 20% lower prevalence of diabetes c [20]ompared to those who did not purchase OF after adjustment for known diabetes-related risk factors .
In that context, the objective of the present study con-ducted in a large prospective cohort was 1) to investigate the prospective association between OF consumption and the risk of T2D, and 2) to estimate the mediation effect by the potential healthiness of a plant-based diet. Indeed, we hypothesize that OF consumers, as less exposed to pesti-cides residues from diet, may exhibit a lower risk of devel-oping T2D. In addition, as we previously documented an association between OF preferences and a diet rich in plant-based food [18], we hypothesize that the association, if any, would be more pronounced among high plant-based food consumers, due to their higher intake of pesticide-contaminated foods.
Material and methods
Study population
The study is based on the data from the web-based pro-spective cohort NutriNet-Santé study conducted in France, initiated to investigate the relationship between determi-nants of dietary behaviors, nutrition and health. The ration-ale, design, and methodology have been described in detail previously [21]. Adult volunteers were enrolled from the general population and completed self-administered ques-tionnaires using a dedicated platform about sociodemo-graphic characteristics, lifestyle factors, health status, physical activity, anthropometric factors and diet.
The NutriNet-Santé study is conducted according to the Declaration of Helsinki guidelines and was approved by the Institutional Review Board of the French Institute for Health and Medical Research (IRB Inserm n°0000388FWA00005831) and the“Commission Nationale de l’Informatique et des Lib-ertés” (CNIL n°908,450/n°909,216). The study protocol is re-corded atClinicaltrials.govunder the number:NCT03335644. Data collection
Food consumption was assessed through a previously validated self-administered semi-quantitative food fre-quency questionnaire (FFQ), including additional ques-tions about frequencies consumption in the organic form (as based on certified and labeled products) for each item. The Organic FFQ has been described in de-tails elsewhere [22]. In brief, the Organic FFQ included 264 items (food and beverages) with stated serving sizes or photographs. For each item, participants were asked to provide the frequency of consumption over the past year along with the quantities. The frequency consump-tion in the organic form was assessed for each item using the following question: ‘How often was the
product of organic origin?’ with five modalities (never, rarely, half of time, often and always) and converted into quantitative data by assigning a weight to the consump-tion of the item of 0, 0.25, 0.5, 0.75 and 1 to the respect-ive categories: ‘never’, ‘rarely’, ‘half the time’, ‘often’ and ‘always’. Consequently, the proportion of OF in the diet was calculated as the total OF consumption (in grams per day) divided by the total consumption without water (in grams per day). This ratio was also computed for plant-and animal- based food groups. Nutrient intakes were cal-culated using a food composition database (independent of the food production - organic or conventional), based on the NutriNet-Santé food composition table [23].
We also computed the sPNNS-GS2 (simplified Programme National Nutrition Santé Guideline Score 2), a validated dietary quality score reflecting the adher-ence to the 2017 French dietary guidelines considering the principal guidelines, i.e. with no consideration for OF consumption [24]. Components, scoring and weight-ing are shown in S1Table.
Case ascertainment
Participants could report their health events using sev-eral methods: yearly health questionnaire, a specific health check-up questionnaire every six months, or at any time spontaneously through the platform. They were also prompted to declare all medication uses. Further-more, due to a Decree in the Council of State (n°2013– 175) that allows researchers to link data from independ-ent cohorts to the medico-administrative databases of the National health insurance (SNIIRAM database), we were able to view participants medication and medical consultation history. T2D cases were therefore ascer-tained using a multi-source approach, i.e. T2D self-reported during follow-up along with declaration of the use of T2D medication (or a reimbursement of T2D medication detected from SNIIRAM).
Covariates
At baseline, data on age, sex, highest graduation degree, occupation, income, smoking habits and physical activity were collected [25]. Income per household unit was cal-culated by dividing the household’s total monthly in-come by the number of consumption units (CU) [26]. The following categories of monthly income were used: < 1200; 1200-1800; 1800–2700 and > 2700 euros per household unit. Physical activity was assessed using the International Physical Activity Questionnaire (IPAQ) [27].Validated anthropometric questionnaires provided information on height and weight [28]. At baseline, anti-hypertensive and lipid-lowering medications as well as self-declaration of hypertension or dyslipidemia were de-clared through health questionnaire.
Statistical analysis
For this study, we retained NutriNet-Santé participants who completed the Organic FFQ between June and De-cember 2014 (N = 37,685), with no missing data to com-pute energy needs as this was necessary to comcom-pute misreporting (N = 37,305), who were not detected as under- or over-reporters (N = 35,196), and who were liv-ing in France (N = 34,442). Finally, prevalent cases of T2D at baseline (N = 1186) were excluded, leading to an analysis sample of 33,256 participants (Fig. 1). Under-and over-reporters were those with a ratio between en-ergy intake and enen-ergy requirement below or above cut-offs previously identified (0.35 and 1.93) and corresponding to the 1st and 99th percentile of the ratio distribution [22].
Baseline characteristics are presented by sex-specific quintile of the proportion of OF to the diet.
P-values referred to linear contrast across quintiles for continuous factors, Mantel-Haenzel Chi-square trend test for ordinal variables, and Chi-square test for cat-egorical variables. Cox proportional hazards models using age as time-scale were used to estimate the rela-tionship between OF consumption (modeled as a con-tinuous variable (per 5% of increment of OF in the diet) and as sex-specific quintiles (the lowest quintile as refer-ence)) and the risk of T2D providing hazard ratios (HR) and 95% confidence intervals (CI). Participants contrib-uted person-time until the date of diabetes diagnosis, the date of last completed questionnaire or April, 19th 2019, whichever occurred first. Risk proportionality assump-tions were estimated by examination of the Schoenfeld residuals. The first model was adjusted for gender, famil-ial history of T2D, physical activity, occupation, marital status, education, monthly income per unit, smoking sta-tus, sPNNS-GS2, energy intake and alcohol consump-tion. The main model was further adjusted for BMI. Further adjustments for menopausal status, hormonal treatment (contraception or menopausal treatment) among women and living area (rural/urban) were tested and did not modify the results (data not shown).
We tested non-linear associations between OF con-sumption and T2D risk and verified the ascon-sumption of linearity using restricted cubic spline (RCS) functions with a SAS® macro [29]. We also stratified the analyses according to several factors which may potentially mod-ify the associations, namely gender and high level of plant-based foods (according to tertiles of the sPNNS-GS2) and monthly income per household unit.
For comparability purpose with studies outside France, we have performed a sensitivity analysis by replacing the sPNNS-GS2 by the MEDI-LITE score [30]. As previously published, the MEDI-LITE, which ranges from 0 (least healthy) to 18 (healthiest), includes 9 components focus-ing on consumption of fruit, vegetables, whole grains,
nuts and legumes, olive oil (positive points), dairy, red and processed meat (negative points), and alcohol (points according to consumption). Points are allocated according to a scoring system based on daily or weekly consumption.
To test the robustness of our findings, a set of sensitiv-ity analyses encompassing removing of early cases or cases of cardiovascular diseases/metabolic disorders and additional adjustments (described in the supplemental
material) were performed and we conducted a mediation
analysis to estimate direct and indirect (through the
nutritional quality of the diet) statistical effect of OF consumption on the risk of T2D.
All tests were two-sided, and P < 0.05 was considered statistically significant. SAS® version 9.4 (SAS Institute) and R software were used for the analyses.
Results
The mean follow-up was 4.06 (SD = 1.03) years and the mean age at baseline was 52.95 (SD = 14.2) years old. During follow-up (134,990 person-years), 293 incident T2D cases were identified.
Baseline characteristics of the sample
Characteristics of the participants are presented across quintiles of OF consumption (as proportion of OF in the whole diet) in Table1. Higher OF consumption was posi-tively associated with being older, more education, higher income or attaining a managerial position and to be phys-ically active. Increase in OF in the diet was associated with higher energy intake and a lower contribution of proteins and higher contribution of carbohydrates and lipids to total daily energy intake. Higher consumption of OF was also associated with higher sPNNS-GS2 (reflecting adher-ence to dietary guidelines), lower alcohol consumption and lower body mass index.
Proportion of OF in the diet and T2D
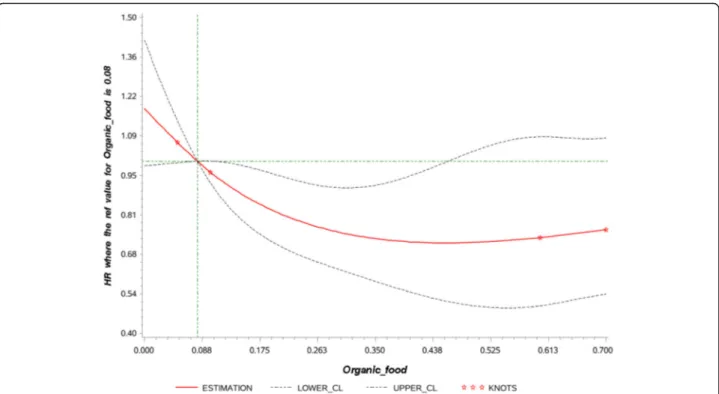
The association between OF consumption (as proportion in the diet) and risk of T2D is presented in Table2. The linearity of the association is illustrated in Fig.2. No evi-dence of non-linearity was observed. After adjustment for confounders including lifestyle, sociodemographic data and quality of the diet, higher OF consumption was inversely associated with T2D risk (HRQ5 vs. Q1 = 0.64, 95%CI = 0.43–0.95, P for trend = 0.01). Each increment of 5% in the proportion of OF in the diet was associated with 3% reduction in risk of T2D (HR 0.97, 95% CI = 0.94–0.99). After further adjustment for BMI, relation-ships were marginally attenuated (HRQ5 vs. Q1 = 0.65, 95%CI = 0.43–0.97, P for trend = 0.01; HR per 5% incre-ment = 0.97 95%CI = 0.95–0.99). When considering the proportion of OF in the consumption of plant products, findings were similar although slightly attenuated (HR 5% increment = 0.98, 95%CI = 0.95–1.00, P = 0.03). Of note, the point estimate for Q5 was higher than for Q4. For animal food products, the association was not statis-tically significant.
Stratified analysis
Stratified analyses are shown in Table3.The inverse as-sociation between OF consumption and T2D risk was more specifically observed in women and in participants with a high level of adherence to the food-based guide-lines. The associations were similar but statistically
significant (statistical power was reduced) only among low and high-income individuals. No significant associa-tions were observed in other strata.
Sensitivity analysis
Excluding early (during the first 2 years of follow-up) cases of T2D (to limit reverse causality) or participants developing cardiovascular diseases during the follow-up led to similar findings. However, excluding participants with hypertension or dyslipidemia (final sample N = 24, 316) at baseline or during the follow-up strongly attenu-ated the association (S2Table).
Accounting for additional dietary or nutritional factors (described in the Supplemental Material) potentially re-lated to T2D risk and OF consumption did not modify the findings (S2Table).
Using the residues of OF consumption on dietary qual-ity as main exposure substantially attenuated the findings although the association remained (HR per 5% incre-ment = 0.98, 95%CI = 0.96, 1.00; P = 0.04) (S2Table).
Finally, the mediation analysis aiming to better explain the causal chain is presented in S3 Table. The indirect effect of OF consumption through the quality of the diet was small among participants with low OF consumption. However, among those in the highest quintile of the pro-portion of OF in the diet, the association between OF consumption and the risk of T2D was partially mediated (up to 32%) by a healthy diet and the direct effect was estimated to a reduction in T2D risk of 28%.
Replacing sPNNS-GS2 by adherence to Mediterranean diet (using MEDI-LITE score) provided similar findings (S4Table).
Discussion
In the present study conducted in a large sample from the French adult population, an inverse association be-tween OF consumption and T2D risk was observed. This association persisted after accounting for potential con-founding effects of various factors, including lifestyles, dietary patterns and adiposity. Of note, the inverse rela-tionship was observed more specifically among women and high consumers of plant-based foods.
Epidemiological evidence dealing with potential links between OF consumption and metabolic-related out-comes are scarce [20, 31, 32]. Two performed in the NutriNet-Santé study have shown that a high level of OF consumption is associated with a significantly lower probability of overweight and obesity in both men and women [31] as well as a reduced risk of metabolic syn-drome [32]. An inverse association between BMI and OF consumption has been previously observed in this cohort thus adjustment for BMI has been performed in the models.
Table 1 Baseline characteristics of the sample across sex-specific quintiles of the proportion of organic food in the diet, NutriNet-Santé study, 2014–2019, N = 33,256*
Q1 Q2 Q3 Q4 Q5 P1
N 6650 6652 6652 6652 6650
Cut-off of organic food Share
Women ≤0.04 > 0.04–0.17 > 0.17–0.32 > 0.32–0.56 > 0.56
Men ≤0.01 0.01–0.12 0.12–0.26 0.26–0.5 > 0.50
Female (%) 76.33 76.32 76.32 76.32 76.33 –
Age (years) 52.7 (14.9) 52.5 (14.3) 53.3 (13.8) 53.8 (13.5) 53.7 (13.3) < 0·0001
Education (%) < 0·0001
< High school diploma 25.1 19.3 20.7 19.3 17.8
High school diploma 16.6 15.3 13.8 13.6 13.9
Post-secondary graduate 58.3 65.4 65.5 67.2 68.4
Monthly income per unit household unit in€ (%) < 0·0001
Missing 6.74 5.97 6.21 6.06 6.32 < 1200 14.81 10.96 10.37 9.86 11.94 1200–1800 25.13 22.81 22.49 21.83 22.74 1800–2700 25.5 27.6 27.27 28.16 27.53 > 2700 27.82 32.67 33.66 34.1 31.47 Occupational categories (%) < 0·0001 Non-employed 4.41 3.76 3.97 3.85 4.87 Retired 35.97 33.51 35.24 36.35 34.56 Employee/Manual worker 19.23 16.07 14 11.91 12.6 Intermediate profession 14.17 15.81 16.15 15.94 14.27 Managerial staff 16.57 22.34 22.96 22.91 23.31 Never employed 7.97 7.07 6.1 7.13 7.62
Craftsman, shopkeeper, business owner, and farmer 1.68 1.44 1.59 1.92 2.77
Cohabiting (%) 86.36 86.64 88.05 88.08 86.96 0.04 Tobacco status (%) 0.64 Former smoker 38.78 39.13 39.37 40.83 40.6 Current smoker 12.8 11.68 11.79 9.89 9.2 Never smoker 48.42 49.19 48.84 49.28 50.2 Physical activity (%) < 0·0001 Missing 23.16 21.2 20.11 19.35 16.19 Low 25.08 22.34 19.69 17.61 15.29 Medium 18.4 20.25 20.76 20.44 20.16 High 17.81 17.99 19.31 21.11 23.77
Energy intake (kcal/d) 1965 (648) 1980 (618) 1995 (611) 2022 (635) 2011 (618) < 0·0001
% Carbohydrates 39.73 (7.72) 39.43 (7.38) 39.68 (7.37) 39.45 (7.27) 40.25 (7.82) 0.0003
% Lipids 40.29 (7.17) 40.77 (6.92) 40.87 (6.84) 41.59 (6.85) 42.38 (7.62) 0·0017
% Proteins 19.58 (3.82) 19.40 (3.49) 19.05 (3.50) 18.58 (3.52) 17.00 (3.51) < 0·0001
Alcohol consumption (g/d) 8.54 (14.31) 8.65 (12.41) 8.62 (11.91) 8.58 (11.73) 7.41 (10.53) < 0·0001
sPNNS-GS2 1.83 (3.48) 2.16 (3.40) 2.60 (3.30) 2.99 (3.29) 4.29 (3.03) < 0·0001
Body mass index (kg/m2
) 24.77 (4.86) 24.25 (4.65) 24.11 (4.36) 23.84 (4.24) 22.97 (3.89) < 0·0001
Family history of T2D 18.45 17.51 16.58 16.37 16.75 0.002
History of hypertension 17.98 16.27 15.53 14.51 10.75 < 0·0001
History of dyslipidemia 19.85 18.72 18.64 18.13 13.31 < 0·0001
Abbreviations: Q sex-specific Quintile
*
All variables were assessed at baseline
1
To the best of our knowledge, the present study is the first prospective cohort study to examine the association between OF consumption and T2D risk. Consistent with our findings, a recent cross-sectional study, found that frequent OF purchase, as a proxy of higher consumption of OF was inversely associated with diabetes prevalence among adults in the United States [20].
As healthy diets have been positively correlated with OF consumption in our cohort and other studies [18,33,34], it can be assumed that our findings can be, at least par-tially, explained by healthier diet of high consumers of OF. However, adjustment for dietary factors (specific and hol-istic) only marginally attenuated the association. Similarly, the mediation analysis carried out to quantify the direct and indirect effects of OF consumption on the risk of T2D suggested a specific role of OF consumption beyond the healthiness of the diet of high OF consumers.
With regard to type of organic foods, organic plant-food consumption was specifically associated with a reduced T2D risk in our study while no clear-cut association was observed with organic animal-food consumption. We ob-served a lower point estimate in Q5 than in Q4. It cannot be ruled that this association is an artefact resulting from an underlying association rather than a true association or due to imprecise estimation or reverse causation. Further
studies investigating specific associations on detailed food groups may help to better understand this finding.
Furthermore, in the stratified analyses leading to a lower statistical power, a lower risk of T2D was only de-tected in participants exhibiting high level of adherence to food-based dietary guidelines (correlated to plant-based food consumption).
It is also noteworthy that we did not observe an in-verse association among men.
In fact, a higher risk was observed among men who were OF consumers, although not statistically significant, while a strong link was detected among women. In the NHANES analysis [20], inverse association between OF and diabetes was similar among men and women (OR < 1) but did not reach statistical significance due possibly to limited statistical power.
The sex specific association may be biased by the lack of statistical power among men (N = 120 cases only). However, a sexual dimorphic response to pesticide ex-posure has been already reported in population-based [35] and in animal experiment [36–38] studies. More-over, the sexual dimorphism in response to pesticide ex-posure may be related to different detoxifying capacities between males and females, or difference in regulation of the microbiota [39]. Further research is needed to Table 2 Association between the proportion of organic food in the diet and risk of T2D, NutriNet-Santé study, 2014–2019, N = 33,256*
model Q1 Q2 Q3 Q4 Q5 P for trend1 5 points increment P2
Total organic food
Person-years 26,709 27,128 27,218 27,120 26,816
Number of cases 83 72 51 48 39
Model 13 1.00 (ref) 0.94 (0.69, 1.30) 0.69 (0.48, 0.98) 0.70 (0.48, 1.00) 0.64 (0.43, 0.95) 0.01 0.97 (0.94, 0.99) 0.01 Model 24 1.00 (ref) 0.89 (0.65, 1.23) 0.69 (0.48, 0.98) 0.67 (0.46, 0.96) 0.65 (0.43, 0.97) 0.01 0.97 (0.95, 0.99) 0.02
Organic plant food
Person-years 26,733 27,141 27,179 27,239 26,698
Number of cases 83 67 55 40 48
Model 35 1.00 (ref) 0.88 (0.63, 1.21) 0.74 (0.53, 1.05) 0.55 (0.38, 0.81) 0.76 (0.52, 1.10) 0.01 0.97 (0.95, 1.00) 0.03
Model 46 1.00 (ref) 0.83 (0.60, 1.16) 0.75 (0.53, 1.06) 0.52 (0.36, 0.77) 0.77 (0.53, 1.12) 0.01 0.98 (0.95, 1.00) 0.03
Organic animal food
Person-years 26,541 27,104 27,236 27,148 26,960
Number of cases 75 58 65 46 49
Model 57 1.00 (ref) 0.81 (0.57, 1.14) 0.93 (0.66, 1.30) 0.68 (0.47, 0.99) 0.84 (0.58, 1.22) 0.19 0.99 (0.96, 1.01) 0.27
Model 68 1.00 (ref) 0.77 (0.54, 1.09) 0.94 (0.67, 1.31) 0.64 (0.44, 0.93) 0.82 (0.56, 1.19) 0.15 0.99 (0.96, 1.01) 0.27 Abbreviation: Q sex-specific quintile
*Values are Hazard ratio (95% confidence intervals), 5 points correspond to 5% of the contribution of OF to the diet 1
P for trend modeling quintile as ordinal independent variable
2
P for continuous independent variable
3Model 1 is adjusted for age (time-scale), gender, familial history of diabetes, physical activity, occupation, marital status, education, monthly income
per unit, smoking status, sPNNS-GS2, energy intake and alcohol consumption
4
Model 2 is model 1 adjusted for body mass index
5
Model 3 is model 1 adjusted for total plant food consumption
6Model 4 is model 3 adjusted for body mass index
7Model 5 is model 1 adjusted for total animal food consumption 8Model 6 is model 5 adjusted for body mass index
clarify the sex-specific association of OF consumption with T2D risk.
The underlying mechanisms of the observed relation-ships can be seen in light of the differences in bioactive component contents between organic and conventional foods. First, some literature reviews have documented higher concentrations of some antioxidant compounds in organic plant-food [16]. As to carotenoids, this has also been established in a subsample of the NutriNet-Santé study comparing plasma concentrations of matched low and high OF consumers with similar char-acteristics including sociodemographic data, lifestyles and profiles of dietary consumption [40]. These antioxi-dants may play a marginal role in the etiology of T2D by reducing oxidative stress that disrupts glucose absorp-tion by cells and can improve insulin sensitivity [41,42].
Second, fatty acids profiles are potentially different in organic and conventional animal foods [16]. Organic meat and milk exhibit higher contents in n-3 fatty acids which may play a role against insulin-resistance. Differ-ential fatty acids profiles have also been observed in low vs high OF consumers [40]. However, in the present study, a higher organic animal-based food consumption was not associated with lower T2D risk (in the whole sample) whereas this was observed in the American study [20]. This may be due to differences in food com-position, levels of food consumption or differences in nutritional profiles between the two populations studied.
The third hypothesis relies on the fact that organic plant foods contain much less synthetic pesticide resi-dues than their conventional counterparts [17] due to specifications and regulations prohibiting the use of these molecules during production, storage and process-ing. This is translated into different human exposures as checked by experimental and observational epidemio-logical studies [19, 43–47], documenting lower urinary concentration in some pesticide residues in relation to OF consumption. Scientific studies acknowledge that most pesticide moieties act as endocrine disruptors [48]. Harmful effects of organochlorine pesticides, which are now widely prohibited, on the development of T2D have been well documented [9]. Although less often studied, currently used pesticides such as organophosphorus, py-rethroids and neonicotinoids may also display properties involved in the etiology of T2D [5]. Experimental studies have reported an effect of low doses of these molecules on various mechanisms involved in the dysregulation of glucose hemostasis and insulin resistance including in-flammatory pathways, disturbance of oxidative homeo-stasis, mitochondrial dysfunction, endocrine disruption and epigenetic alterations [11, 13, 49]. In our study, a stronger negative association between OF consumption and risk of T2D was observed in individuals with higher intakes of plant-based foods (i.e. who complied better with dietary recommendations). Indeed, the subgroup of individuals with the highest consumption of plant foods
Fig. 2 Linearity assumption of the association between the proportion of organic food in the diet and type 2 diabetes risk1,2.1Spline plot
modeling the association between the proportion of organic food in the diet and type 2 diabetes risk using Restricted cubic spline (RCS) SAS Macro® developed by Desquilbet and Mariotti.2P for overall association = 0.02, P for non-linear association = 0.12
were those who benefited most from consuming OF in terms of T2D risk. Thus, the noticeably reduced pesti-cides residue exposure provided by organic plant foods is consistent with mechanistic data and support this hypothesis.
These findings are of public health relevance. Indeed, if our results are confirmed by research in other settings and populations and coupled with specific experimental studies, organic food consumption promotion may serve in T2D pre-vention strategies, as part of a dimension of a healthy diet.
Some limitations of our study should be noted. First, as the design is observational, causal inference is limited and residual confounding cannot be entirely ruled out. How-ever, a wide range of sensitivity analyses were conducted to test the robustness of our findings. Second, generalizability to other populations is limited due to the characteristic of this population composed of volunteers, as illustrated by the low incidence of T2D which may have lowered the statistical power. Indeed, the participants
included in this cohort were more often women, younger, with higher formal education, healthier dietary patterns and higher consumption of OF [22, 50, 51] compared to the general French population. However, the latter allows estimating the role of OF consumption at higher levels than those generally observed population. Third, the as-certainment of T2D cases was based on several sources but non-identification of some cases of diabetes cannot be totally excluded. Next, this study is based on self-reported data, in particular dietary consumption, which are prone to measurement errors and desirability bias. However, our previous work showed that organic and non-organic con-sumers exhibited differences in concentrations of some urinary pesticide residues which provides some evidence for the reliability of our nutritional data [19]. Finally, the follow-up of 4 years was relatively short, so that there may be reverse causality (i.e., people with subclinical diabetes chose to eat more organic foods instead of non-organic foods).
Table 3 Stratified analysis of the association of the proportion of organic food in the diet and risk of T2D, NutriNet-Santé study, 2014–2019* Q1 Q2 Q3 Q4 Q5 P for trend1 5 points increment P2 P for interaction Sex Women3 1.00 (ref) 0.66 (0.43, 1.00) 0.67 (0.43, 1.03) 0.51 (0.31, 0.83) 0.35 (0.19, 0.63) 0.0002 0.94 (0.91, 0.97) 0.001 0.01 Men4 1.00 (ref) 1.38 (0.81, 2.33) 0.75 (0.40, 1.41) 1.22 (0.68, 2.17) 1.61 (0.89, 2.91) 0.28 1.03 (0.99, 1.07) 0.15 sPNNS-GS2 Tertile 1 1.00 (ref) 0.75 (0.47, 1.21) 0.78 (0.48, 1.26) 0.55 (0.32, 0.93) 0.72 (0.43, 1.20) 0.08 0.99 (0.95, 1.03) 0.59 0.24 Tertile 2 1.00 (ref) 1.17 (0.65, 2.12) 0.66 (0.33, 1.30) 0.70 (0.36, 1.39) 0.55 (0.26, 1.15) 0.04 0.96 (0.91, 1.00) 0.07 Tertile 3 1.00 (ref) 0.60 (0.28, 1.28) 0.56 (0.26, 1.21) 0.48 (0.20, 1.11) 0.42 (0.17, 1.03) 0.04 0.95 (0.90, 1.00) 0.06
Monthly income per unit household unit in€ < 12005 1.00 (ref) 0.69 (0.30, 1.56) 0.36 (0.13, 0.97) 0.53 (0.20, 1.44) 0.20 (0.04, 0.94) 0.02 0.92 (0.84, 1.00) 0.05 0.99 1200– 18006 1.00(ref) 0.58 (0.28,1.22) 0.69 (0.33,1.42) 0.78 (0.38,1.62) 0.55 (0.22,1.35) 0.32 0.97 (0.91, 1.02) 0.25 1800– 27007 1.00 (ref) 1.09 (0.53, 2.21) 0.95 (0.46, 1.98) 1.27 (0.62, 2.60) 1.04 (0.46, 2.39) 0.75 1.01 (0.97, 1.07) 0.56 > 27008 1.00 (ref) 0.85 (0.49, 1.45) 0.50 (0.26, 0.96) 0.38 (0.19, 0.79) 0.65 (0.33, 1.25) 0.02 0.95 (0.90, 0.99) 0.03
Abbreviations: CI confidence interval, HR Hazard ratio, PNNS-GS2 Programme National Nutrition Santé-guideline score 2, Q sex-specific (when appropriate) quintile, T2D type 2 diabetes
*
Values are Hazard ratio (95% confidence intervals). 5 points correspond to 5% of the contribution of OF to the diet. Model are adjusted for age (time-scale), familial history of diabetes, physical activity, occupation, marital status, education, monthly income per unit, smoking status, sPNNS-GS2, energy intake, alcohol consumption and body mass index and gender for sPNNS-GS2 stratification
1
P for trend modeling quintile as ordinal independent variable
2
P for continuous independent variable
3 N = 25,383 4 N = 7873 5 N = 3854 6 N = 7648 7 N = 9050 8 N = 10,623
The strengths of our study include large sample size with various dietary patterns, in particular high OF con-sumers allowing assessment of the potential role of high proportion of OF in the diet with sufficient statistical power. In addition, for the first time, the OF consump-tion was assessed quantitatively for a high number of food items allowing an accurate estimation of the overall proportion of OF in the diet. Finally, the prospective de-sign improved causal inference.
Conclusion
In conclusion, this prospective study supports an inverse association between OF consumption, in particular organic plant-based foods, and the risk of T2D, in adults, especially women. Randomized trials would be helpful to fully dem-onstrate causal inference but such long-term interventional studies raise concerns about logistical feasibility. Overall, further investigations in observational studies in other set-tings and carefully designed randomized controlled trials are required to replicate these findings for confirmation purpose and to elucidate underlying mechanisms.
Supplementary Information
The online version contains supplementary material available athttps://doi. org/10.1186/s12966-020-01038-y.
Additional file 1 Table S1. Components, scoring and weighting used for sPNNS-GS2 cFigureS4ek. Table S2. Sensitivity analyses of the associa-tions between organic food consumption and risk of T2D, NutriNet-Santé study, 2014–2019*. Abbreviations: CI: confidence interval, HR: Hazard ratio, PNNS-GS2: Programme National Nutrition Santé-guideline score 2, Q: quintile, T2D: type 2 diabetes.*Values are mean differences (95% confi-dence intervals). 5 points correspond to 5% of the contribution of OF to the diet. Model are adjusted for age (time-scale), gender, familial history of diabetes, physical activity, occupation, marital status, education, monthly income per unit, smoking status, sPNNS-GS2, energy intake, alco-hol consumption and body mass index.1P for continuous independent
variable.2T2D cases occurring during the first year of follow-up were ex-cluded from the sample (finaln = 33,162. 199 cases).3Participants
devel-oping a cardiovascular disease during the follow-up or before were excluded from the sample (finaln = 32,468, 273 cases).4Participants with
hypertension or dyslipidemia at baseline were removed (finaln = 24,316. 85 cases).5Model was further adjusted for consumption of processed
meat, whole grain and sweetened beverages.6Model was further ad-justed for intake of saturated fatty acids, sugar, sodium and fiber.7
Re-sidual of the regression of organic food consumption on sPNNS-GS2 was considered as principal exposure.8Model with sPNNE-GS2 replaced by 4
dietary factors extracted by principal component analysis. Table S3. Me-diation of the association between organic food consumption and risk of T2D by a healthy diet, NutriNet-Santé study, 2014–2019, N = 33,256*. Ab-breviations: Q, Quintile; HR, hazard ratio.*The direct effect corresponds
to the direct relation between organic food consumption and T2D, and the indirect effect corresponds to the relation mediated by sPNNS-GS2 (diet quality, in deciles) as described in the supplemental material. Values are hazard ratio and 95% confidence interval adjusted for age (time-scale), gender, family history of diabetes, physical activity, occupation, marital status, education, monthly income per unit, smoking status, en-ergy intake, alcohol consumption and body mass index.1Values corres-pond to the percentage of the total association mediated by sPNNS-GS2. Table S4. Association between the proportion of organic food in the diet and risk of T2D, adjusted for the Medi-Lite score, NutriNet-Santé study, 2014–2019, N = 33,256*. Abbreviation: Q: sex-specific quintile.
*Values are Hazard ratio (95% confidence intervals), 5 points correspond
to 5% of the contribution of OF to the diet.1P for trend modeling
quin-tile as ordinal independent variable.2P for continuous independent vari-able.3Model 1 is adjusted for age (time-scale), gender, familial history of
diabetes, physical activity, occupation, marital status, education, monthly income per unit, smoking status, MEDI-LITE, energy intake and alcohol consumption.4Model 2 is model 1 adjusted for body mass index.5Model 3 is model 1 adjusted for total plant food consumption.6Model 4 is
model 3 adjusted for body mass index.7Model 5 is model 1 adjusted for
total animal food consumption.8Model 6 is model 5 adjusted for body
mass index. S5 Material. Abbreviations
BMI:Body mass index; CU: Consumption units; HR: Hazard ratio; OF: Organic food; PNNS-GS2: Programme National Nutrition Santé-Guideline Score 2; PNNS-GS 2: Programme National Nutrition Santé-Guideline Score; Q: Quintile; T2D: Type 2 diabetes
Acknowledgements
The authors warmly thank all the volunteers of the NutriNet-Santé cohort. We also thank Cédric Agaesse (dietitian); Thi Hong Van Duong, Younes Esseddik (IT manager), Régis Gatibelza, Djamal Lamri, Jagatjit Mohinder and Aladi Timera (computer scientists); Julien Allegre, Nathalie Arnault, Laurent Bourhis and Fabien Szabo de Edelenyi, PhD (supervisor) (data-manager/ statisticians) for their technical contribution to the NutriNet- Santé study. Authors’ contributions
The authors’ contributions were as follows – EKG, JB: designed the research; SH, PG, MT, JB, DL: conducted the research; EKG: performed statistical analysis and drafted the manuscript. PR, LP, BA, LKF, NDP, BS, WB, MT, PG, SH, DL and JB contributed to the data interpretation and revised each draft for important intellectual content. All authors read and approved the final manuscript. EKG had full access to all the data in the study, EKG takes responsibility for the integrity of the data and the accuracy of the data analysis, she is the guarantor. The corresponding author (EKG) attests that all listed authors meet authorship criteria and that no others meeting the criteria have been omitted. The authors read and approved the final manuscript.
Funding
The BioNutriNet project was supported by the French National Research Agency (Agence Nationale de la Recherche) in the context of the 2013 Programme de Recherche Systèmes Alimentaires Durables (ANR-13-ALID-0001). The NutriNet-Santé cohort study is funded by the following public in-stitutions: Ministère de la Santé, Santé Publique France, Institut National de la Santé et de la Recherche Médicale (INSERM), Institut National de la Recherche Agronomique (INRA), Conservatoire National des Arts et Métiers (CNAM) and Sorbonne Paris Nord University. The funders had no role in study design, data collection and analysis, decision to publish, or preparation of the manuscript.
Availability of data and materials
The datasets generated and/or analyzed during the current study are not publicly available due protection under the protection of health data regulation set by the French National Commission for Information Technology and Liberties (Commission Nationale de l’Informatique et des Libertés, CNIL). The data are available upon reasonable request to the study’s operational manager, Nathalie Pecollo (dev@null), for review by the steering committee of the NutriNet-Santé study.
Ethics approval and consent to participate
The NutriNet-Santé study is conducted according to the Declaration of Helsinki guidelines and was approved by the Institutional Review Board of the French Institute for Health and Medical Research (IRB Inserm n°0000388FWA00005831) and the“Commission Nationale de l’Informatique et des Libertés” (CNIL n°908450/n°909216). The study protocol is recorded at
Clinicaltrials.govunder the number:NCT03335644. All subjects provided in-formed consent.
Consent for publication Not applicable.
Competing interests
The authors declare that they have no competing interests. Author details
1Sorbonne Paris Nord University, Inserm, Inrae, Cnam, Nutritional
Epidemiology Research Team (EREN), Epidemiology and Statistics Research Center– University of Paris (CRESS), F- 93017 Bobigny, France.2Toxalim
(Research Center in Food Toxicology), University of Toulouse, INRA, ENVT, INP-Purpan, UPS, 31027 Toulouse, France.3Department of Epidemiology,
College of Public Health, University of Iowa, Iowa City, IA 52246, USA.
4Département de Santé Publique, Hôpital Avicenne, F-93017 Bobigny, France. 5
Aix Marseille Université, INSERM, INRA, C2VN, Marseille, France.
Received: 2 July 2020 Accepted: 16 October 2020
References
1. James SL, Abate D, Abate KH, Abay SM, Abbafati C, Abbasi N, et al. Global, regional, and national incidence, prevalence, and years lived with disability for 354 diseases and injuries for 195 countries and territories, 1990–2017: a systematic analysis for the global burden of disease study 2017. Lancet. 2018;392(10159):1789–858.
2. Zhang Y, Lazzarini PA, McPhail SM, van Netten JJ, Armstrong DG, Pacella RE. Global disability burdens of diabetes-related lower-extremity complications in 1990 and 2016. Diabetes Care. 2020;43(5):964–74.
3. WHO/Europe. Diabetes - Data and statistics [Internet]. 2019 [cited 2019 Sep 20]. Available from:http://www.euro.who.int/en/health-topics/
noncommunicable-diseases/diabetes/data-and-statistics. 4. Schwingshackl L, Hoffmann G, Lampousi A-M, Knuppel S, Iqbal K,
Schwedhelm C, et al. Food groups and risk of type 2 diabetes mellitus: a systematic review and meta-analysis of prospective studies. Eur J Epidemiol. 2017;32(5):363–75.
5. Mostafalou S, Abdollahi M. Pesticides: an update of human exposure and toxicity. Arch Toxicol. 2017;91(2):549–99.
6. Bulka CM, Daviglus ML, Persky VW, Durazo-Arvizu RA, Avilés-Santa ML, Gallo LC, et al. Occupational exposures and metabolic syndrome among Hispanics/Latinos. J Occup Environ Med. 2017;59(11):1047–55. 7. Berg ZK, Beatriz R, James D, Katz Alan R, Cooney Robert V, Kamal M.
Association Between Occupational Exposure to Pesticides and Cardiovascular Disease Incidence: The Kuakini Honolulu Heart Program. J Am Heart Assoc. 2019;8(19):e012569.
8. Collectif INSERM. Pesticides : Effets sur la santé, une expertise collective de l’Inserm [Internet]. Salle de presse | Inserm. 2013 [cited 2016 Aug 21]. Available from: http://presse.inserm.fr/pesticides-effets-sur-la-sante-une-expertise-collective-de-linserm/8463/.
9. Evangelou E, Ntritsos G, Chondrogiorgi M, Kavvoura FK, Hernández AF, Ntzani EE, et al. Exposure to pesticides and diabetes: a systematic review and meta-analysis. Environ Int. 2016;91:60–8.
10. Thayer KA, Heindel JJ, Bucher JR, Gallo MA. Role of environmental chemicals in diabetes and obesity: a National Toxicology Program workshop review. Environ Health Perspect. 2012;120(6):779.
11. Lasram MM, Dhouib IB, Annabi A, El Fazaa S, Gharbi N. A review on the molecular mechanisms involved in insulin resistance induced by organophosphorus pesticides. Toxicology. 2014;322:1–13.
12. Velmurugan G, Ramprasath T, Gilles M, Swaminathan K, Ramasamy S. Gut microbiota, endocrine-disrupting chemicals, and the diabetes epidemic. Trends Endocrinol Metab. 2017;28(8):612–25.
13. Kim KH, Kabir E, Jahan SA. Exposure to pesticides and the associated human health effects. Sci Total Environ. 2017; 575(1879–1026 (Electronic)):525–535. 14. Xiao X, Clark JM, Park Y. Potential contribution of insecticide exposure and development of obesity and type 2 diabetes. Food Chem Toxicol. 2017;105: 456–74.
15. Council Regulation (EC) No 834/2007 of 28 June 2007 on organic production and labelling of organic products and repealing Regulation (EEC) No 2092/91. OJ L 189, 20.7.2007, p. 1–23 (BG, ES, CS, DA, DE, ET, EL, EN, FR, IT, LV, LT, HU, MT, NL, PL, PT, RO, SK, SL, FI, SV). Special edition in Croatian: Chapter 15 Volume 008 P. 139 - 161. In force: This act has been changed. Current consolidated version: 01/07/2013. ELI:https://eur-lex. europa.eu/eli/reg/2007/834/oj.
16. Mie A, Kesse-Guyot E, Rembialkowska E, Grandjean P, Gunnarsson S. Human health implications of organic food and organic agriculture. 2016 Dec.
17. Authority (EFSA) EFS. Monitoring data on pesticide residues in food: results on organic versus conventionally produced food. EFSA Support Publications. 2018;15(4):1397E.
18. Baudry J, Pointereau P, Seconda L, Vidal R, Taupier-Letage B, Langevin B, et al. Improvement of diet sustainability with increased level of organic food in the diet: findings from the BioNutriNet cohort. Am J Clin Nutr. 2019; 109(4):1173–88.
19. Baudry J, Debrauwer L, Durand G, Limon G, Delcambre A, Vidal R, et al. Urinary pesticide concentrations in French adults with low and high organic food consumption: results from the general population-based NutriNet-Santé. J Exp Sci Env Epidemiol. 2018;5:1.
20. Sun Y, Liu B, Du Y, Snetselaar LG, Sun Q, Hu FB, et al. Inverse Association between Organic Food Purchase and Diabetes Mellitus in US Adults. Nutrients [Internet]. 2018;10(12). Available from:https://www.ncbi.nlm.nih. gov/pmc/articles/PMC6316834/[cited 2019 Sep 24].
21. Hercberg S, Castetbon K, Czernichow S, Malon A, Mejean C, Kesse E, et al. The Nutrinet-Santé study: a web-based prospective study on the relationship between nutrition and health and determinants of dietary patterns and nutritional status. BMC Public Health. 2010;10:242. 22. Baudry J, Méjean C, Allès B, Péneau S, Touvier M, Hercberg S, et al.
Contribution of organic food to the diet in a large sample of French adults (the NutriNet-Santé cohort study). Nutrients. 2015;7(10):8615–32.
23. Nutrinet-Santé E. Table de composition des aliments de l’étude Nutrinet-Santé (Nutrinet-Santé Study Food Composition Database). Paris: Economica; 2013. 24. Chaltiel D, Adjibade M, Deschamps V, Touvier M, Hercberg S, Julia C, et al.
Programme National Nutrition Santé– guidelines score 2 (PNNS-GS2): development and validation of a diet quality score reflecting the 2017 French dietary guidelines. Br J Nutr. 2019;122(3):331–42.
25. Vergnaud A-C, Touvier M, Méjean C, Kesse-Guyot E, Pollet C, Malon A, et al. Agreement between web-based and paper versions of a
socio-demographic questionnaire in the NutriNet-Santé study. Int J Public Health. 2011;56(4):407–17.
26. INSEE. Definitions and methods. 2009 [cited 2015 Feb 23]; Available from:
http://www.insee.fr/en/methodes/.
27. Hallal PC, Victora CG. Reliability and validity of the International Physical Activity Questionnaire (IPAQ). MedSciSports Exerc. 2004 ;36(0195–9131 (Print)):556. 28. Lassale C, Péneau S, Touvier M, Julia C, Galan P, Hercberg S, et al. Validity of
web-based self-reported weight and height: results of the Nutrinet-Santé study. J Med Internet Res. 2013;15(8):e152.
29. Desquilbet L, Mariotti F. Dose-response analyses using restricted cubic spline functions in public health research. Stat Med. 2010;29(9):1037–57. 30. Sofi F, Macchi C, Abbate R, Gensini GF, Casini A. Mediterranean diet and health status: an updated meta-analysis and a proposal for a literature-based adherence score. Public Health Nutr. 2014;17(12):2769–82. 31. Kesse-Guyot E, Baudry J, Assmann KE, Galan P, Hercberg S, Lairon D.
Prospective association between consumption frequency of organic food and body weight change, risk of overweight or obesity: results from the NutriNet-Santé study. Br J Nutr. 2017;117(2):325–34.
32. Baudry J, Lelong H, Adriouch S, Julia C, Allès B, Hercberg S, et al. Association between organic food consumption and metabolic syndrome: cross-sectional results from the NutriNet-Santé study. Eur J Nutr 2017;. 33. Eisinger-Watzl M, Wittig F, Heuer T, Hoffmann I. Customers purchasing
organic food - do they live healthier? Results of the German National Nutrition Survey II. EurJNutrFood Saf. 2015;5(1):59–71.
34. Cordts A, Wittig F, Schulze B, Eisinger-Watzl M, Heuer T, Spiller A, et al. A typology comparing male organic consumers and non-organic consumers: nutrition, health and buying behaviors. Ernahrungs Umschau. 2013;60(3):36–42. 35. Andersen HR, Tinggaard J, Grandjean P, Jensen TK, Dalgård C, Main KM.
Prenatal pesticide exposure associated with glycated haemoglobin and markers of metabolic dysfunction in adolescents. Environ Res. 2018;166:71–7. 36. Lukowicz C, Ellero-Simatos S, Régnier M, Polizzi A, Lasserre F,
Montagner A, et al. Metabolic effects of a chronic dietary exposure to a low-dose pesticide cocktail in mice: sexual dimorphism and role of the constitutive Androstane receptor. Environ Health Perspect. 2018;126(6): 067007.
37. Merhi M, Demur C, Racaud-Sultan C, Bertrand J, Canlet C, Estrada FBY, et al. Gender-linked haematopoietic and metabolic disturbances induced by a pesticide mixture administered at low dose to mice. Toxicology. 2010;267(1):80–90.
38. Comfort N, Re DB. Sex-specific neurotoxic effects of organophosphate pesticides across the life course. Curr Environ Health Rep. 2017;4(4):392–404.
39. Liang X, Feswick A, Simmons D, Martyniuk CJ. Environmental toxicology and omics: a question of sex. J Proteome. 2018;172:152–64.
40. Baudry J, Ducros V, Druesne-Pecollo N, Galan P, Hercberg S, Debrauwer L, et al. Some Differences in Nutritional Biomarkers are Detected Between Consumers and Nonconsumers of Organic Foods: Findings from the BioNutriNet Project. Curr Dev Nutr. 2019 ;3(3):nzy090.
41. Yang H, Jin X, Kei Lam CW, Yan S-K. Oxidative stress and diabetes mellitus. Clin Chem Lab Med. 2011;49(11):1773–82.
42. Tan BL, Norhaizan ME. Carotenoids: How Effective Are They to Prevent Age-Related Diseases? Molecules [Internet]. 2019 9 [cited 2019 Oct 30];24(9). Available from:https://www.ncbi.nlm.nih.gov/pmc/articles/PMC6539799/. 43. Bradman A, Quirós-Alcalá L, Castorina R, Aguilar Schall R, Camacho J,
Holland NT, et al. Effect of Organic Diet Intervention on Pesticide Exposures in Young Children Living in Low-Income Urban and Agricultural Communities. Environmental Health Perspectives. 2015;123(10). 44. Curl CL, Beresford SAA, Fenske RA, Fitzpatrick AL, Lu C, Nettleton JA, et al.
Estimating pesticide exposure from dietary intake and organic food choices: the multi-ethnic study of atherosclerosis (MESA). Environ Health Perspect. 2015;123(5):475–83.
45. Curl CL, Porter J, Penwell I, Phinney R, Ospina M, Calafat AM. Effect of a 24-week randomized trial of an organic produce intervention on pyrethroid and organophosphate pesticide exposure among pregnant women. Environ Int. 2019;132:104957.
46. Oates L, Cohen M, Braun L, Schembri A, Taskova R. Reduction in urinary organophosphate pesticide metabolites in adults after a week-long organic diet. Environ Res. 2014;132:105–11.
47. Lu C, Toepel K, Irish R, Fenske RA, Barr DB, Bravo R. Organic diets significantly lower Children’s dietary exposure to Organophosphorus pesticides. Environ Health Perspect. 2006;114(2):260–3.
48. Yilmaz B, Terekeci H, Sandal S, Kelestimur F. Endocrine disrupting chemicals: exposure, effects on human health, mechanism of action, models for testing and strategies for prevention. Rev Endocr Metab Disord. 2019:3. 49. Mostafalou S, Abdollahi M. Pesticides and human chronic diseases:
evidences, mechanisms, and perspectives. Toxicol Appl Pharmacol. 2013; 268(2):157–77.
50. Andreeva VA, Salanave B, Castetbon K, Deschamps V, Vernay M, Kesse-Guyot E, et al. Comparison of the sociodemographic characteristics of the large NutriNet-Santé e-cohort with French census data: the issue of volunteer bias revisited. J Epidemiol Community Health. 2015;69(9):893–8.
51. Andreeva VA, Deschamps V, Salanave B, Castetbon K, Verdot C, Kesse-Guyot E, et al. Comparison of dietary intakes between a large online cohort study (etude NutriNet-Santé) and a nationally representative cross-sectional study (etude Nationale nutrition Santé) in France: addressing the issue of generalizability in E-epidemiology. Am J Epidemiol. 2016;184(9):660–9.
Publisher’s Note
Springer Nature remains neutral with regard to jurisdictional claims in published maps and institutional affiliations.