HAL Id: inserm-01580854
https://www.hal.inserm.fr/inserm-01580854
Submitted on 3 Sep 2017
HAL is a multi-disciplinary open access
archive for the deposit and dissemination of
sci-entific research documents, whether they are
pub-lished or not. The documents may come from
teaching and research institutions in France or
abroad, or from public or private research centers.
L’archive ouverte pluridisciplinaire HAL, est
destinée au dépôt et à la diffusion de documents
scientifiques de niveau recherche, publiés ou non,
émanant des établissements d’enseignement et de
recherche français ou étrangers, des laboratoires
publics ou privés.
of AMPA receptors: putative role of the ACSL4-cPLA2
balance
Mélanie Thomas, Cédric Paris, Mylène Magnien, Julie Colin, Sandra
Pelleïeux, Florence Coste, Marie-Christine Escanyé, Thierry Pillot, Jean-Luc
Olivier
To cite this version:
Mélanie Thomas, Cédric Paris, Mylène Magnien, Julie Colin, Sandra Pelleïeux, et al.. Dietary
arachi-donic acid increases deleterious effects of amyloid-β oligomers on learning abilities and expression of
AMPA receptors: putative role of the ACSL4-cPLA2 balance. Alzheimer’s Research and Therapy,
BioMed Central, 2016, 9 (1), pp.69. �10.1186/s13195-017-0295-1�. �inserm-01580854�
R E S E A R C H
Open Access
Dietary arachidonic acid increases
deleterious effects of amyloid-
β oligomers
on learning abilities and expression of
AMPA receptors: putative role of the
ACSL4-cPLA
2
balance
Mélanie H. Thomas
1, Cédric Paris
2, Mylène Magnien
1, Julie Colin
1, Sandra Pelleïeux
1,3, Florence Coste
1,
Marie-Christine Escanyé
3, Thierry Pillot
4and Jean-Luc Olivier
1,3*Abstract
Background: Polyunsaturated fatty acids play a crucial role in neuronal function, and the modification of these compounds in the brain could have an impact on neurodegenerative diseases such as Alzheimer’s disease. Despite the fact that arachidonic acid is the second foremost polyunsaturated fatty acid besides docosahexaenoic acid, its role and the regulation of its transfer and mobilization in the brain are poorly known.
Methods: Two groups of 39 adult male BALB/c mice were fed with an arachidonic acid-enriched diet or an oleic acid-enriched diet, respectively, for 12 weeks. After 10 weeks on the diet, mice received intracerebroventricular injections of either NaCl solution or amyloid-β peptide (Aβ) oligomers. Y-maze and Morris water maze tests were used to evaluate short- and long-term memory. At 12 weeks on the diet, mice were killed, and blood, liver, and brain samples were collected for lipid and protein analyses.
Results: We found that the administration of an arachidonic acid-enriched diet for 12 weeks induced short-term memory impairment and increased deleterious effects of Aβ oligomers on learning abilities. These cognitive alterations were associated with modifications of expression ofα-amino-3-hydroxy-5-methyl-4-isoxazolepropionic acid receptors, postsynaptic density protein 95, and glial fibrillary acidic protein in mouse cortex or hippocampus by the arachidonic acid-enriched diet and Aβ oligomer administration. This diet also led to an imbalance between the main ω-6 fatty acids and theω-3 fatty acids in favor of the first one in erythrocytes and the liver as well as in the hippocampal and cortical brain structures. In the cortex, the dietary arachidonic acid also induced an increase of arachidonic acid-containing phospholipid species in phosphatidylserine class, whereas intracerebroventricular injections modified several arachidonic acid- and docosahexaenoic acid-containing species in the four phospholipid classes. Finally, we observed that dietary arachidonic acid decreased the expression of the neuronal form of acyl-coenzyme A synthetase 4 in the hippocampus and increased the cytosolic phospholipase A2activation level in the cortices of the mice.
(Continued on next page)
* Correspondence:jean-luc.olivier@univ-lorraine.fr;jl.olivier@chru-nancy.fr
1Research unit on Animals and Functionality of Animal Products (URAFPA),
Lorraine University, EA 3998, USC INRA 0340, 2, Avenue de la Forêt de Haye,
TSA40602, F-54518 Vandœuvre-lès-Nancy, France
3Biochemistry Department, Central Hospital, University Hospitals of Nancy, 24,
avenue du Mal de Lattre de Tassigny, CO n°34, F-54018 Nancy, France Full list of author information is available at the end of the article
© The Author(s). 2017 Open Access This article is distributed under the terms of the Creative Commons Attribution 4.0 International License (http://creativecommons.org/licenses/by/4.0/), which permits unrestricted use, distribution, and reproduction in any medium, provided you give appropriate credit to the original author(s) and the source, provide a link to the Creative Commons license, and indicate if changes were made. The Creative Commons Public Domain Dedication waiver (http://creativecommons.org/publicdomain/zero/1.0/) applies to the data made available in this article, unless otherwise stated.
(Continued from previous page)
Conclusions: Dietary arachidonic acid could amplify Aβ oligomer neurotoxicity. Its consumption could constitute a risk factor for Alzheimer’s disease in humans and should be taken into account in future preventive strategies. Its deleterious effect on cognitive capacity could be linked to the balance between arachidonic acid-mobilizing enzymes.
Keywords: Alzheimer’s disease, Amyloid-β oligomers, Arachidonic acid, Diet, Phospholipid species, AMPA receptors, Acyl-CoA synthetase 4, Cytosolic phospholipase A2
Background
Alzheimer’s disease (AD) and other senile dementias represent a major health problem worldwide, not only in high-income but also in low-income countries, because the number of elderly people is increasing. Despite tremendous work and clinical trials, there is currently no efficient therapy against these diseases. The many failures encountered in the fight against these diseases may be due to the facts that they operate silently over a period of 10 years or more and that therapies are applied after the occurrence of clinical signs, when brain injuries are very advanced. In this context, and considering the high economic and social costs of these diseases, the development of preventive strategies appears to be neces-sary to delay the occurrence of these diseases. Better knowledge of risk or protective factors is a first step in the design of these preventive strategies. Food components such as fatty acids represent the first modifiable factor. Whereas the role ofω-3 fatty acids and particularly that of the longest one, docosahexaenoic acid (DHA), have been the subject of many studies in the context of AD, the im-pact of dietary arachidonic acid (ARA) and otherω-6 fatty acids is considerably less well known.
ARA is the second most prevalent polyunsaturated fatty acid (PUFA) in the brain membrane phospholipids besides the neuroprotective DHA. Once released from these phospholipids, free ARA is involved in synaptic function at several levels. It modulates exocytosis of the presynaptic neurotransmitters by inducing soluble N-ethylmaleimide-sensitive factor attachment protein receptor formation through its interactions with syntaxin-1A and Munc18 [1, 2]. Studies in zebrafish evidenced that ARA also controls neuronal branch growth and synapse forma-tion by acting as a retrograde messenger [3, 4]. In rat hippocampus, ARA released from the postsynaptic terminal facilitates the presynaptic exocytosis of glutamate [5] and acetylcholine [6] neurotransmitters. More recently, Carta et al. [7] showed that ARA is released in an activity-dependent manner from postsynaptic hippocampal CA3 pyramidal cells and tunes synaptic transmission by modu-lating presynaptic voltage-gated potassium channels. In addition to its involvement in synaptic plasticity and transmission, free ARA plays a crucial role in neuroin-flammation through its conversion into various eicosa-noids by cyclooxygenases, prostaglandin synthases, and
lipoxygenases, whose activities have been associated with neurodegenerative diseases [8, 9]. In the majority of the studies, researchers have assumed that the pro-duction of eicosanoids would contribute to synaptic loss in AD [10], although some positive effects have also been described [11].
ARA is specifically released from membrane phospho-lipids by cytosolic phospholipase A2 (cPLA2), which is
translocated to the membranes in a cytosolic calcium-dependent manner after its phosphorylation on Ser505 by mitogen-activated protein kinases [12]. We and others [13–15] have shown that cPLA2is activated by amyloid-β
peptide (Aβ) oligomers and that its pharmacological in-hibition or the suppression of its expression protects neur-onal cells against the neurotoxicity of Aβ oligomers and preserves cognitive abilities. According to the Lands cycle [16], ARA released by cPLA2can be reincorporated into
the membranes by lysophospholipid acyl transferases after its activation into arachidonoyl coenzyme A (CoA) by acyl-CoA synthetases. Among these enzymes, acyl coen-zyme A synthetase 4 (ACSL4) preferentially uses ARA as a substrate and is expressed in neuronal cells as a neuron-specific isoform [17]. To our knowledge, it is not known whether ACSL4 expression or activity is modified by Aβ oligomers. Over the last few decades, numerous studies have clearly shown that Aβ oligomers play a pivotal role in AD through early cognitive alterations by targeting hip-pocampal synapses [18]. The identity of the receptor(s) of these oligomers on neuronal membranes is still a subject of debate, with more than 15 proteins having been pro-posed for the binding of Aβ oligomers [18]. The concept of formation of a signaling complex between Aβ oligomers and the cellular prion protein (PrPc) has emerged recently. PrPc physically binds Aβ oligomers and interacts with several molecular actors, such as metabotropic glutamate receptor 5 [19] and LRP1 [20]. PrPc also activates cPLA2
in association with its localization in membrane rafts, em-phasizing the importance of this ARA-releasing enzyme in the response to Aβ oligomers [21]. Besides the metabotro-pic glutamate receptor 5, Aβ oligomers affect the activ-ity and recycling of the N-methyl-D-aspartate (NMDA)
and α-amino-3-hydroxy-5-methyl-4-isoxazolepropionic acid (AMPA) receptors [22, 23]. Inhibition of long-term potentiation (LTP) and induction of long-term depres-sion by Aβ oligomers are considered the putative
cellular basis of the memory alterations observed in AD and could be mediated by increased internalization and reduced phosphorylation level of the glutamate recep-tor 1 (GluR1) AMPA receprecep-tors [24].
In this study, we investigated the effect of dietary ARA on the sensitivity of mice to Aβ42 oligomers. We show
that an increase of ARA intake induced cognitive alter-ation and increased the neurotoxicity of Aβ42oligomers.
To explain these effects, we determined how this diet modified (1) fatty acid composition in peripheral and brain tissues, (2) expression levels of synaptic markers and AMPA receptors, and (3) cPLA2 and ACSL4
balance.
Methods Animal handling
All experiments were performed in accordance with the European Union (2010/63/EU) and French directives (2013/118) for animal experimentation regarding the use and care of laboratory animals, as well as with the 3 Rs requirements for animal welfare. The experimental pro-tocols were approved by the regional ethics committee of Lorraine (CELMEA project number 02683.02). Ani-mals were housed according to a 12-h/12-h light/dark cycle with a mean temperature of 21–22 °C and relative humidity of 50 ± 20%, and they were provided either of the two different diets and water ad libitum. Male BALB/c mice 6 weeks of age were provided by Janvier Labs (Le Genest St-Isle, France) and housed in the ani-mal facilities of our laboratory for a 2-week adaptation period. The mice were fed the Harlan Laboratories 2018 standard diet (Teklad Diets/Envigo, Madison, WI, USA) during this adaptation period, before the beginning of the experiments. At 8 weeks of age, the mice were fed ad libitum for 12 weeks with one of two diets (n = 39 per group; named ARA for arachidonic acid and OLE for oleic acid, which will be explained in the next section on diet design). After 10 weeks of the diet, Aβ42 oligomers
(0.5 nmol in 1μl) or vehicle (0.15 M NaCl) were injected into the brain’s right ventricle of anesthetized mice (NaCl-injected OLE mice, n = 19; NaCl-injected ARA mice, n = 19; Aβ42-injected OLE mice, n = 20; Aβ42-injected ARA
mice, n = 20) according to the stereotactic coordinates from the bregma (anteroposterior, −0.22 mm; lateral, −1 mm; dorsal, +2.5 mm). Injections were done using a 10-μl Hamilton microsyringe fitted with a 26-gauge needle. All surgical procedures were performed on anesthetized mice (ketamine-xylazine mix, 1 mg/10 g body weight, intraperitoneal injection). The cognitive performance of the mice was tested 3–14 days after the injections. Blood was collected from the submandibular vein twice: first at the end of the adaptation period, before the initiation of the OLE and ARA diets, and then at the end of the 12 experimental weeks, 2 weeks after Aβ
oligomer or control intracerebroventricular (icv) injec-tions and just before the mice were killed. Blood pellets and plasma samples were stored at −80 °C after separ-ation and before biochemical analyses. Twenty-week-old BALB/c mice were killed by isoflurane inhalation (Mundipharma, Paris, France). The liver, cerebral cor-tex, and hippocampus were collected, rapidly frozen in liquid nitrogen, and stored at −80 °C until biochemical analysis.
Diet design
Two diets were tested in this study. One of them, the ARA diet, was a ω-6 acid- and ARA-rich diet and was prepared with 20 g/kg hemp oil (Earl de la Fermes d’Ormes, Ormes, France), 55 g/kg lard (Scientific Ani-mal Food & Engineering, Augy, France), and 25 g/kg ARASCO oil (DSM Nutritional Products, Courbevoie, France) added to the 210 control diet (Scientific Animal Food & Engineering). In the other diet, the OLE-rich diet, OLE replaced ARA, whereas the amounts of the other fatty acids remained similar to those in the ARA diet. The OLE diet was prepared with sunflower (5 g/kg) and rape (30 g/kg) oils (Earl de la Fermes d’Ormes) and lard (65 g/kg; Scientific Animal Food & Engineering). Diet composition was calculated by gas chromatography (GC) analysis of the various oils and lard and checked after preparation by Scientific Animal Food & Engineer-ing. The proportions of proteins, carbohydrate, and fat, as well as the fatty acid composition, of each diet are shown in Table 1. The two diets contained 10% fat and similar amounts of saturated stearic and palmitic acids: 33.4% (OLE diet) and 32.9% (ARA diet) with ratios pal-mitic acid/stearic acid of 2.1 and 1.9, respectively (Table 1). Compared with the standard diet (Teklad Diets), which is commonly used in our laboratory and contains 6.2% lipids, the OLE and ARA diets provided approximatively threefold higher amounts of saturated fatty acids (Table 1). The OLE and ARA diets also con-tained 5.7% and 5.3%, respectively, of the ω-3 precursor α-linolenic acid, above the 4.4% found in the standard diet (Table 1). Therefore, the ARA and OLE diets pro-vided approximatively twice the α-linolenic acid per gram of food compared with that in the standard diet. In addition, the ARA and OLE diets provided 0.9% and 0.2% DHA, respectively, whereas the standard diet did not contain any ω-3 PUFA (Table 1). By contrast, the OLE and ARA diets provided between 33% and 50% less linoleic acid (ω-6 precursor). Diets were stored at 4 °C and protected from light to prevent oxidation.
Preparation of Aβ42oligomers
Aβ42 peptides were obtained from Bachem Distribution
Services (Weil am Rhein, Germany). To overcome prob-lems of peptide solubility at high concentrations, fresh
peptide stock solutions were prepared at 5 mg/ml in the disaggregating solvent hexafluoro-2-propanol and kept frozen at −80 °C. Soluble Aβ42 oligomers were prepared
as stock solutions at the concentration of 0.5 mM in sterile 0.1 M PBS (pH 7.4), and aliquots were stored at −20 °C until use as previously described [15, 25]. Aβ42
oligomers preparations do not contain fibrils; they con-tain mainly monomers, dimers, trimers, and tetramers (Additional file 1). Each batch of oligomers was checked for cellular toxicity on neuronal cell primary cultures and for their effect on animal cognitive abilities before their use in the experiments.
Behavioral analyses Y-maze
Immediate working memory performance was assessed by recording spontaneous alternation behavior in a Y-maze as previously described [25]. The Y-Y-maze task was carried out on day 4 after soluble Aβ42oligomer
admin-istration. The maze was made of opaque Plexiglas, and the arms were 40 cm long, 16 cm high, 9 cm wide, and positioned at equal angles. Mice were placed at the end of one arm and allowed to move freely through the maze
during a 5-minute session. The series of arm entries were recorded visually, and arm entry was considered to be completed when the hind paws of the mouse were completely placed in the arm. Alternation was defined as successive entries into the three arms on overlapping triplet sets. The percentage alternation was calculated as the ratio of actual (total alternations) to possible (defined as the number of arm entries minus two) alternations, multiplied by 100 [26].
Morris water maze
The Morris water maze was performed as previously de-scribed [27]. The experimental apparatus consisted of a circular water tank (diameter 80 cm, height 50 cm) con-taining water at 22 °C and rendered opaque by adding an aqueous acrylic emulsion. A platform (diameter 10 cm) was submerged 1 cm below the water surface and placed at the midpoint of one quadrant. The pool was placed in a test room homogeneously brightened at 100 lx and con-taining various prominent visual cues on the walls. The swimming paths of the animals were recorded using a video tracking system.
On days 3 and 4 after injection, navigation to a visible platform was performed before place navigation to evaluate visual and motor abilities of the animals. Mice were subjected to four trials per day, with two trials in the morning and two trials in the afternoon and an interval between trials of at least 45 minutes. There was no additional maze cue in the room. The platform pos-ition and starting points were randomly distributed over all four quadrants of the pool. Mice that failed to find the platform after 60 seconds were guided to its location.
Next, memory acquisition trials (training) were per-formed four times daily on 5 consecutive days to reach a steady state of escape latency. The mice were allowed to swim freely for 60 seconds, left alone for an additional 30 seconds on the hidden platform, and then returned to the home cage during the intertrial interval. The intervals between the trials were 45 minutes. The start positions, set at each limit between quadrants, were randomly selected for each animal. In each trial, the time required to escape onto the hidden platform was re-corded. Mice failing to find the platform within 60 seconds were placed on the platform for 10 seconds at the end of the trial.
Memory retention tests (probe trials) were performed 3 days after the last training session (14 days after injec-tion). The platform was removed, and each mouse was allowed a free 60-second swim. The latency to cross the quadrant of the previous location of the platform and the time spent in each of the four quadrants were mea-sured by replay using a video recorder.
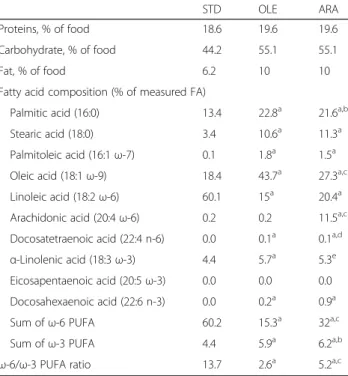
Table 1 Composition of the standard, oleic acid-enriched, and arachidonic acid-enriched diets
STD OLE ARA
Proteins, % of food 18.6 19.6 19.6
Carbohydrate, % of food 44.2 55.1 55.1
Fat, % of food 6.2 10 10
Fatty acid composition (% of measured FA)
Palmitic acid (16:0) 13.4 22.8a 21.6a,b
Stearic acid (18:0) 3.4 10.6a 11.3a
Palmitoleic acid (16:1ω-7) 0.1 1.8a 1.5a
Oleic acid (18:1ω-9) 18.4 43.7a 27.3a,c
Linoleic acid (18:2ω-6) 60.1 15a 20.4a
Arachidonic acid (20:4ω-6) 0.2 0.2 11.5a,c
Docosatetraenoic acid (22:4 n-6) 0.0 0.1a 0.1a,d
α-Linolenic acid (18:3 ω-3) 4.4 5.7a 5.3e
Eicosapentaenoic acid (20:5ω-3) 0.0 0.0 0.0
Docosahexaenoic acid (22:6 n-3) 0.0 0.2a 0.9a
Sum ofω-6 PUFA 60.2 15.3a 32a,c
Sum ofω-3 PUFA 4.4 5.9a 6.2a,b
ω-6/ω-3 PUFA ratio 13.7 2.6a 5.2a,c
Abbreviations: ARA Arachidonic acid-enriched diet, FA Fatty acid, OLE Oleic acid-enriched diet,PUFA Polyunsaturated fatty acid, STD Standard diet
a
p < 0.001, OLE or ARA compared with STD
b
p < 0.01, ARA compared with OLE
cp < 0.001, ARA compared with OLE d
p < 0.05, ARA compared with OLE
e
Biochemical analyses
Immunoblot analysis and enzyme-linked immunosorbent assay
Homogenates were prepared from the cortex and hippo-campus. Briefly, brain regions were dissected and homogenized in 25 mM Tris-HCl containing 150 mM NaCl, 1 mM ethylenediaminetetraacetic acid (EDTA), 1% (vol/vol) Nonidet P-40, 1% (wt/vol) sodium deoxy-cholate, and 0.1% (wt/vol) SDS and protease inhibitors (cOmplete protease inhibitor cocktail; Roche, Basel, Switzerland). After homogenization, tissues were lysed using two cycles of freezing and thawing and finally cen-trifuged at 4 °C for 10 minutes at 10,000 × g. The protein concentration in the supernatant was determined using a Pierce bicinchoninic acid protein assay kit (Thermo Fisher Scientific, Waltham, MA, USA). Synaptosomal membrane-enriched fractions were prepared as previously described and were used to evaluate the expression levels of synaptic proteins [26]. The cortex and hippocampus were dissected and rapidly homogenized in ice-cold 10 mM Tris buffer (pH 7.4) containing 0.32 mM sucrose, 2 mM EDTA, 10μg/ml sodium orthovanadate, and prote-ase inhibitors (cOmplete proteprote-ase inhibitor cocktail). The homogenate was spun at 800 × g for 15 minutes to remove nuclei and cell debris. The resulting supernatant was then centrifuged at 12,000 × g for 20 minutes, and a second pellet was collected.
Samples (10μg) were mixed with an equal volume of 2× Laemmli buffer and denaturated by heating the mixture for 5 minutes at 95 °C. Samples were then subjected to SDS-PAGE and immunoblotting on polyvinylidene difluor-ide membranes. The following antibodies were used: AMPA receptors GluR1–GluR4 (1:1000 dilution; Cell Signaling Technology, St-Quentin-en-Yvelines, France), postsynaptic density protein 95 (PSD95) (1:1000 dilution; Cell Signaling Technology), glial fibrillary acidic protein (GFAP) (1:1000 dilution; Merck Millipore, Molsheim, France), TREM-2 (1:500 dilution; Abcam, Paris, France), phosphorylated cytosolic phospholipase A2 (P-cPLA2)
(1:1000 dilution; Cell Signaling Technology), cPLA2
(1:1000 dilution; Cell Signaling Technology), ACSL4 (1:1000 dilution; Santa Cruz Biotechnology, Heidelberg, Germany), andβ-tubulin (1:10,000 dilution; Sigma-Aldrich Chemie, St-Quentin Fallavier, France). Immunoblots were probed with the corresponding HRP-conjugated secondary antibodies (1:2000 dilution; Cell Signaling Technology) and detected using an enhanced chemiluminescence protocol (SuperSignal HRP Substrate; Merck Millipore). The FUSION FX5 system (Vilber Lourmat, Marne-la-Vallée, France) was used to detect chemiluminescence, and Ima-geJ software (National Institutes of Health, Bethesda, MD, USA) was used to quantify the protein levels.
Concentrations of the Iba1/AIF-1 protein and the GluR3 and GluR4 AMPA receptors were measured in
the cortex and hippocampus homogenates by using spe-cific murine enzyme-linked immunosorbent assay (ELISA) kits from Cloud-Clone Corporation (Katy, TX, USA). Specific kits furnished by Aviva Systems Biology Corporation (San Diego, CA, USA) were used to evalu-ate concentrations of the murine GluR1 and GluR2 AMPA receptors. All the ELISA measurements were performed according the furnisher’s recommendations.
Cholesterol and triglyceride measurements
Blood samples were collected in tubes containing a 5% EDTA solution and were centrifuged at 12,000 × g to sep-arate plasma from erythrocytes, which were preserved at −80 °C. Cholesterol and triglyceride concentrations were measured with enzymatic activity identification kits (cholesterol RTU and triglyceride RTU; bioMérieux, Marcy-l’Étoile, France France) in eight plasma samples in each of the four mouse subgroups (NaCl-injected OLE mice, Aβ42-injected OLE mice, NaCl-injected ARA mice,
and Aβ42-injected ARA mice). Fatty acid GC analysis
Lipids were extracted from erythrocytes and liver and brain structures according to the Folch protocol [28]. Erythrocyte lipids were extracted by mixing 100 μl of erythrocyte pellets with 3 ml of chloroform and isopro-panol. After mixing, upper and lower phases were sepa-rated at 1500 × g for 10 minutes at 4 °C. The upper phases were recovered and evaporated under a nitrogen gas stream. Then, the various lipid extracts were pre-pared by transesterification as described by Lepage and Roy [29]. Transesterification reactions were stopped by potassium carbonate, strongly homogenized, and finally centrifuged at 4 °C for 10 minutes at 2000 × g. The supernatants were recovered and were added to 2 ml of acetonitrile. Then, the mixtures were strongly homoge-nized and centrifuged at 4 °C for 10 minutes at 2000 × g. The upper phases were recovered and evaporated under a continual stream of nitrogen gas. Samples were then diluted in 50μl of hexane and injected into a Clarus 480 gas chromatograph (PerkinElmer, Waltham, MA, USA) provided with an automatic injector. The esterified fatty acids were separated in a DB-23 column [(50%-cyano-propyl-phenyl)-methylpolysiloxane; Agilent Technolo-gies, Massy, France] and detected with flame ionization. The temperature of the injector was fixed at 270 °C, and that of the detector was fixed at 280 °C. The column oven temperature, originally at 170 °C, was gradually in-creased by 2.8 °C/minute, then by 0.1 °C/minute, to reach 230 °C. The vector gas was nitrogen with a pres-sure of 400 kPa. The prespres-sure at the top of the column was 40 kPa. The peaks obtained were integrated by using the EZChrom Elite software (Agilent Technologies) and
quantified by using a standard range between 25 and 100 μg/ml of the main fatty acids (palmitic, palmitoleic, stearic, oleic, linolenic, linoleic, arachidonic, eicosapenta-enoic, docosatetraeicosapenta-enoic, and docosahexaenoic acids; Sigma-Aldrich Chemie). The results are presented as percentages of these ten fatty acids.
Phospholipid analysis by liquid chromatography-tandem mass spectrometry
After extraction and evaporation of the solvent, lipids were diluted in 200μl of choloroform:methanol (2:1), and 16 μl of each sample was injected into an ultra-high-pressure liquid chromatography-mass spectrometry sys-tem (Thermo Fisher Scientific, San Jose, CA, USA). The lipids were separated on a LiChroCART, LiChrospher 100 DIOL, 250 × 200-mm (5μm) precolumn (Merck, Darm-stadt, Germany). Chloroform was used as mobile phase A. Mobile phase B was methanol with 0.1% (vol/vol) formic acid, and ammonia was added to pH 5.3 (approximately 0.05% vol/vol ammonia) and 0.05% (vol/vol) triethylamine. Separation was accomplished by using a gradient start-ing at 95% mobile phase A, decreasstart-ing to 70% A in 11 minutes, further decreasing to 20% A in 3 minutes, and held at 20% A in 4 minutes and then back to 95% A in 2 minutes. The total chromatographic run time was 30 minutes. The flow rate was 0.3 ml/minute, and the column temperature was 30 °C [30].
After being separated, the compounds of interest were driven by the mobile phase to the source block of the mass spectrometer, where they were ionized in negative electrospray mode. The ionization parameters were as follows. The potential of the electrospray needle was 4.5 kV, and the temperature of the transfer capillary was 230 °C. The ionic optic parameters were optimized by infusion of a standard solution of a phospholipid mix-ture to maximize the mass spectrometric signal of the compounds of interest. The mass resolution was 0.2 Da. In addition to a mass spectrometric scan between 100 and 2000 mass-to-charge ratio to observe the parent ions, MS2 and MS3 fragmentation was manually per-formed to obtain structural information on phospholipid classes [30]. The interpretation of the MS2 and MS3 spectra allowed us to know the nature of the species (the fatty acid composition) of each phospholipid.
Statistical analysis
StatView software was used for the statistical analysis. Multiple pairwise comparisons among the groups of data were performed using analysis of variance followed by Scheffé’s post hoc test. p < 0.05 indicated significant differ-ences between experimental groups. All reported values represent the mean ± SEM.
Results
Body mass, cholesterolemia/triglyceridemia, and
erythrocyte/liver fatty acid composition: variation induced by ARA and OLE diets
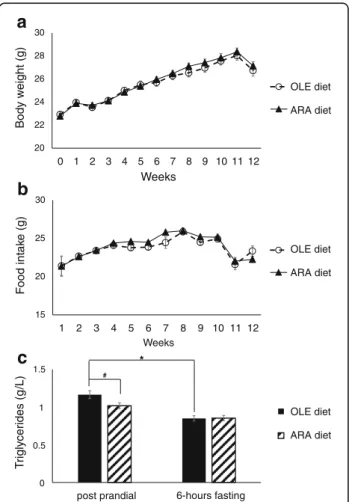
As detailed in the Methods section above, two groups of thirty-nine 8-week-old male BALB/c mice were fed one of two different diets after a 2-week adaptation period during which they were fed a standard diet. The OLE group was fed a diet rich in OLE as a control diet, and the ARA group was fed an ARA-enriched diet. The body mass gains of the two groups of mice (OLE and ARA) were identical, starting from 22.8 ± 0.2 g at the beginning of the experiments to 28.4 ± 0.3 g at the 11th week (Fig. 1a).During the last week of the experiment (12th week), the mice lost 1.4 ± 0.3 g in relation to a decrease in food intake during the 11th week (Fig. 1b), regardless
a
20 22 24 26 28 30 0 1 2 3 4 5 6 7 8 9 10 11 12 Body w eight (g) Weeks OLE diet ARA dietb
15 20 25 30 1 2 3 4 5 6 7 8 9 10 11 12 F o od int ak e (g) Weeks OLE diet ARA dietc
post prandial T rigly cerides (g /L) 6-hours fasting OLE diet ARA diet # * 1.5 0.5 1 0Fig. 1 Body weight, food intake, and plasma triglyceride evolution after mice were fed the arachidonic acid-enriched (ARA) diet. Body weight (a) and food intake b were measured once per week, and data are expressed in grams of body weight of the mice (a) and grams of food for their food intake (b). Postprandial and 6-h fasting plasma triglycerides c were measured after 12 weeks of the ARA or oleic acid-enriched (OLE) diet, and data are expressed in grams per liter (n = 16 per group; * p < 0.05 comparing the OLE and ARA mice;
#p < 0.05 comparing postprandial and 6-h fasting data). All data are
of the nature of the diets and the injected products (saline solution or Aβ42oligomers). Postprandial and 6-h
fasting cholesterolemia and triglyceridemia were mea-sured at the end of the 12 weeks of the diets in plasma of 8 mice per group (16 OLE and 16 ARA mice). Post-prandial cholesterolemia was similar in mice fed the OLE or ARA diet (1.76 g/L, on average; see Additional file 2). Fasting for 6 h decreased cholesterolemia by 11% in the same way in both diet groups (see Additional file 2). In contrast, postprandial triglyceridemia decreased by 11– 13% in mice fed the ARA diet compared with those fed the OLE diet (Fig. 1c). Fasting triglyceridemia was identi-cal in both diet groups (Fig. 1c).
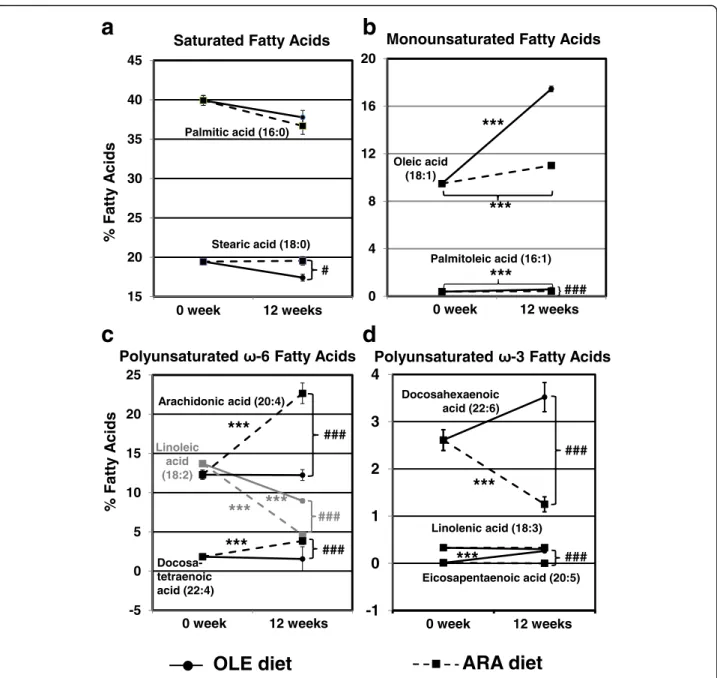
Because the two diets contained more lipids as well as different fatty acid compositions than the standard diet, which was given to our 8-week-old mice for 2 weeks before the beginning of experiments, we examined the variations in fatty acid composition in circulating eryth-rocytes before and after the experiments (Fig. 2). In erythrocytes, fatty acids are esterified almost only in membrane phospholipids, and their composition faith-fully reflects food intake [31]. Regarding the saturated fatty acids, both the OLE and ARA diets slightly decreased the palmitic acid amounts after 12 weeks, whereas only the OLE diet reduced stearic acid amounts, leading to a 2.13% significant difference between the OLE- and ARA-fed mice after 12 weeks on the diet (Fig. 2a). Regarding monounsaturated fatty acids, the oleic acid amount in-creased from 9.48 ± 0.08% to 11.01 ± 0.16% with the ARA diet, whereas it rose to 17.45 ± 0.24% with the OLE diet (Fig. 2b). The OLE diet also increased the monounsatured palmitoleic acid amount from 0.39 ± 0.02% to 0.58 ± 0.02% (1.5 times), whereas the ARA diet did not significantly modify this fatty acid in erythrocytes compared with the standard diet (Fig. 2b and Table 1). Regarding the ω-6 PUFAs, the ARA diet drastically enhanced the amounts of ARA (from 12.29 ± 0.58% to 22.66 ± 1.32%) and docosate-traenoic acid (DTA) (from 1.83 ± 0.08% to 3.84 ± 0.45%), another ω-6 PUFA (C22:4, ω-6), whereas the OLE diet maintained these fatty acids at the levels found before the experiments (Fig. 2c). By contrast, the amounts of theω-6 precursor, linoleic acid, were lowered by both the ARA and OLE diets in erythrocytes after 12 weeks of the diet, with the influence of the ARA diet being stronger (from 13.71 ± 0.31% to 8.95 ± 0.24% and 4.61 ± 0.13% with the OLE and ARA diets, respectively). Finally, regarding the ω-3 PUFAs, the OLE diet increased eicosapentaenoic acid (EPA) and DHA amounts in erythrocytes (from 0.01 ± 0.008% to 0.26 ± 0.03% and from 2.61 ± 0.22% to 3.52 ± 0.31%, respectively), whereas the ARA diet de-creased DHA amounts to 1.25 ± 0.16% (i.e., half the values observed before the experiments) (Fig. 2d). In the main 2 groups of 39 mice fed the OLE and ARA diets, 2 subgroups of mice were given icv injections
of 500 pmol Aβ42 oligomers or vehicle (n = 20 and
19, respectively) at the end of the 10th diet week, as pre-viously described [15]. No difference was observed at the end of the 12 weeks of the diet between the two sub-groups of mice given icv injections of NaCl or Aβ oligo-mers in each diet group for the erythrocyte fatty acid composition (see Additional file 3).
We also investigated the differences in fatty acid com-position in the liver, another type of peripheral tissue, in both mice groups (Table 2). In the liver, esterified fatty acids are distributed mainly in triglycerides and choles-terol esters, and only a minor part is found in membrane phospholipids. Liver amounts of stearic acid were higher (1.2 times), whereas palmitic acid amounts were lower (0.93 times) in ARA-fed mice than in OLE-fed mice, which are similar to the differences observed in erythro-cytes after 12 weeks of the diet, except that the variations of palmitic acid were not significantly different between the two diets in erythrocytes. Oleic acid amounts were 1.6-fold higher in the livers of OLE-fed mice than in those of ARA-fed mice (Table 2), as in erythrocytes after 12 weeks of the diet (Fig. 2b). Palmitoleic acid, the other monounsaturated fatty acid, was decreased by the ARA diet compared with the OLE diet in liver in the same pro-portions as in erythrocytes (0.75 times). Regarding ω-6 PUFAs, linoleic acid was only weakly reduced by 15% in the livers of mice fed the ARA diet compared with those fed the OLE diet, which contrasts with the 50% reduction observed in erythrocytes. Liver ARA amounts were en-hanced by 1.7 times with the ARA diet compared with the OLE diet, similar to the erythrocyte profiles. By contrast, the increase in DTA amounts with the ARA diet was higher in the liver than in erythrocytes (4.1 instead of 2.5 times) (Table 2 and Fig. 2c). In parallel to the increase of the ω-6 PUFAs, ω-3 PUFA amounts were decreased by the ARA diet compared with the OLE diet in the liver (0.12 and 0.6 times for EPA and DHA, respectively) (Table 2), although the DHA reduction was lower in the liver than in erythrocytes (0.36 times) (Fig. 2d). As in erythrocytes, no difference was observed at the end of the 12 weeks of the diet between the mice given icv injections with NaCl and those given icv injections with Aβ oligo-mers in each diet group for the liver fatty acid compos-ition (see Addcompos-itional file 4).
Modifications of fatty acid composition of brain hippocampus and cortex by dietary ARA
The results reported above show that the ARA and OLE diets lead to large differences in fatty composition in erythrocytes and the liver. Therefore, we investigated whether the fatty acid composition of brain structures, hippocampus, and cortex were affected in the same way by these diets. Compared with the variations observed in erythrocytes and the liver, differences in brain fatty acid
composition had more limited amplitudes and were restricted to the OLE diet, the ω-6 fatty acids (linoleic ARA and DTA), andω-3 PUFA DHA. The ARA diet re-duced by 0.95 and 0.92 times the OLE amounts in the cortex and hippocampus, respectively, compared with the OLE diet (Table 3). The amounts of the ω-6 PUFAs ARA, and DTA were higher in the hippocampus (1.12 times for ARA and 1.22 times for DTA) and the cortex (1.1 times for ARA and 1.26–1.29 times for DTA) of
mice fed the ARA diet compared with mice fed the OLE diet. The ARA diet also induced a reduction of DHA (0.91 times) in the cortex. DHA amounts trended lower in the hippocampus of ARA-fed mice (0.95 times), but the difference did not reach a statistically significant level. Because brain fatty acid profiles could be changed by the icv Aβ42oligomer injections, we separately
exam-ined the four mouse subgroups (OLE-fed mice given sa-line solution or Aβ42 oligomer injections and ARA-fed
OLE diet
ARA diet
0 4 8 12 16 20 1 2 0 week 12 weeks
Monounsaturated Fatty Acids
Palmitoleic acid (16:1) Oleic acid (18:1)
***
}###***
***
15 20 25 30 35 40 45 1 2 0 week 12 weeks Palmitic acid (16:0) Stearic acid (18:0) # % Fatty A s di cSaturated Fatty Acids
a
-5 0 5 10 15 20 25 1 2 0 week 12 weeks Linoleic acid (18:2) Arachidonic acid (20:4) Docosa-tetraenoic acid (22:4)***
###***
***
***
### ###Polyunsaturated -6 Fatty Acids
% F a tt y A s di c -1 0 1 2 3 4 1 2 Docosahexaenoic acid (22:6) Eicosapentaenoic acid (20:5) Linolenic acid (18:3) 0 week 12 weeks
Polyunsaturated -3 Fatty Acids
***
###***
###
b
c
d
Fig. 2 Modifications of erythrocyte fatty acid composition by oleic acid-enriched (OLE) and arachidonic acid-enriched (ARA) diets. Mice were fed a standard diet for 2 weeks before the experiments. Blood samples were collected, and then two groups were fed the OLE or ARA diet for 12 weeks. Second blood samples were collected at the end of the 12th week. Fatty acid composition was measured by gas chromatography to evaluate the evolution of the fatty acid profiles between the beginning and the end of the experiments in the OLE- or ARA-fed mice. Saturated fatty acids (a), monounsaturated fatty acids (b), polyunsaturatedω-6 fatty acids (c), and polyunsaturated ω-3 fatty acids (d) were measured. * p < 0.05, ** p < 0.01, *** p < 0.001, comparison of measures at weeks 0 and 12 in a diet group (OLE or ARA).#p < 0.05,##p < 0.01,###p < 0.001,
mice given saline solution or Aβ42oligomer injections).
No difference was observed between mice given icv NaCl and Aβ42 oligomer injections in each diet group
(see Additional file 5).
Dietary ARA affects cognitive abilities of wild-type BALB/c mice and enhances their alteration by Aβ42oligomers
Because we found evidence of slight variations in fatty acid composition of the hippocampus and cortex of mice fed the ARA diet compared with those fed the OLE diet, we examined whether these differences could be associated
with modifications of the basal cognitive abilities and their responses to Aβ42oligomers. As described in the Methods
section above, the cognitive performance of the four sub-groups of mice was monitored using the Y-maze test, reflecting the immediate spatial working memory per-formance, and the Morris water maze test, reflecting learning and long-term memory capacities.
In the Y-maze test, OLE-fed mice injected with the vehicle (n = 10) displayed 70.7 ± 2.6% alternation rates, which dropped to 55.2 ± 3.4% when mice were injected with Aβ42oligomers (n = 9) (Fig. 3a). Because the
num-ber of arm entries did not change significantly between the two subgroups (Fig. 3b), the reduction of alternation rates after injection with Aβ42 oligomers (mean
reduc-tion 15.5%) was not due to exploratory, locomotor, vis-ual, or motivational effects and indicates an impairment of spatial working memory, as previously reported for BALB/c mice fed a standard diet [15]. ARA-fed mice injected with vehicle (n = 14) displayed alternation rates similar to those of OLE-fed mice injected with Aβ42
olig-omers (53.2 ± 2.8%) (Fig. 3a). Injection with Aβ42
oligo-mers (n = 15) did not significantly modify the alternation behavior (49.9 ± 2.1%). Because the number of entries in the ARA subgroups was similar to that in the OLE sub-groups, spatial working memory was altered by dietary ARA, and Aβ42oligomers did not amplify this alteration.
In the Morris water maze, OLE- and ARA-fed mice injected with vehicle exhibited the same learning abilities (Fig. 3c). As previously described for standard diet-fed BALB/c mice [15], injection of Aβ42 oligomers did not
suppress but reduced the learning abilities of the OLE-fed mice (2–9 seconds longer escape latencies across the 5 training days with significant variations for days 2–4)
Table 2 Liver fatty acid composition in mice fed oleic acid-enriched or arachidonic acid-enriched diet (%)
OLE ARA Palmitic acid (16:0) 26.49 ± 0.56 24.55 ± 0.36a Stearic acid (18:0) 13.48 ± 0.39 16.73 ± 0.74b Palmitoleic acid (16:1) 1.25 ± 0.08 0.94 ± 0.06a Oleic acid (18:1) 16.08 ± 1.53 10.09 ± 0.56b Linoleic acid (18:2ω-6) 15.38 ± 0,87 12.86 ± 0.81c Arachidonic acid (20:4ω-6) 15.97 ± 0.61 27.46 ± 0.77b Docosatetraenoic acid (22:4ω-6) 0.47 ± 0.01 1.93 ± 0.16b α-Linolenic acid (18:3 ω-3) 0.41 ± 0.04 0.52 ± 0.05 Eicosapentaenoic acid (20:5ω-3) 0.48 ± 0.06 0.06 ± 0.01b Docosahexaenoic acid (22:6ω-3) 10.00 ± 0.27 6.10 ± 0.26b Sum ofω-6 PUFA 31.8 42.25 Sum ofω-3 PUFA 10.89 6.69
ARA Arachidonic acid-enriched diet, OLE Oleic acid-enriched diet, PUFA Polyunsaturated fatty acid
a
p < 0.01, ARA compared with OLE. n = 10 in each diet group (OLE or ARA)
b
p < 0.001, ARA compared with OLE. n = 10 in each diet group (OLE or ARA)
cp < 0.05, ARA compared with OLE. n = 10 in each diet group (OLE or ARA)
Table 3 Cortex and hippocampus fatty acid composition (%) in mice fed oleic acid-enriched or arachidonic acid-enriched diet
Cortex Hippocampus
OLE ARA OLE ARA
Palmitic acid (16:0) 26.92 ± 0.07 27.04 ± 0.11 25.23 ± 0.14 24.76 ± 0.23 Stearic acid (18:0) 24.93 ± 0.19 25.17 ± 0.09 26.03 ± 0.18 25.72 ± 0.37 Palmitoleic acid (16:1) 0.40 ± 0.00 0.39 ± 0.01 0.43 ± 0.01 0.41 ± 0.00 Oleic acid (18:1) 12.13 ± 0.06 11.52 ± 0.06a 12.68 ± 0.16 11.61 ± 0.13a Linoleic acid (18:2ω-6) 0.61 ± 0.01 0.38 ± 0.02b 0.61 ± 0.02 0.34 ± 0.02a Arachidonic acid (20:4ω-6) 11.50 ± 0.03 12.69 ± 0.05b 13.08 ± 0.15 14.65 ± 0.23a Docosatetraenoic acid (22:4ω-6) 3.71 ± 0.02 4.75 ± 0.04b 4.76 ± 0.15 5.82 ± 0.09b
Linolenic acid (18:3ω-3) LOQ LOQ 0.05 ± 0.05 0.02 ± 0.02
Eicosapentaenoic acid (20:5ω-3) LOQ LOQ LOQ LOQ
Docosahexaenoic acid (22:6ω-3) 19.81 ± 0.06 18.04 ± 0.10b 17.14 ± 0.26 16.68 ± 0.38
Sum ofω-6 PUFA 15.82 17.82 18.44 20.81
Sum ofω-3 PUFA 19.81 18.07 17.19 16.69
Abbreviations: ARA Arachidonic acid-enriched diet, OLE Oleic acid-enriched diet, LOQ Limit of quantitation PUFA Polyunsaturated fatty acid
ap < 0.05, ARA compared with OLE. n = 8 in OLE diet group, n = 12 in ARA diet group b
(Fig. 3c). In contrast, injection of the Aβ42 oligomers
into ARA-fed mice almost completely suppressed their learning abilities (8–14.5 seconds longer escape latencies and significant variations for days 1–5 compared with ARA + NaCl subgroup and for days 4–5 compared with OLE + Aβ subgroup) (Fig. 3c). In the probe test, OLE-fed mice spent less time in the target quadrant and more time in the opposite one when they were given injections of Aβ42 oligomers (22% instead of 32.9% and 32%
in-stead of 22.4%, respectively) (Fig. 3d, e). ARA-fed mice trended toward spending less time in the target quadrant (26.7% instead of 32.9% with vehicle and 17.9% instead
of 22% with Aβ42 oligomers) and more time in the
opposite one (25.9% instead of 22.4% with vehicle and 32.9% instead of 32% with Aβ42 oligomers) than those
that received the OLE diet, regardless of whether they were given injections with vehicle or Aβ42 oligomers.
However, these differences were not statistically signifi-cant (Fig. 3d, e).
Dietary ARA reduces expression levels of AMPA receptors in absence or presence of Aβ42oligomers
Recently, many studies have established that Aβ42
oligo-mers induced synaptic dysfunction assumed to cause the
0 20 40 60 80 Alternation(%) NaCl A42 NaCl A 42
OLE diet ARA diet
** ***
a
0 10 20 30 Number of entries NaCl A 42 NaCl A 42OLE diet ARA diet
b
15 20 25 30 35 40 45 1 2 3 4 5 Esc ape la tency (s) Days * ## ## ## ## # * * $ $$OLE diet NaCl ARA diet NaCl OLE diet A 42 ARA diet A 42
c
0 10 20 30 40 Time in opposit e quadr ant (%)e
* * NaCl A 42 NaCl A 42OLE diet ARA diet
0 10 20 30 40
Time in platform quadrant (%)
d
* *
NaCl A 42 NaCl A 42
OLE diet ARA diet
Fig. 3 Increased susceptibility of the mice to amyloid-β peptide (Aβ)-induced learning and short-term memory impairment by arachidonic acid-enriched (ARA) diet. Mice were given intracerebroventricular injections of 0.9% NaCl or soluble Aβ42oligomers as described in the Methods section of the main
text after 10 weeks of the ARA or oleic acid-enriched (OLE) diet. Y-maze tests were performed 4 days after the injection, and a spontaneous alternation behavior and b number of arm entries were measured during a 5-minute session. The training trials with the Morris water maze were performed from 7 to 11 days after the injection. Escape latency was measured (mean of a group of four trials per day) in the training week (c). Results of the probe trial (14 days after the injection) are shown as percentages of time spent in the platform quadrant (d) and in the opposite quadrant (e). * p < 0.05, ** p < 0.01, *** p < 0.001, comparing the four groups of mice for Y-maze test and probe test; * p < 0.05, comparing OLE NaCl and OLE Aβ42groups; #
p < 0.05, ##p < 0.01, comparing ARA NaCl and ARA Aβ42groups; $
p < 0.05, $$p < 0.01, comparing OLE Aβ42and ARA Aβ42groups for
first memory alterations observed in the early steps of AD [18, 22]. So, we sought to determine if the dietary ARA-induced alterations of spatial working memory and learning abilities could be related to damage of proteins involved in synaptic function. Because AMPA receptors underlie the establishment of LTP and constitute well-known targets of Aβ42oligomers [32, 33], we investigated
the effects of dietary ARA on the hippocampal or cortical protein levels of the four members of this family of recep-tors (GluR1–GluR4) after icv injection of Aβ42oligomers
or vehicle.
We first evaluated the expression levels of the AMPA receptors in Western blotting experiments. We found that GluR2 protein levels were reduced by about two-fold by the ARA diet in cortical homogenates, whereas injections of Aβ42 oligomers did not further reduce the
expression of this AMPA receptor member (Additional file 6). We observed drastic reductions (to 12–20% of the levels observed in the control OLE group after NaCl injections) of the expression levels of the four types of AMPA receptors in the hippocampus homogenates of ARA-fed mice after Aβ42oligomer injections (Additional
file 7). The intensities of the Western blot bands corre-sponding to the various AMPA receptor isoforms ap-peared as almost wiped out in these homogenates, although such variations could not be strictly correlated to those of the expression levels, owing to lack of linear-ity of the antibody-antigen response in the Western blot experiments in some ranges of expression.
To determine if these observations could be due to ac-tual variations of the expression levels of AMPA recep-tors or alternative technical reasons linked to Western blotting technology, we performed new measurements by using specific ELISA kits for the four AMPA receptor types because ELISA methods allow more quantitative evaluation than the semi-quantitative Western blotting experiments. In cortical homogenates, we found that in-jections of Aβ42 oligomers decreased GluR1 expression
levels from 489 ± 106 pg/μg and 258 ± 37 pg/μg total proteins (after NaCl icv injections) to 90 ± 14 pg/μg and 132 ± 21 pg/μg total proteins in the OLE- and ARA-fed mouse groups, respectively (Fig. 4a). The ARA diet reduced GluR2 expression levels in cortical homogenates from 222 ± 22 pg/μg and 176 ± 26 pg/μg total proteins in the OLE-fed mice (after NaCl and Aβ42oligomer
injec-tions, respectively) to 128 ± 12 pg/μg and 143 ± 19 pg/μg total proteins in the ARA -fed mice (after NaCl and Aβ42 oligomer injections, respectively) (Fig. 4b). No
difference could be detected for GluR2 in the cortical ho-mogenates between the mice that received NaCl and Aβ42
oligomer icv injections, regardless of the diet used (Fig. 4b). GluR3 and GluR4 expression displayed similar levels in the cortical homogenates from the four mouse subgroups (Fig. 4c and d). In hippocampus homogenates, we could
observe that the ARA diet decreased GluR3 expression levels compared with the OLE-fed mice after NaCl icv injection (Fig. 4 g). By contrast, we did not notice any vari-ation of the expression levels of the other AMPA recep-tors in hippocampus homogenates of the four mouse subgroups, even if there was a trend toward reduction of the GluR1 expression levels in the ARA-fed mice and in the OLE-fed mice after Aβ42oligomer icv injections
com-pared with the control OLE-fed and NaCl icv-injected mouse group (Fig. 1e).
Dietary ARA reduces expression levels of postsynaptic density protein receptor in cortex
AMPA receptors frequently interact with PSD95 protein complex in synapses to play their role in neurotransmis-sion [34]. Therefore, we examined the effects of two diets on PSD95 protein expression and their modulation by Aβ42 oligomers. We observed that injections with
Aβ42oligomers induced a mean 20% reduction of PSD95
expression levels in the synaptosomes prepared from the cortex of OLE-fed mice, but this reduction did not reach a statistically significant level (Fig. 5a). In contrast, a sig-nificant mean 30% reduction of PSD95 expression level was noted in the cortex of ARA-fed mice given a vehicle injection. Injection with Aβ42oligomers did not further
reduce PSD95 expression levels in these mice (Fig. 5a). In the hippocampal synaptosome preparations, roughly similar effects were seen, but with lower mean decreases of 10% and nonsignificant amplitudes (Fig. 5b). No modifi-cation in the expression levels of the SNAP25 presynaptic marker was evidenced in the various mouse subgroups (see Additional file 8).
To further characterize the mechanism of the influence of dietary ARA on cognitive abilities and underlying syn-apse function, we first investigated the presence of chronic neuroinflammation that could impair synaptic function and then the change in the balance between cPLA2 and
neuronal ACSL4, which respectively release ARA from membrane phospholipids and allow its reincorporation into these phospholipids.
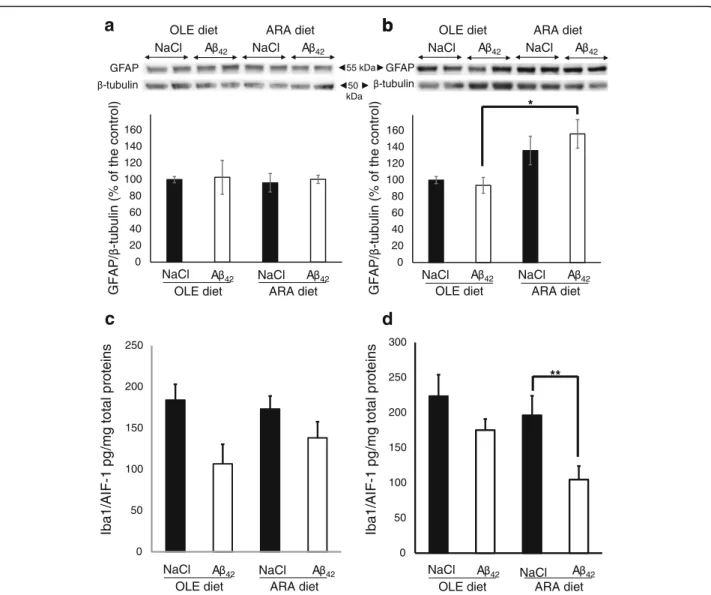
Dietary ARA induces astrocyte proliferation in hippocampus
We measured the expression levels of GFAP as a marker of glial proliferation (Fig. a, b). No difference in GFAP levels could be detected in the cortices of the various mouse subgroups, regardless of the diet or the injected solution used (Fig. 6a). In the hippocampus of OLE-fed mice, injection with Aβ42oligomers did not increase the
GFAP level. But GFAP expression increased by 1.6-fold in ARA-fed mice after injection with Aβ42 oligomers
(Fig. 6b). After injection with the vehicle, higher GFAP expression levels were also observed, but the mean increase did not reach statistically significant levels.
Next, we examined whether dietary ARA and/or Aβ42
oligomer injections induced microglial activation by using the conventional Iba1/AIF-1 marker. We did not find any increase of the Iba1/AIF-1 expression level in the cortex or hippocampus, regardless of the diet and type of icv injection (Fig. 6c and d). Surprisingly, we ob-served a reduction of Iba1/AIF-1 expression levels after
Aβ42 injection in the hippocampus of ARA-fed mice
(Fig. 6d). A trend toward reduction of expression levels of Iba1/AIF-1 was also noted in the cortex and hippo-campus of the other groups after Aβ42injection, but the
level of statistical significance was not reached (Fig. 6c and d). We also used another microglial marker, the TREM-2 triggering receptor, in which upregulation has
GluR1 GluR2 GluR3 0 100 200 300 400 500 600 700 GluR1 (pg/µg proteins ) 0 100 200 300 400 500 600 700 GluR1 (pg/µ g proteins ) 0 50 100 150 200 250 300 GluR2 (ng/µg proteins ) 0 100 200 300 400 500 GluR2 (ng/µg proteins ) 0 100 200 300 400 500 GluR3 (pg/µg proteins ) 0 100 200 300 400 500 GluR3 (pg /µg proteins ) 0 50 100 150 200 250 GluR4 (pg/µg proteins ) 0 50 100 150 200 250 GluR4 (pg/µg proteins ) GluR4 CORTEX HIPPOCAMPUS NaCl A 42 NaCl A 42 OLE diet ARA diet
NaCl A 42 NaCl A 42 OLE diet ARA diet
a
b
c
d
e
f
g
h
* * * ** * * *Fig. 4 Modification ofα-amino-3-hydroxy-5-methyl-4-isoxazolepropionic acid (AMPA) receptors in cortex and hippocampus homogenates induced by arachidonic acid-enriched (ARA) diet and intracerebroventricular injections of amyloid-β peptide 42 oligomers. Immediately after the probe test, mice were killed, and homogenates were prepared from cortex and hippocampus. The expression levels of the four murine members of the AMPA receptor family were measured in cortex (a–d) and hippocampus e–h homogenates by using specific enzyme-linked immunosorbent assay (ELISA) kits from Aviva Systems Biology Corporation for glutamate receptor 1 (GluR1) (a and e) and GluR2 (b and f) and from Cloud-Clone Corporation for GluR3 (c and g) and GluR4 (d and h). Data are expressed as picograms of the specific AMPA receptor family member per microgram of total protein in the brain homogenates (* p < 0.05 and ** p < 0.01, comparing the four groups of mice). Results are shown as mean ± SEM of ELISA measurements performed for all animals of the group (oleic acid-enriched diet [OLE] groups, n = 4; ARA groups, n = 6). Measurements were performed in duplicate for each brain tissue sample
been observed in AD model mice [35, 36], but we could not find any variation of its expression level in the hippocampus or cortex of our various mice groups (see Additional file 9).
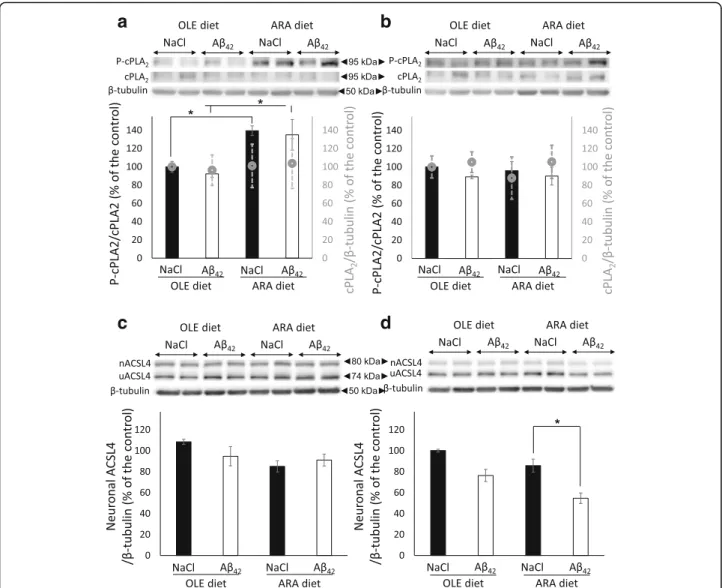
Dietary ARA modulates cPLA2activation and neuronal form of ACSL4
Overexpression or overactivation of the ARA-releasing cPLA2should be associated with increased cell-free ARA
levels in the absence of counteracting mechanisms. Free ARA can be reincorporated into membrane phospholipids by the ARA-specific ACSL4, which is expressed as two neuron-specific and ubiquitous isoforms in the brain, as reported above [17]. Therefore, we examined the influence of the two diets and Aβ42 oligomer injections on these
two ARA-mobilizing enzymes. We first measured cPLA2
protein expression and phosphorylation levels on Ser505, which is critical for its activation. We did not observe any modification of cPLA2expression levels in the
hippocam-pus or cortex by dietary ARA or Aβ42oligomers (Fig. 7a
and b). In contrast, dietary ARA increased Ser505 phos-phorylation level in the cortex but not in the hippocam-pus, and this effect was maintained but not amplified after Aβ42oligomer injection (Fig. 7a, b).
We next measured the protein levels of the neuron-specific and ubiquitous ACSL4 isoforms in the brain structures of the various groups of mice. No variation in the expression levels of the ACSL4 ubiquitous isoform was observed, but Aβ42 oligomer injections reduced by
40% the expression levels of the neuron-specific isoform in the hippocampus of ARA-fed mice (Fig. 7d). This
reduction was not observed in the cortex or in the OLE-fed mice (Fig. 7c and d). Then we analyzed phospholipid species to examine whether the variations in expression levels of the neuronal ACSL4 isoform and cPLA2
modi-fied ARA incorporation into the cortical and hippocam-pal phospholipids.
Modification of phospholipid species profiles by dietary ARA and Aβ42oligomers
Biological effects of ω-6 or ω-3 PUFAs, including on memory, have been associated with the nature of the phospholipids into which they are incorporated as well as their distribution in brain structures [37, 38]. We used liquid chromatography-tandem mass spectrometry (LC-MS/MS) to analyze the phospholipid species putatively affected by ARA diet in the cortex and hippocampus. We focused our analyses on the ARA-, DHA-, DTA-, and doc-osapentaenoic acid (DPA)-containing species in the hippocampus and cortex of our four subgroups of mice. Our aims were to determine whether dietary ARA in-take could modify the equilibrium between ARA- and DHA-containing species in the various glyceropho-spholipid classes and whether these modifications influ-ence the effects of Aβ42 oligomers on specific species
and potentially increase the release of ARA. We in-cluded the DTA- and DPA-containing species because dietary ARA can be elongated and desaturated into the ω-6 PUFAs DTA and DPA. We measured the areas of ARA-, DTA-, DPA-, and DHA-containing species in each phospholipid class, and we expressed each species as a percentage of the sum of these various areas in
0 20 40 60 80 100 0 20 40 60 80 100 PSD955/ β -tubulin (% of the c o ntr o l) the c o ntr o l)
b
NaCl A 42 NaCl A 42OLE diet ARA diet
a
A 42 NaCl A 42
NaCl
OLE diet ARA diet
NaCl A 42 NaCl A 42
OLE diet ARA diet
b
A 42 NaCl A 42
NaCl
OLE diet ARA diet
*
-tubulin β-tubulin
PSD95 95kDa PSD95
50 kDa
Fig. 5 Modification of hippocampal and cortical synaptic postsynaptic density protein 95 (PSD95) induced by arachidonic acid-enriched (ARA) diet. Immediately after the probe test, mice were killed, and synaptosomes were prepared from the cortex and hippocampus. Representative immunoblots of cortical (a) and hippocampal (b) PSD95 from oleic acid-enriched (OLE) or ARA diet mice after NaCl or amyloid-β peptide (Aβ42) injections are shown. Densitometric analyses were performed to determine signal intensities normalized toβ-tubulin, and data are
expressed as percentages of control OLE mice given injections with NaCl (* p < 0.05, comparing the four groups of mice). Results are shown as mean ± SEM of immunoblots performed for all animals (OLE groups, n = 4; ARA groups, n = 6)
each class: phosphatidylcholine (PC), phosphatidyletha-nolamine (PE), phosphatidylinositol (PI), and phosphati-dylserine (PS). To avoid confusion due to isobaric species, we performed MS2 analyses for PI, PE, PS, and MS3 for PC. The data derived from the LC-MS/MS analyses are presented in Table 4.
Several differences were observed between ARA- and OLE-fed mice in some PS and PE species and in only one PI species in the cortex. As previously reported [39, 40], ARA-containing species predominate in PI in the cortex as well as in the hippocampus, representing 96–99% of the ARA- and DHA-containing species. The minor PI
species 16:0/22:6 was reduced by 83% in the cortex (from 1.07 ± 0.16% to 0.18 ± 0.04%) by the ARA diet compared with the OLE diet. The icv injections of Aβ42 oligomers
collapsed this species to 17% of its initial level in OLE-fed mice (i.e., the same level as in NaCl- or Aβ42
oligomer-injected mice fed the ARA diet) (Table 4). The icv injec-tions of Aβ42 oligomers also shifted the distribution of
ARA from the two minor ARA-containing PI species, 16:0/20:4 and 18:1/20:4, to the major one, 18:0/20:4, in the cortex without any difference between OLE- and ARA-fed mice. The most numerous differences in cortical phospho-lipids between the OLE- and ARA-fed mice were observed
0 50 100 150 200 250 NaCl A 42 NaCl A 42
OLE diet ARA diet
0 50 100 150 200 250 300 Iba1/ AIF-1 pg /mg t ot al pr ot eins Iba1/ AIF-1 pg /mg t ot al pr ot eins NaCl A 42 NaCl A 42
OLE diet ARA diet
** 0 20 40 60 80 100 120 140 160 0 20 40 60 80 100 120 140 160
b
*b
a
A 42 NaCl A 42 NaClOLE diet ARA diet
b
A42 NaCl A42
NaCl
OLE diet ARA diet
NaCl A 42 NaCl A 42
OLE diet ARA diet
NaCl A 42 NaCl A42
OLE diet ARA diet
-tubulin -tubulin
GFAP GFAP
c
d
GFAP/
β
-tubulin (% of the control)
GFAP/
β
-tubulin (% of the control)
◄55 kDa► ◄50 ►
kDa
Fig. 6 Modifications of brain glial fibrillary acidic protein (GFAP) and Iba1/AIF-1 proteins induced by arachidonic acid-enriched (ARA) diet and amyloid-β peptide 42 (Aβ42). Immediately after the probe test, mice were killed, and homogenates were prepared from the cortex
and hippocampus. Representative immunoblots of cortical (a) and hippocampal (b) GFAP astroglial protein from oleic acid-enriched (OLE) or ARA diet mice after NaCl or Aβ42injections are shown. Densitometric analyses were performed to determine signal intensities normalized toβ-tubulin,
and data are expressed as percentages of control OLE mice injected with NaCl (* p < 0.05 and ** p <0.01, comparing the four groups of mice). Results are shown as mean ± SEM of immunoblots performed for all animals (OLE groups, n = 4; ARA groups, n = 6). Expression levels of the Iba1/AIF-1 microglial marker was determined by enzyme-linked immunosorbent assay (ELISA), and the relative amounts of Iba1/AIF-1 per microgram of total protein are shown in the cortex (c) and hippocampus (d) of the OLE- and ARA-fed mice after intracerebroventricular NaCl or Aβ42injections. Results are shown as
in the PS class. The ARA diet increased theω-6 18:0/20:4 and 18:0/22:4 PS species of mice given icv NaCl injections by 3.5 and 1.4, respectively, whereas it reduced by 12% the ω-6 18:0/22:6 species (Table 4). Interestingly, the injection of Aβ42 oligomer reduced the 18:0/20:4 species in
ARA-fed mice to the same levels as in OLE- and ARA-ARA-fed mice, suggesting that the release of ARA was higher in ARA-fed mice in the presence of Aβ42oligomers than in OLE-fed
mice, because their initial ARA amounts were higher. By contrast, the DTA-containing species 18:0/22:4 was not affected by icv injections of Aβ42 oligomers, and the
relative levels of the DHA-containing 18:0/22:6 species were increased (Table 4). In cortical PE species, only the acyl a16:0/22:6 and plasmalogen p16:0/22:6 species showed a significant decrease in ARA-fed mice compared with the OLE-fed mice, whereas the minor a18:1/22:4 spe-cies was slightly increased and the various ARA spespe-cies did not differ between the two groups of mice. Aβ42
oligo-mer icv injections reduced several ARA- and DTA-containing species. In addition, they also decreased the levels of several DHA-containing species, but they in-creased by 6.5- to 7.5-fold the a18:1/22:6 species. No clear
a
b
c
d
Fig. 7 Modifications of brain cytosolic phospholipase A2(cPLA2) and neuron-specific acyl-coenzyme A synthetase 4 (nACSL4) proteins induced by
arachidonic acid-enriched (ARA) diet and amyloid-β peptide 42 (Aβ42). Immediately after the probe test, mice were killed, and homogenates were
prepared from the cortex and hippocampus. Representative immunoblots of cortical (a and c) and hippocampal (b and d) phosphorylated cytosolic phospholipase A2(P-cPLA2) and cPLA2(a and b) and nACSL4 (c and d) proteins from oleic acid-enriched (OLE) or ARA diet mice
after NaCl or Aβ42injections are shown. Densitometric analyses were performed to determine signal intensities normalized toβ-tubulin
for cPLA2and nACSL4 and normalized to cPLA2for P-cPLA2, and data are expressed as percentages of control OLE mice injected with NaCl (* p < 0.05,
comparing the four groups of mice). In (a) and (b), P-cPLA2/cPLA2density is shown by the black and white scales (y-axis on the left), and
cPLA2/β-tubulin is shown by the gray circles (y-axis on the right). Results are shown as mean ± SEM of immunoblots performed for all
Table 4 Brain phospholipids (percentage of measured phospholipids for each class) among male mice fed oleic acid-enriched or arachidonic acid-enriched diet
Brain structures Cortex Hippocampus
Injections NaCl Aβ42 NaCl Aβ42
Diets OLE ARA OLE ARA OLE ARA OLE ARA
Phosphatidylinositol 16:0/20:4 13.10 ± 1.83 13.69 ± 0.33 7.80 ± 0.49a 8.28 ± 0.17a 10.90 ± 0.49 10.49 ± 0.66 8.08 ± 2.24 7.04 ± 0.21 18:0/20:4 74.30 ± 1.74 76.34 ± 1.37 87.32 ± 1.53b 87.22 ± 0.44b 78.38 ± 0.56 78.17 ± 0.93 83.32 ± 3.22 83.49 ± 0.54 18:1/20:4 9.27 ± 0.23 7.81 ± 0.97 2.95 ± 1.09b 3.06 ± 0.30a 9.16 ± 0.32 9.77 ± 0.52 7.61 ± 0.83 7.61 ± 0.42 16:0/22:6 1.07 ± 0.16 0.18 ± 0.04c 0.18 ± 0.01d 0.22 ± 0.03 0.58 ± 0.02 0.53 ± 0.04 0.48 ± 0.05 0.64 ± 0.01 18:0/22:6 2.26 ± 0.40 1.98 ± 0.25 1.75 ± 0.08 1.22 ± 0.06 0.99 ± 0.09 1.04 ± 0.18 0.51 ± 0.13 1.22 ± 0.74 Arachidonic acid species 96.67 ± 0.57 97.84 ± 0.21 98.07 ± 0.07 98.56 ± 0.06 98.43 ± 0.08 98.42 ± 0.17 99.01 ± 0.17 98.14 ± 0.75 Docosahexaenoic acid species 3.33 ± 0.57 2.16 ± 0.21 1.93 ± 0.07 1.44 ± 0.06 1.57 ± 0.08 1.58 ± 0.17 0.99 ± 0.17 1.86 ± 0.75 Phosphatidylcholine 16:0/20:4 45.18 ± 4.90 49.97 ± 2.51 45.35 ± 1.57 53.01 ± 2.76 26.94 ± 1.44 28.66 ± 1.42 68.63 ± 1.96b 63.14 ± 9.83a 18:0/20:4 16.75 ± 3.75 15.2 ± 2.63 27.70 ± 2.36 26,79 ± 1.59 35.68 ± 0.24 37.78 ± 1.18 16.35 ± 2.13a 15.05 ± 6.23b 18:1/20:4 2.92 ± 0.76 3.38 ± 0.65 5.55 ± 0.95 3.69 ± 0.22 10.29 ± 0.61 10.23 ± 0.71 2.62 ± 0.28d 4.83 ± 0.94b 18:0/22:6 16.29 ± 1.27 16.30 ± 1.56 1.02 ± 0.07d 2.45 ± 0.50d 9.05 ± 0.83 7.16 ± 0.57 5.19 ± 0.83 6.81 ± 1.35 18:1/22:6 8.22 ± 1.40 6.80 ± 0.86 0.91 ± 0.15b 1.40 ± 0.22a 3.04 ± 0.36 2.90 ± 0.05 3.84 ± 0.47 3.10 ± 0.07 16:0/22:6 10.64 ± 3.33 8.43 ± 1.81 19.47 ± 0.25 12.65 ± 1.95 15.00 ± 1.33 13.27 ± 0.37 3.37 ± 1.33d 7.07 ± 1.37a Arachidonic acid species 64.85 ± 0.80 68.46 ± 1.04 78.60 ± 0.15d 83.49 ± 1.45d 72.91 ± 2.09 76.67 ± 0.97 87.61 ± 0.14b 83.02 ± 2.66 Docosahexaenoic acid species 35.15 ± 0.80 31.54 ± 1.04 21.40 ± 0.15d 16.51 ± 1.45d,e 27.09 ± 2.09 23.33 ± 0.97 12,39 ± 0.14b 16.98 ± 2.66 Phosphatidylserine 18:0/20:4 3.18 ± 0.26 11.16 ± 0.35c 1.47 ± 0.08b 1,92 ± 0.07d 6.17 ± 0.23 7.12 ± 0.40 3.70 ± 0.16b 5.36 ± 0.37a,e 16:0/22:4 0.13 ± 0.02 0.17 ± 0.01 0.21 ± 0.01 0.22 ± 0.03 0.21 ± 0.02 0.26 ± 0.03 0.077 ± 0.010b 0.093 ± 0.009b 18:0/22:4 6.35 ± 0.26 9.11 ± 0.18c 5.41 ± 0.14 9.10 ± 0.35c 7.73 ± 0.36 10.57 ± 0.03 6.31 ± 0.32 10.75 ± 1.35e 18:1/22:5 0.43 ± 0.07 0.46 ± 0.01 0.38 ± 0.08 0,45 ± 0.02 0.41 ± 0.02 0.48 ± 0.06 0,41 ± 0.04 0.44 ± 0.01 18:0/22:6 89.91 ± 0.40 79.10 ± 0.53c 92.53 ± 0.19a 88.32 ± 0.40c,d 85.49 ± 0.58 81.57 ± 0.43 89.50 ± 0.46 83.35 ± 1.69e Phosphatidylethanolamine a16:0/20:4 3.23 ± 0.04 4.04 ± 0.07 1.70 ± 0.24b 2.80 ± 0.16b,e 3.51 ± 0.09 4.17 ± 0.15 2.74 ± 0.13 4,54 ± 0.99 p16:0/20:4 3.58 ± 0.19 4.02 ± 0.04 1.06 ± 0.01d 2.39 ± 0.14c,d 2.41 ± 0.28 2.39 ± 0.16 1.59 ± 0.08 2,67 ± 0.51 a18:0/20:4 18.29 ± 1.66 16.97 ± 0.26 18.03 ± 0.16 19.38 ± 0.44 20.52 ± 0.36 21.31 ± 0.96 22.66 ± 0.65 13.57 ± 5.29 p18:0/20:4 4.70 ± 0.19 5.78 ± 0.24 5.12 ± 0.24 6.43 ± 0.09e 4.45 ± 0.31 5.02 ± 0.30 4.93 ± 0.19 8.68 ± 1.91 a18:1/20:4 2.22 ± 0.11 2.38 ± 0.06 0.41 ± 0.09d 0.84 ± 0.08d,e 2.47 ± 0.06 2.84 ± 0.03 1.18 ± 0.07b 1.17 ± 0.36b p18:1/20:4 2.79 ± 0.18 3.20 ± 0.08 1.21 ± 0.23b 2.13 ± 0.10b,e 2.50 ± 0.17 2.87 ± 0.21 4.22 ± 0.95 a18:2/20:4 0.03 ± 0.01 0.04 ± 0.005 0.02 ± 0.001 0.02 ± 0.003 0 0 0.025 ± 0.001b 0.014 ± 0.010 p18:2/20:4 0.04 ± 0.004 0.03 ± 0.004 0.02 ± 0.004 0.02 ± 0.002 0.048 ± 0.007 0 0.032 ± 0.004b 0.031 ± 0.008a p16:0/22:4 3.15 ± 0.14 3.76 ± 0.15 2,91 ± 0.24 4,29 ± 0.08f 3.12 ± 0.33 3.71 ± 0.13 3.67 ± 0.05 6.13 ± 1.29 p16:1/22:4 0 0.01 ± 0.00 0.0015 ± 0.0007 0.0029 ± 0.0003b 0 0 0.0033 ± 0.0005 0,006 ± 0.0016a a18:0/22:4 3.97 ± 0.41 4.51 ± 0.24 1.55 ± 0.06d 2.25 ± 0.11b 3.02 ± 0.01 3.78 ± 0.29 1.94 ± 0.11 4.34 ± 0.71e a18:1/22:4 0.21 ± 0.01 0.26 ± 0.01e 0.10 ± 0.01d 0.20 ± 0.002a,c 0.22 ± 0.06 0.28 ± 0.01 0.17 ± 0.01 0,35 ± 0.08e a18:0/22:5 7.13 ± 0.57 7.20 ± 0.09 5.19 ± 0.21a 5.85 ± 0.12 4.47 ± 0.15 5.23 ± 0.10 5.26 ± 0.09 6,67 ± 1.70 a16:0/22:6 7.10 ± 0.14 6.24 ± 0.06f 4.03 ± 0.06d 3.71 ± 0.06d 5.89 ± 0.01 5.49 ± 0.24 3.85 ± 0.05 1.12 ± 0.80b,e p16:0/22:6 6.02 ± 0.15 4.69 ± 0.14f 3.62 ± 0.17d 2.74 ± 0.06d,e 4.90 ± 0.40 5.46 ± 0.09 4.29 ± 0.21 4,90 ± 0.72