HAL Id: hal-02925450
https://hal.uca.fr/hal-02925450
Submitted on 29 Aug 2020
HAL is a multi-disciplinary open access
archive for the deposit and dissemination of
sci-entific research documents, whether they are
pub-lished or not. The documents may come from
teaching and research institutions in France or
abroad, or from public or private research centers.
L’archive ouverte pluridisciplinaire HAL, est
destinée au dépôt et à la diffusion de documents
scientifiques de niveau recherche, publiés ou non,
émanant des établissements d’enseignement et de
recherche français ou étrangers, des laboratoires
publics ou privés.
Simulation of Tactile Sensing Arrays for Physical
Interaction Tasks
Zhanat Kappassov, Juan Antonio Corrales Ramon, Véronique Perdereau
To cite this version:
Zhanat Kappassov, Juan Antonio Corrales Ramon, Véronique Perdereau.
Simulation of
Tac-tile Sensing Arrays for Physical Interaction Tasks.
2020 IEEE/ASME International
Confer-ence on Advanced Intelligent Mechatronics (AIM), Jul 2020, Boston, France.
pp.196-201,
Simulation of Tactile Sensing Arrays for Physical Interaction Tasks
Zhanat Kappassov
,
3, Juan-Antonio Corrales-Ramon
2, and V´eronique Perdereau
1Abstract— Simulated worlds are important enablers and ac-celerators of new algorithms for autonomous robot applications. A framework for tactile servoing in the simulated world is presented. This framework includes a general model of tactile sensing arrays that can simulate the behavior of a real tactile sensing array thanks to an empirical characterization proce-dure. After obtaining the precise sensor model, different tactile servoing schemes can be implemented in the framework by controlling contact features, including points and lines extracted from the simulated contact images. Several experiments have been performed in order to guarantee the correspondence between the simulated results generated by the framework and the real ones executed with different sensors and robots.
I. INTRODUCTION
There is at present a large imbalance between physical world simulators’ reliabilities in applications that do not require handling of a contact and those that involve careful consideration of physical interactions. For example, whereas the simulation environment is sufficient to gather the data for solving the problem of learning adaptation behaviors to faults without contacts [1], real experiments are needed to collect and process raw signals for solving the problem of safe physical interactions [2].
This imbalance is due to limitations of physical world engines in the simulation of a tactile sensing arrays [3], which provide robots with a contact force profiles between their links and the environment. This profile is measured thanks to multiple sensing elements organized in raw-column wise structure within the sensor. With the emergence of the demand for fine and dexterous manipulation, tactile sensing arrays have gained attention not only in real applications but also in simulations [4], since physical world simulators accelerate design and implementation.
Simulation of these tactile sensing arrays involve the problem of their surface deformations that occur due to the applied contact forces. This problem can be addressed by applying the elasticity theory [5], which are computationally costly and inherently ill-posed since the authors use inverse filtering techniques that may not have a unique solution.
This work was partially supported by the Institute of Smart Systems and Artificial Intelligence (ISSAI), Kazakhstan, grant “Variable Stiffness Tactile Sensor for Robot Manipulation and Object Exploration” 110119FD45119 and project CoMManDIA (SOE2/P1/F0638) cofinanced by Interreg Sudoe Programme (European Regional Development Fund).
1Sorbonne Universit´e, CNRS, Institut des Syst`emes Intelligents et de Robotique, ISIR, F-75005 Paris, France vperdereau,kappassov @isir.upmc.com
2Universit´e Clermont Auvergne, CNRS, SIGMA Cler-mont, Institute Pascal, F-63000 Clermont-Ferrand, France
3Robotics Department, Nazarbayev University, Astana, 010000 [email protected]
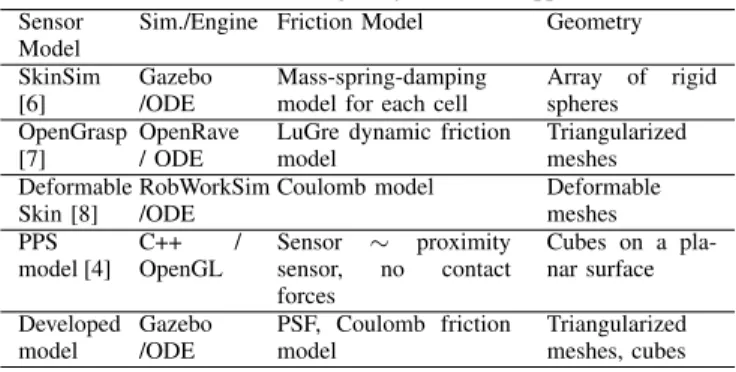
In order to overcome this limitation and simulate realistic tactile sensors, previous approaches propose different solu-tions (Table I). For example, in SkinSim [6] each sensing element within a sensing array is modeled as an independent rigid body with a spherical shape represented in Gazebo simulation environment. Solid elements with a mass are attached to the base of the sensor through a virtual spring. Then the response of the sensor is given by the displacements of the virtual springs.
In contrast to SkinSim, the simulation model of the OpenGrasp skin [7] includes one rigid body only. The body is represented by a triangularization of its surface. A force response at each triangle is then used to form a sensor response. Following the single body representation, in the RobWorkSim simulator with Open Dynamics Engine (ODE), Joergensen et al [8] empirically derive a polynomial function to describe the deformations of an elastic surface as a function of the distance from the point of contact towards each of the sensing elements of a WeissRobotics variable resistance sensor.
Another approaches use the data coming from range sensors, e.g. Pezzementy et al. [4] construct the model of a Pressure Profile Systems tactile sensor as an array of proximity sensors without inferring the physics of the material covering the sensing cells. Since a mechanically compliant surface of a real sensor creates cross-talk in a tactile image, the sensing array is characterized with a point spread function (PSF).
TABLE I: Tactile sensing array simulation approaches. Sensor
Model
Sim./Engine Friction Model Geometry SkinSim
[6]
Gazebo /ODE
Mass-spring-damping model for each cell
Array of rigid spheres OpenGrasp [7] OpenRave / ODE
LuGre dynamic friction model Triangularized meshes Deformable Skin [8] RobWorkSim /ODE
Coulomb model Deformable meshes PPS model [4] C++ / OpenGL Sensor ∼ proximity sensor, no contact forces Cubes on a pla-nar surface Developed model Gazebo /ODE PSF, Coulomb friction model Triangularized meshes, cubes
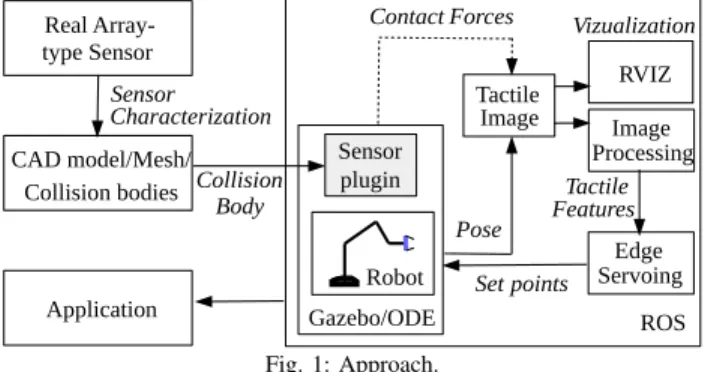
As the first contribution, we present a novel methodology (Fig. 1) to construct a tactile sensing model that takes the advantages of each approach: integration with Gazebo simulation environment, consideration of the effect of contact forces in accordance with a real sensor, and use of PSF based characterization of a real sensor. Such characterization simulates the effects of a soft layer over the sensor on the resulting tactile image.
Using the proposed framework, simulation models were built for the following sensing arrays (Fig. 2 a-c): resis-tive WTS0614 Weiss Robotics, capaciresis-tive 6 × 4 DigiTacts Pressure Profile Systems, and capacitive sensor developed by the Laboratory for Integration of Systems and Technol-ogy (LIST) of the French Alternative Energies and Atomic Energy Commission (CEA). Accordingly, the efficacy of the models was benchmarked in the following tactile servoing applications: a robot end-effector position control in the 6 degrees-of-freedom (dof) Cartesian space, and tactile servo-ing with a 2 dof pan-and-tilt platform. Our approach can be integrated into autonomous exploration techniques with multiple points of contact, e.g. [9], which would potentially enhance autonomous robots.
The proposed tactile sensor model including the its cali-bration and characterization is presented in the next section (Section II). It followed by the implementation of a tactile servoing controller in section III. The responses of the simulated and real sensors are compared in section IV. The last section concludes the work.
Fig. 1: Approach.
II. SIMULATED SENSOR
Figure 1 illustrates the proposed pipeline for constructing a model of a sensor sensing array in the simulated world (SW). The pipeline includes the characterization step. The shape of the sensor in the SW is given by a triangular mesh that can be integrated into Gazebo environment, which is a rigid multibody kinematics simulator based on a physics engine, for example ODE. The engine provides data about collisions at the points of contact between two objects in contact. Thus, we can construct the response of the sensor in terms of a tactile image. It visualize the physical collisions between the bodies. From tactile image, tactile features can be retrieved using computer vision techniques [10]. Usually, the sensing array is attached to a robot in the SE. The robot is always defined by its kinematic structure along with joint controllers. The Gazebo simulator is compatible with the Robot Operating System (ROS) that handles the controllers. A triangular mesh of a sensing array can be designed in one of the following ways: it represents the whole sensor as either a single body or multiple bodies organized in the same way as sensing elements. Figure 2 d) shows the model of the N × M WTS0614 sensor given by a single body with the sensing elements, consisting of pairs of triangles, depicted
Fig. 2: Tactile sensing arrays: (a) WeissRobotics, (b) PressureProfileSystems, (c) Tactile sensing array developed by Laboratory for Integration of Systems and Technology of the French Alternative Energies and the Atomic Energy Commission, (d) 3D mesh model of the 6×14 WeissRobotics tactile sensing array.
with numbers. For this sensor: N = 6 and M = 14; the physical coordinates of a cell are x = i · ∆x and y = j · ∆y, where the size of each sensing element is ∆x = ∆y = 3.4 mm.
A contact force occurs between a sensing element and the environment when they interact. In reality, this force is spread over the neighboring elements due to the soft elastic top layer of the sensor that tends to uniformly spread its deformation to an input stimulus. Thus, every tactile sensing array has specific spatial and force resolution characteristics. In order to fit the spatial characteristics, we apply a PSF model to capture effects of the deformation, as Pezzementi et al [4] proved its efficacy.
A. Point Spread Function
PSF is the function that represents the spatial response of an array to a point stimulus. We apply a PSF based on a two-dimensional Gaussian function to the contact forces at each sensing element with a convolution mask. The parameters of this Gaussian function are estimated from the empirical data (Sec III-A)1.
Therefore, when a force is applied to a sensing element, the effects of the deformations lead to the following relation-ship:
Isim(i, j) = Fsim(i, j) ∗ g(a, b) (1)
where i and j are the coordinates of a tactile sensing cell (or tactel) in an N × M sensing array, Isim(i, j) is the resulting
tactile imagein the simulation; Fsim(i, j) is the input force.
g(a, b) = 2πσ12e −1
2 a2 +b2
σ2 is the 2D Gaussian PSF function
with σ the normal distribution and a × b the size of a kernel with a = b; ∗ denotes the convolution in the spatial domain, i.e. I(i, j) = a=aend P a=astart b=bend P b=bbtart F (i − a, j − b)g(a, b).
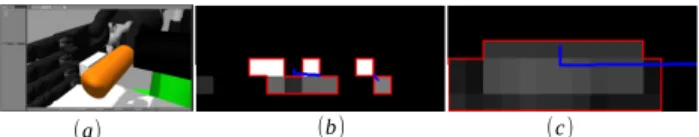
The result of the PSF model, applied to the contact force profile depicted in Fig. 3 b, is illustrated in Fig. 3 c. Fig. 3 a shows the simulation environment: a Shadow robotic hand with a Weiss tactile sensing array over its palm (white) and the object (orange) that is in contact with the sensor.
The contact force profile is obtained as described in the following section.
1In the following, the parameters of the Gaussian function are σ = 0.5 and the kernel size is 3 × 3 determined by comparing real and simulated contact patterns
Fig. 3: (a) A cylindrical object in contact with the simulated sensor. (b) The initial tactile image (stimulus). (c) The resulting tactile image of the convolution of the stimulus with a PSF. Red and blue lines visualize contours and principal components of contacts, respectively.
B. Contact force
The term Fsim in eq. (1) is the force profile, which is built
from the forces at each tactel. When the sensor collides with an object, ODE calculates the contact forces using a temporal spring-damper system at the intersection of the surface trian-gles. The simulator allows small penetrations in the colliding objects, from which it estimates normal and tangential forces based on the stiffness and friction coefficients of the bodies in contact. We assume that the frictional coefficients are rather low to allow sliding motions. Then, the contact force Fsim
at the (i0, j0)-th sensing element with coordinates x(i0) and
y(j0) is computed as follows:
Fsim(i0, j0) = kscale Nx,Ny
X
i,j
Fn∃(x, y) : (|x − x(i0)|
∈ ∆x) ∧ (|y − y(j0)| ∈ ∆y) ∧ (|z − z(i0, j0)| ∈ h)
(2)
where h is the height of the sensor (in z direction), Nx
and Ny are the number of tactels along x- and y-axes,
respectively, Fn is a normal force provided by the Gazebo
simulator at the point of contact between an object and the given element with the volumetric dimensions ∆x, ∆y, ∆z. The coordinates x, y, z are the coordinates of collisions between the sensor and an object with respect to the sensing frame. Thus, we sum the contact forces that appear on the surface and within the dimensions of (i0, j0)-th tactel.
We take into account the normal forces only because the tangent forces tend to zero as the surface friction coefficients are assumed to be negligible. The resulting force is then normalized by a scaling factor kscaleto respect the maximum
of the real sensor output, and down-sampled in time to make the simulated bandwidth equal to the bandwidth of a real sensor.
Thus far, we derived a custom sensor model. The model takes as the input the interaction forces (calculated by the ODE physical engine) and considers their spreading due to the compliance of the elastic surface of the corresponding real sensor. Although the developed sensor model does not apply the deformations of the surface of the sensor in the simulation, it generates the tactile image coherent with the empirical data (Sec. V-A).
C. Tactile image
The simulated sensor is added in the simulation by defin-ing its attachment frame with respect to an end-effector of a robot, e.g. the palm of a robot hand. Then the sensor provides this end-effector with the tactile image. The procedure of obtaining this image is summarized in Algorithm 1.
As indicated in the developed algorithm, the tactile im-age is the result of the convolution of a Gaussian with contact forces, which are clustered in row-column structure and provided by a physics engine. The parameter σ of the Gaussian and a stiffness parameter for deriving the contact forces should follow the real parameters that are obtained empirically by the sensor characterization procedure described in the next section.
III. SENSOR CHARACTERIZATION
In the following, we show the steps of how any tactile sensing array can be characterized using a 3 axes manual manipulating platform. The steps include:
1) calibrating of every tactel of the sensing array with a ground-truth force measuring device: First step is dedicated to find the relation between the ground-truth forces and responses of each sensing element in the array. The indenter pressed once on different elements.
2) recording the penetration depths and verification of the repeatability of sensor responses: second step is dedicated to identify the mechanical compliance (stiffness) of the sensing surface. The indenter pressed on a sensing element, increasing the penetration depth slowly, and recording mean-while the penetration depth and the force response. Also the repeatability of a given sensing element is tested by pressing several times on the same tactel with the indenter.
A case study is performed using the resistive WTS0614 WeissRobotics sensor. The output of the sensor is 12 bit raw voltage level values.
A. Characterization setup
The following tools, illustrated in Fig. 4, can be used to characterize the sensor’s response: a schematic drawing of the sensing elements’ locations (Fig. 4 c and Fig. 5 a) that help to determine the locations of the tactels needed for Algorithm 1, the ground-truth ATi Nano17 force and torque sensor (Fig. 4 b), a custom-made cylindrical indenter with the diameter of 1 mm (Fig. 4 b), the Proxxon mf70 D-54518 milling device (Fig. 4 a) used as a three axes manipulator. The sensor was fixed (with a thin double side scotch 3M) to a flat surface within the three axes manipulator’s (Proxxon
Algorithm 1 Tactile image in Simulation T actileArray ← triangularized meshes
Stif f ness ← Real stiffness coefficient (e.g. Fig. 6 b) P enetrationDepth ← Thickness of the sensing surface SensorLocation ← RobotDescription
Contact forces F ← CollisionsPhysicalWorldSimulator Nx× Ny← NumberOfTactels
for all F ∈ Nx× Ny do
Fsim(i, j) ← equation (2), Fig. 5 // scaled force value
end for
for all Fsim∈ Nx× Ny do
Isim(i, j) ← equation (1) // contact image pixel
end for
Fig. 4: Tools used for the characterization of the WTS0614 sensor. (a) Manual 3-axis platform. (b) The ground-truth force and torque ATI Nano 17 sensor with the indenter printed using a 3-dimensional rapid prototyping machine. (c) Schematic of the locations of the sensing elements.
mf70) workspace. The manipulator has the resolution of 0.2 mm in the horizontal directions and 0.05 mm in the vertical direction (red arrows in the Fig. 4 a). ATi Nano17 force sensor was attached to the machine’s head using a custom made adapter piece. This force sensor with an attached indenter was pushed against the elastic sensing surface over the centers of the sensor’s sensing elements. We captured the deformations in the normal direction of the sensing frame, tactile sensor outputs, and the force sensor measurements obtained by pressing the elastic surface incrementally up to the saturation of the sensor output. The signals from the tactile array and ground-truth force sensor were synchronized using a data synchronization tool of ROS framework.
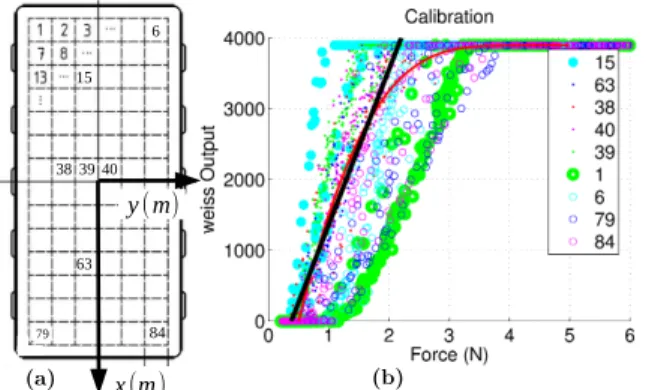
B. Step 1: tactile sensor output calibration
Fig. 5 b shows the sensor’s responses versus the ground-truth force measurements. The linearized response is de-picted with the black line. We can assume that interaction forces are within the linear range (from 0.2 N to 1.8 N with a ratio output→force of kout→f orce= (1.8−0.2)/(3840−0) =
0.0004outN ) of the tactile sensor’s response2. The maximum
Fig. 5: Responses of the individual sensing elements (tactels) to the applied forces on each element. The sensor outputs are the raw values of the WeissRobotics WTS 0614 sensor that is based on the electro-conductive rubber technology. (a) Locations of tactels and (b) the raw output values of tactels versus ground-truth forces.
detectable pressure applied by the indenter with the diameter
2though the response of an element of the sensor can be characterized with a higher order polynomial (depicted with the red color)
Fig. 6: (a) Step responses of the same tactel from multiple trials (tactel 39 in this case study). (b) Maximum penetration depth and ground-truth force measurements.
of 1 mm is given by the maximum normal force Fmax
applied onto the sensor surface with the area of π · r2:
Fmax/(π · r2) = (2N/0.785m2) · 106= 2.548 · 106 Pa, that
is 0.25N/mm2or 2.89 N per tactel. There is a significant
difference in the minimum trigger level (i.e. the minimum detectable contact force) of the tactel 15, which is close to the center, and the tactel 1, which is located at the border: the tactel in the center is more sensitive than the tactel near the border. This irregularity is due to the fact that the rubber is attached to the base of the sensor from the sides, where the rubber is less soft than in the center. We take into account such irregularities by calibrating each tactel separately and applying a scaling coefficient for the response each tactel.
C. Step two: stiffness and maximum penetration
The sensor responses have a creep behavior over a series of deformations as shown in the Fig. 6 a. The response of the same tactel changes from one trial to another: the indenter pushed the sensing element number 39 several times. The repeatability of the response of the tactel had a variation of almost 1.5 times at the point around 1.5 N. This happens because of the hysteresis of the flexible surface, temperature variations, and a creep behavior under a constant force [11]. However, such limitations can be mitigated in simulations without undesirable effects. In order to estimate the compliance constant Cz, the sensing surface
was deformed by the displacements of 0.2, 0.4, 0.6, 0.8, 1.0, 1.2, and 1.4 mm. Fig. 6 b shows the response of the ATI Nano17 force sensor (not the raw data of the sensor) to the indentations of the different depths and the linear fit (red line). The maximum displacement and the stiffness of the sensor k = 1/Cz ( in this case-study k ' 2 N/m) define the
Penetration depthand Stiffness parameters in Algorithm 1, respectively.
IV. TACTILE SERVOING FOR EDGE ORIENTATION CONTROL IN A SIMULATION
So far, we developed a method to construct a tactile sensing array in a simulation. If there is a contact between this array and an edge of an object, there are multiple tactels in contact with it. Since the tactels are arranged in raw-column wise, we can extract contact features by applying computer vision techniques to the tactile images generated with the simulated sensor. In most cases, there are two types of contact that occur during physical interaction tasks:
point-and edge- contact type. The geometry of these contacts, i.e. contact features, can be used to steer the movements of the sensorized robot link with respect to the object in contact with it. We will show how a tactile servoing algorithm can be used for steering a contact and aligning with an edge. But it could be extended to more complex tactile servoing tasks, e.g. [10].
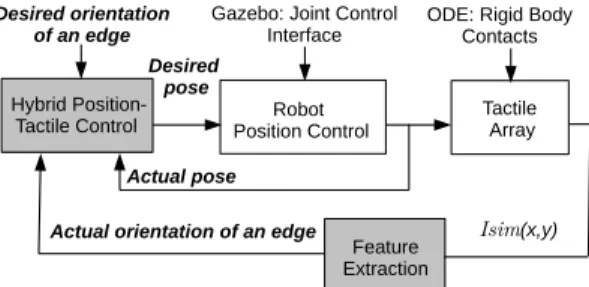
When the sensor is in contact with an edge of an object, it is possible to compute the orientation of this edge with respect to the sensor from Isim. Fig. 7 represents a general
control architecture of a tactile servoing scheme with a posi-tion controlled robot. Isim is obtained by Algorithm 1. The
orientation of the edge is given by the principle component with the largest eigen vector, obtained from the Principle Component Analysis technique. In fact, this principle com-ponent U1represents the direction in which the contact points
are spread the most, and its orientation:
αz= tan−1(
U1
ex
), (3)
where exis one of the basis component vectors of the sensor
coordinate frame. By comparing this actual and desired orientations, the controller gets the error ∆x of the robot end-effector pose, that is consequently fed into a Cartesian position controller of the robot.
Fig. 7: Edge orientation control using tactile servoing in simulation envi-ronment.
V. VALIDATION AND APPLICATION
In the following, we validate the Algorithm 1 in static experiments, when a tactile image does not change with the time, and dynamic experiments, when this image is not static.
A. Tactile images derived empirically and in simulation In static experiments, we compare the responses of the real and simulated WeissRobotics sensors. Indenters with different shapes were used for these experiments. These indenters were pushing the real and simulated sensors with 100 g and 500 g scale loads under the gravitational force. Fig. 8 shows the results of the comparison of tactile images obtained in simulation and empirically when an indenter with an hexagonal shape pressed against the sensor.
The quality of fit between real and simulated images was computed as difference of intensities of the same tactels dI,σ =< Isim, Ireal >, where Ireal is the empirically
derived tactile image. dI,σwas used as the quantitative metric
to evaluate the similarity for each image. Fig. 9 shows
Fig. 8: Comparison of real and simulated images of an Hexagon-shaped indenter. (a) A real tactile image. (b) An experimental setup with 500 grams scaling load. (c) The hexagon-shaped indenter. (d) The indenter and sensor in Gazebo simulation environment. (e) Tactile image acquired from the simulation.
the results of this evaluation for different configurations, including 0, 45, and 90 degrees, and the 100g and 500g scale loads. The median of the difference between the empirically derived tactile images and those that are derived in simulation is around 5%, which is sufficient enough to test the tactile images that change with the time.
Fig. 9: Comparison of real and simulated images of selected indenters at different angles.
B. Edge orientation servoing with 2dof platform
In contrast to previous experiments, where tactile images were static, tactile images will be continuously changing in the following experiments. In order to validate the proposed framework for continuously changing contacts, the perfor-mance of an edge tracking tactile servoing controller serves as the qualitative metric. For this purpose, a pan-and-tilt platform is used as an experimental platform. Fig. 10 a, b show the simulation model and real the platform, comprising 3 capacitive DigiTacts Pressure Profile Systems tactile arrays, respectively. These sensors are represented by meshes and the tactile image is obtained as explained in Sec. II. The platform is driven by 2 Dynamixel AX12 servo motors with 100 Hz bandwidth of its control loop. The sensing arrays are located on top of the platform.
This platform can rotate around the axis that is perpendic-ular to the surface of the tactile arrays. When a cylindrical object is interacting with these sensors (Fig. 11 a), it is possible to obtain the orientation of an edge that appears in the tactile image from eq. (3). Then it is possible to control the angle of rotation of the motor, that is at the bottom of the platform, with a Proportional-Integral-Derivative (PID) regulator to steer the orientation of the edge in the tactile image to the desired orientation Fig. 11 b illustrates the corresponding tactile images and the controller convergence from the initial orientation of the edge (phase I) to the final orientation (phase III).
Fig. 10: (a) Experimental platform with 3 6 × 4 DigiTacts Pressure Profile System tactile sensing arrays for validation of a continuously changing tactile image. (b) The real 2dof platform.
Fig. 11: (a) Experimental scenario with a cylindrical object interacting with the sensing arrays. (b) The actual orientation of the edge (red) converges to the desired state (green).
The PID gains are set so that there is a proportional gain only, which results in a convergence time of 5 seconds. The gains, however, can be tuned to have a much faster response than 5 sec. The convergence of the tactile image from a current to the desired state indicates that the sensor model works for the contact forces that change with time. It also verifies the efficacy of the simulation of the tactile servoing. In this experiment, we considered 1 dof only.
C. Edge servoing with robot hand in the Cartesian space As the physical interactions occur in the 6D Cartesian space, it is desirable to obtain tactile images from the links that move in this space. Fig. 12 a shows a robot arm with a hand interacting with the cylindrical object. It is then possible to obtain the current (Fig. 12 b, red color) orientation of the edge and the desired (green color) orientation in the Cartesian space. Such a simulation model can be used in the development of algorithms for human-robot co-manipulation tasks as shown in Fig. 12 c, in which a robot hand adapting its position and orientation to grasp an object given by a human subject.
VI. CONCLUSION
In our previous works, e.g. in-hand shape recognition [12], we faced with advantages of simulation environments and with limitations of them in regards to precise controlling of contact geometry, e.g. [10]. The key point for the limitations was the lack of a simulation model of tactile sensing arrays. In this work, we developed a method for simulation of a tactile sensing array. In this method, we applied PSF
Fig. 12: Edge orientation servoing in the Cartesian space.
with the convolution of a 2D Gaussian with parameters obtained empirically with contact forces provided by a physical engine. The difference between real and simulated images was about 5%. The second contribution of this work was the simulation of the tactile servoing controller using DigiTacts PPS and WTS0614 WeissRobotics sensors. Future work includes advancing the framework for using a simulated model with a physical engine that can computes surface deformations.
REFERENCES
[1] A. Cully, J. Clune, D. Tarapore, and J.-B. Mouret, “Robots that can adapt like animals,” Nature, vol. 521, pp. 503–507, 2015.
[2] S. Haddadin, A. Albu-Sch¨affer, and G. Hirzinger, “Safety evaluation of physical human-robot interaction via crash-testing, robotics,” in Science and Systems Conference, June 2007, pp. 217–224.
[3] M. Briot et al., “The utilization of an artificial skin sensor for the identification of solid objects,” in 9th Int. Symp. on Industrial Robots, 1979, pp. 13–15.
[4] Z. Pezzementi, E. Jantho, L. Estrade, and G. Hager, “Characterization and simulation of tactile sensors,” in Haptics Symposium, 2010 IEEE, March 2010, pp. 199–205.
[5] H. Zhang and N. Chen, “Control of contact via tactile sensing,” Robotics and Automation, IEEE Transactions on, vol. 16, no. 5, pp. 482–495, Oct 2000.
[6] A. Habib, I. Ranatunga, K. Shook, and D. O. Popa, “SkinSim: A simu-lation environment for multimodal robot skin,” in Automation Science and Engineering (CASE), 2014 IEEE International Conference on. IEEE, 2014, pp. 1226–1231.
[7] S. Moisio, B. Le´on, P. Korkealaakso, and A. Morales, “Model of tactile sensors using soft contacts and its application in robot grasping simulation,” Robotics and Autonomous Systems, vol. 61, no. 1, pp. 1–12, Jan. 2013.
[8] J. A. Joergensen, L.P. Ellekilde, and H. G. Petersen, “Robworksim -an open simulator for sensor based grasping,” in Robotics (ISR), 2010 41st International Symposium on and 2010 6th German Conference on Robotics (ROBOTIK), June 2010, pp. 1–8.
[9] N. Sommer and A. Billard, “Multi-contact haptic exploration and grasping with tactile sensors,” Robotics and Autonomous Systems, vol. 85, pp. 48–61, Nov. 2016. [Online]. Available: http://linkinghub.elsevier.com/retrieve/pii/S0921889016301610 [10] Z. Kappassov, C. Juan, and P. Veronique, “Zmp features for touch
driven robot control via tactile servo,” in 2016 International Sympo-sium on Experimental Robotics, vol. 21. Springer, 2016.
[11] W. Robotics, “Tactile sensors,” http://weiss-robotics.de/en/ tactile-sensors.html, 2014, accessed April 4, 2014.
[12] A. Vasquez, Z. Kappassov, and V. Perdereau, “In-hand object shape identification using invariant proprioceptive signatures,” in 2016 IEEE/RSJ International Conference on Intelligent Robots and Systems (IROS), Oct 2016, pp. 965–970.