HAL Id: inserm-02617094
https://www.hal.inserm.fr/inserm-02617094
Submitted on 25 May 2020HAL is a multi-disciplinary open access
archive for the deposit and dissemination of sci-entific research documents, whether they are pub-lished or not. The documents may come from teaching and research institutions in France or abroad, or from public or private research centers.
L’archive ouverte pluridisciplinaire HAL, est destinée au dépôt et à la diffusion de documents scientifiques de niveau recherche, publiés ou non, émanant des établissements d’enseignement et de recherche français ou étrangers, des laboratoires publics ou privés.
dimorphism of Non-Alcoholic SteatoHepatitis (NASH)
Jimmy Vandel, Julie Dubois-Chevalier, Celine Gheeraert, Bruno Derudas,
Violetta Raverdy, Dorothée Thuillier, Luc van Gaal, Sven Francque, Francois
Pattou, Bart Staels, et al.
To cite this version:
Jimmy Vandel, Julie Dubois-Chevalier, Celine Gheeraert, Bruno Derudas, Violetta Raverdy, et al.. Hepatic molecular signatures highlight the sexual dimorphism of Non-Alcoholic SteatoHepati-tis (NASH). Hepatology, Wiley-Blackwell, 2020, �10.1002/HEP.31312�. �inserm-02617094�
1
Hepatic molecular signatures highlight the sexual dimorphism
of Non-Alcoholic SteatoHepatitis (NASH).
Jimmy Vandel1, Julie Dubois-Chevalier1, Céline Gheeraert1, Bruno Derudas1, Violetta Raverdy2, Dorothée Thuillier2, Luc Van Gaal3,5, Sven Francque4,5, François Pattou2, Bart
Staels1, Jérôme Eeckhoute1 and Philippe Lefebvre1,*
1 Univ. Lille, Inserm, CHU Lille, Institut Pasteur de Lille, U1011-EGID, Lille, France 2 Univ. Lille, Inserm, CHU Lille, U1190-EGID, Lille, France.
3 Department of Endocrinology, Diabetology and Metabolism, Antwerp University Hospital, Edegem (Antwerp), Belgium.
4 Department of Gastroenterology and Hepatology, Antwerp University Hospital, Edegem (Antwerp), Belgium.
5 Laboratory of Experimental Medicine and Pediatrics (LEMP), University of Antwerp, Wilrijk (Antwerp), Belgium.
2
Footnote page:
* Correspondence: Dr P. Lefebvre, philippe-claude.lefebvre@inserm.fr UMR 1011 Inserm and European Genomic Institute for Diabetes
Université de Lille Bâtiment J&K, Faculté de Médecine de Lille-Pôle Recherche Boulevard du Professeur Leclerc
59045 Lille cedex, France Tel +33.3.20974220
Abbreviation list: ALAT: alanine transaminase; ASAT: aspartate aminotransferase; AUC:
area under the curve; BMI: body-mass index; BP: biological processes; DE: differentially expressed; DEGs: differentially expressed genes; FC: fold change; GO: gene ontology; HbA1c: glycated hemoglobin; HDL-C: high-density lipoprotein-cholesterol; HL: healthy liver; HOMA-IR: homeostasic model assessment of insulin resistance; NAFLD: non-alcoholic fatty liver disease; NASH: non-non-alcoholic steatohepatitis; RF: random forest; RFE: recursive feature elimination; SVM: support vector machine.
Financial support
This work was supported by grants from Agence Nationale pour la Recherche (ANR-16-RHUS-0006-PreciNASH and ANR-10-LBEX-46), the European Union (FP6 Hepadip FP6-018734 and FP7 Resolve, FP7-305707), Fondation de France (Grant 2014 00047965), Fondation pour la Recherche Médicale (Equipe labellisée, DEQ20150331724). BS is a recipient of an Advanced ERC Grant (694717).
3
ABSTRACT
Background and Aims: Non-Alcoholic SteatoHepatitis (NASH) is considered as a pivotal
stage in Non-Alcoholic Fatty Liver Disease (NAFLD) progression, as it paves the way for severe liver injuries such as fibrosis and cirrhosis. The etiology of human NASH is multi-factorial and identifying reliable molecular players and/or biomarkers has proven difficult. Together with the inappropriate consideration of risk factors revealed by epidemiological studies (altered glucose homeostasis, obesity, ethnicity, sex…), the limited availability of representative NASH cohorts with associated liver biopsies, the gold standard for NASH diagnosis, probably explains the poor overlap between published “omics”-defined NASH signatures. Approach & Results: Here we have explored transcriptomic profiles of livers starting from a 910 obese patient cohort which was further stratified based on stringent histological characterization, to define ”NoNASH” and ”NASH” patients. Sex was identified as the main factor for data heterogeneity in this cohort. Using powerful bootstrapping and random forest (RF) approaches, we identified reliably differentially expressed genes participating to distinct biological processes in NASH as a function of sex. RF-calculated gene signatures identified NASH patients in independent cohorts with high accuracy. Conclusions: This large-scale analysis of transcriptomic profiles from human livers emphasized the sexually dimorphic nature of NASH and its link with fibrosis, calling for the integration of sex as a major determinant of liver responses to NASH progression and responses to drugs.
4
INTRODUCTION
Non-alcoholic fatty liver disease (NAFLD) is a growing health burden initially developing in western countries and spreading to areas in which lifestyle and diet changes increase the prevalence of obesity and insulin resistance (1). NAFLD is now the most common chronic liver condition with a worldwide prevalence of ≈25% of the total population (2). NAFLD encompasses a spectrum of liver histological manifestations, from relatively benign hepatic steatosis (NAFL) to more severe liver injuries leading to non-alcoholic steatohepatitis (NASH). Lobular inflammation and ballooning degeneration of hepatocytes are histological characteristics of NAFL progression toward NASH (3). NASH is strongly associated with fibrosis (4-6), which is itself, even at early stages, predictive of increased overall and liver-related mortality (7-9).
A number of genome-wide scale transcriptomic analyses described hepatic gene expression pattern alterations in NAFL and NASH patients versus ”healthy obese” or lean individuals (10-16), prompting meta-analysis to define NASH and/or fibrosis core molecular signatures (12, 13, 17). Although identifying novel or confirming established players in NASH progression, these studies did not allow the definition of a predictive core gene signature, as little overlap between each meta-analysis was observed. Multiple confounding factors and technical biases may account for this inconsistency, such as differences in genetic origin, unappreciated environmental factors and cohort stratification criteria. In addition, stratification did not always take into account major risk factors for NASH revealed by epidemiological studies such as the metabolic status
(18, 19). Most importantly, many human pathological manifestations are sex-dependent
(20, 21) and NAFLD-induced liver injuries are mostly reported as more severe in men
(22). However, despite obvious sex dimorphic traits in metabolic regulations (23), sex was not considered as a factor neither in the design nor upon interpretation of the above mentioned studies.
Generating a global overview of biological processes involved in human disease requires genome-wide analysis of large cohorts containing hundreds of patients to insure the robustness of results (24). Transcriptomic signatures are generally defined through ”top-down” approaches (25), starting from a comparative analysis to identify differentially expressed (DE) genes (DEGs) between healthy and pathological conditions to further select, within this DEG set, several genes supposedly constituting the ”disease” signature. However, the imbalance between the population size (few
5
hundreds) and the number of quantified RNA transcripts (several thousands) generates unstable results, which display a high sensitivity to the genetic, biological and biometric characteristics of the studied cohort (26). Despite being long-established, this variability remained ignored in previous studies, in which single differential analysis were performed on non-segmented cohorts. Furthermore, machine learning methods, such as logistic regressions, are traditionally used to guarantee an unbiased selection of signature genes amongst DEGs (27). Although they may lead to comprehensive models, these methods fail to integrate non-linear gene interactions reflecting biological complexity (28). Non-linear approaches, such as Random Forests (RF) or Support Vector Machine (SVM), can model such complex interactions, but remain rarely used in such studies due to methodological complexity (29-31). Furthermore, variability in computational and statistical methods applied to DEG selection also contributes, especially in a small cohort size context, to observed discrepancies between identified signatures.
The main objective of this study was to define, using unbiased and robust bioinformatic approaches, NASH molecular signatures through a transcriptomic study starting from a large cohort of morbidly obese patients (n=910). In addition to highlighting optimal bioinformatic approaches for biological signature identification, this study identified sex as the main parameter affecting NASH signature definition and associated altered biological processes.
6
METHODS
Cohorts and Datasets
The Hopital Universitaire de Lille (HUL) cohort (ABOS, ClinicialTrials.gov: NCT 01129297) was recruited amongst obese patients visiting the Obesity Surgery Department at the Centre Hospitalier Universitaire de Lille. All patients fulfilled criteria for, and were willing to undergo weight-loss surgery. More details on the constitution and characterization of this prospective cohort are in the Supplemental Data section. Liver needle biopsies were obtained at the time of surgery from 910 patients undergoing bariatric surgery (32). Anthropometric, histological and metabolic characteristics are indicated in Table 1. RNA extraction, purification, labeling and hybridization procedures for microarray analysis have been reported (32). Transcriptome analysis was performed using Affymetrix Human Transcriptome Array (HTA) 2.0 and .CEL files were normalized in a single run of the apt-probeset-summarize command (gc-scale-rma analysis using meta probesets and full quantile normalization, APT program 2.10.0, ThermoFisher). Expression data are available at NCBI GEO:GSE130991.
The Universitair Ziekenhuis Antwerpen (UZA) cohort was recruited amongst overweight patients visiting the Obesity Clinic at UZA suspected to have NAFLD based on imaging and blood biochemistry assays [see (33) for details]. Liver biopsies were from 178 obese patients of which 79 further underwent gastric bypass surgery. Anthropometric, histological and metabolic characteristics, RNA extraction, purification, labeling and hybridization procedures have been previously reported (12). Transcriptome analysis was performed using Affymetrix Human Gene (HuGene) 2.0ST and .CEL files were normalized as above. Expression data are available at NCBI GEO:GSE83452.
Ahrens and collaborators described the Universitätsklinikum Dresden (UKD) cohort which includes lean (control, n=18) and morbidly obese patients (BMI>42kg/m², n=45) either classified as healthy (no steatosis, n=18), NAFL (steatosis only, n=12) or NASH (steatosis and inflammation, n=15) with low fibrosis stage (F≤1, mild) (11). Transcriptome analysis was performed by these authors using Affymetrix HuGene 1.1ST arrays and .CEL files were normalized as above. Gene expression data are available at NCBI GEO:GSE48452.
Moylan and collaborators described the Duke University (DU) cohort composed of 72 overweight or obese patients (29kg/m2<BMI<46 kg/m2) who were stratified according to the fibrosis stage [(F≤1, moderate, n=40) and (F≥3, severe, n=32)] as recommended in (34). The NASH phenotype (inflammation and ballooning) was also more pronounced in the severe branch of the cohort (10). Transcriptome analysis was performed by these authors using
7
Affymetrix HG U133 Plus 2.0 arrays and .CEL files were normalized as above. Gene expression data are available at NCBI GEO:GSE49541.
Cohort stratification, data analysis and bioinformatic procedures.
8
RESULTS
Definition of the learning cohort
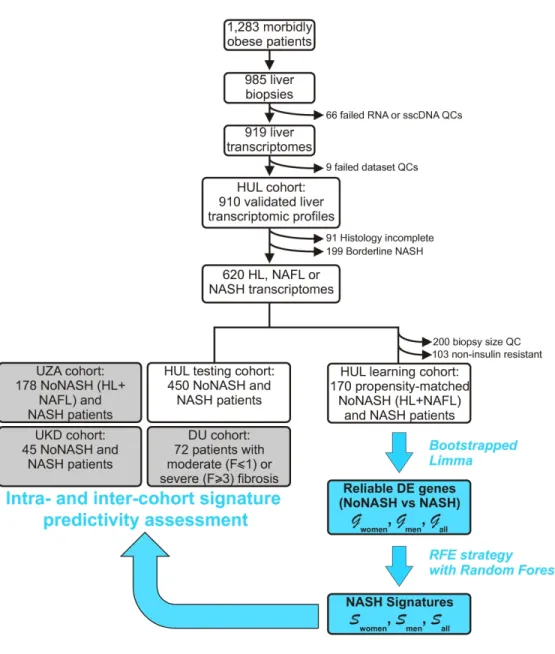
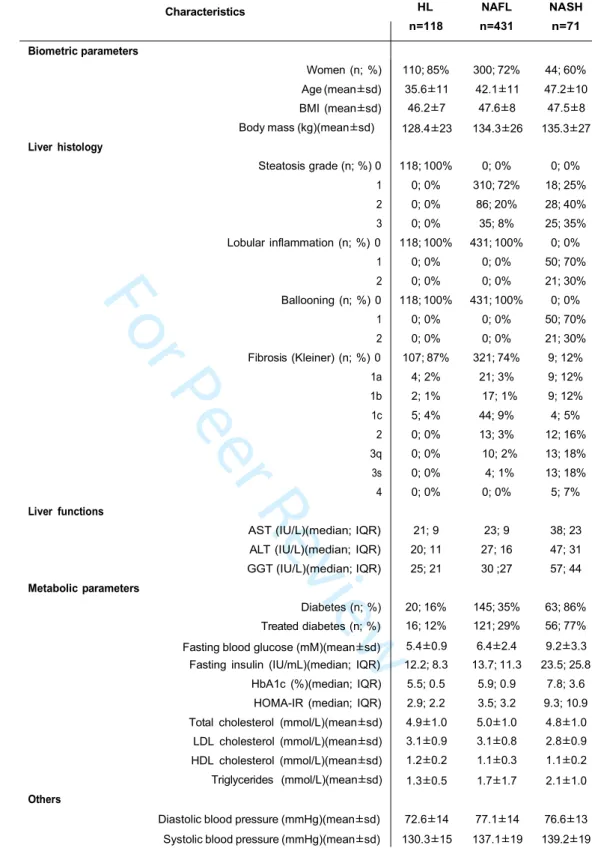
The prospective HUL cohort includes morbidly obese patients presenting all grades of liver steatosis, lobular inflammation and ballooning. Validated liver transcriptomic profiles were obtained from 910 biopsies, which were classified on the basis of histological parameters (steatosis, hepatocyte ballooning, lobular inflammation, Figure 1) to yield a fully characterized 620 patients cohort with healthy [HL, n=118 (19%)], steatotic [NAFL, n=431 (70%)] or NASH livers [NASH, n=71 (11%)] (Table 1). “Borderline” samples to which an unambiguous classification could not be attributed were excluded (n=199) (Figure 1 and Supp. Figure 1). Of note, the HL and NAFL categories were mostly associated to no or moderate fibrosis (F0 to F2, 98%, Table 1), whereas NASH patients exhibited an important proportion of severe fibrosis (F3 to F4, 43%, Table 1). With the aim of eliminating selection bias and confounding factors when assessing the effect of NASH on gene expression profiles as a function of sex, we first defined a so-called “learning cohort” from the 620-patient cohort as follows. First, biopsies were selected according to stringent quality and biological criteria (Figure 1). These criteria were: (a) defining a minimal length >10mm and a number of portal areas per biopsy >8, leading to a 420 biopsies subset (characteristics of this subcohort are detailed in Supp. Table 1); (b) excluding from the analysis patients with normal hepatic insulin sensitivity as they are virtually absent from the NASH category (Figure 2) by using a HOMA-IR index >2.4 which is, after exclusion of patients taking ”rapid insulin”, an arbitrary threshold in accordance with common practices (35, 36); (c) defining a ”NoNASH” group including healthy (HL) and steatotic (NAFL)
livers. To eliminate or reduce any referral or unidentified bias as well as confounding factors, patients were then propensity-matched within each subgroup (NoNASH or NASH) based on sex, BMI, HOMA-IR and fibrosis grade. This defined the HUL learning cohort composed of 124 matched male or female NoNASH patients and of 46 male or female matched NASH patients (Supp. Table 2) allowing to investigate the importance of the sex factor in balanced groups (Table 2). NASH patients displayed higher fibrosis scores and HOMA-IR than NoNASH patients (F3-F4=29% vs 5%, mean HOMA-IR=27.7 vs 6.8, respectively)(Supp. Table 2).
Differential gene expression analysis
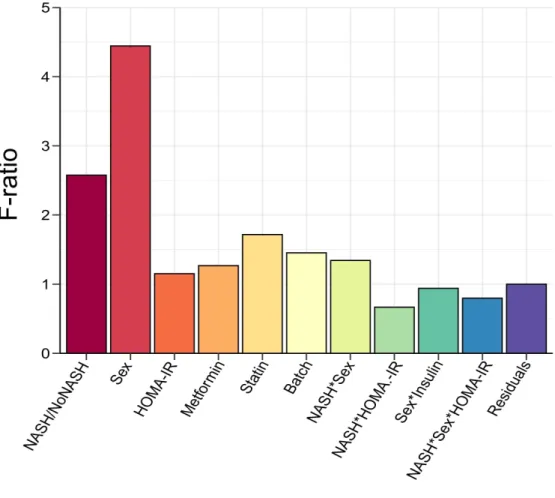
The source of variation in gene expression was investigated using multivariate ANOVA on normalized log2-transformed gene expression signals. Computation of F-ratio (variation explained by the test variable/unexplained variation) for each factor considered in the
9
differential model clearly confirmed sex as the factor explaining the highest expression variance to the dataset (Figure 3). Accordingly, DEGs were first identified, as usually performed in signature discovery studies, by a single Limma run comparing either NoNASH to NASH gene profiles irrespective of sex, or considering only female or male patients (thereafter referred to as “All”, “Women” or “Men” respectively). A variable number of genes was found significantly DE when comparing NASH to NoNASH patients in the men (3,083), women (297) and all patients (3,466) strata (FDR< 10%).
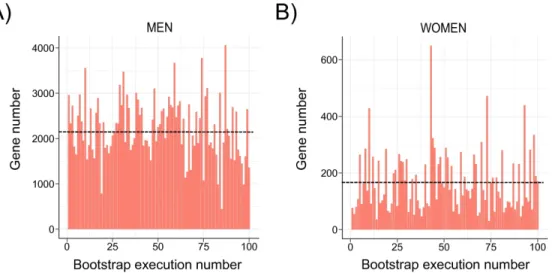
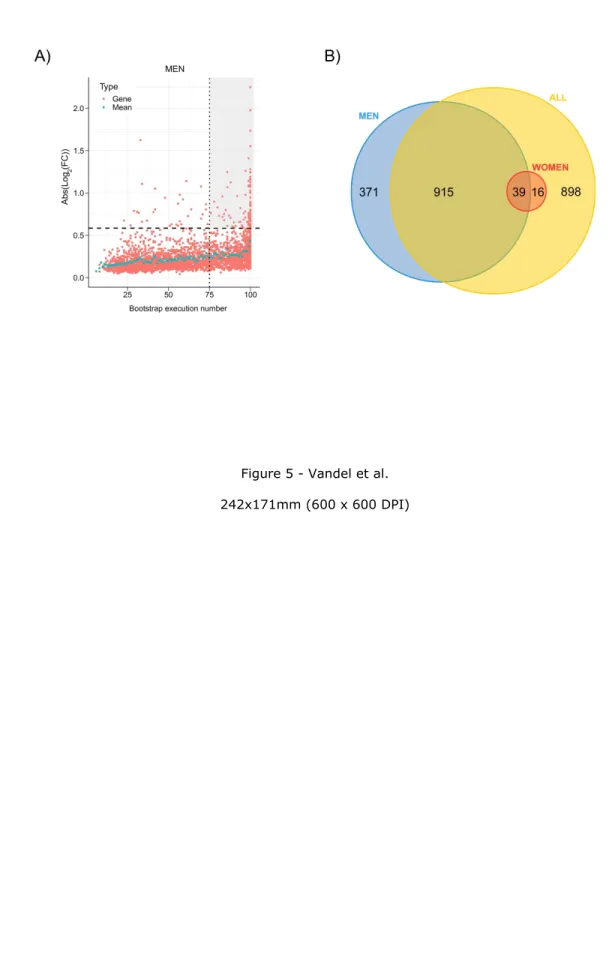
The robustness of DEGs identification was assessed by a bootstrap procedure based on a random subsampling rate = 0.9 (100 iterations) of the learning cohort subgroups followed by Limma differential analysis. This procedure generated 3 groups (G) of DEGs reliably detected in more than 75 bootstrap runs (FDR <10%, Gmen, Gwomen and Gall) and revealed important qualitative and quantitative discrepancies with DEGs detected by a unique Limma run (Figure 4A and 4B, Supp. Figure 2). As an example, CHIL3L1 was detected as DE in the single Limma run for both men and women contrasts, with high fold changes (FCs) (FCmen = 3.30; FCwomen = 2.14). However, the bootstrap procedure reliably detected CHIL3L1 as overexpressed only in male NASH patients (Gmen), as it was found significantly DE in all 100 Limma runs. In contrast, it was dismissed from the women contrast (Gwomen) as it was found significantly DE in only 32 out of 100 runs despite a high mean FC (σFCw = 2.14). This bootstrap analysis thus attributed 1,325 (vs 3,083 in the single Limma run), 55 (vs 297) and 1,868 (vs 3,466) DEGs to Gmen, Gwomen and Gall contrasts respectively (Figure 5A; Supp. Figure 3). Variance analysis did not reveal significant differences in global gene expression between men and women, suggesting that the difference in DEG number was not linked to difference in gene expression heterogeneity (Supp. Figure 4). Thus a strong influence of patient/sample heterogeneity on the differential analysis process was observed.
The incomplete overlap between Gwomen and Gmen suggested a contribution of a sex-specific factor to differential analysis results, as only 39 common transcripts were identified (71% of Gwomen and 3% of Gmen)(Figure 5B). When raising the FC threshold of reliable DEGs up to 1.5 (Supp. Table 3), this overlap increased in proportion (13 overlapping transcripts; 87% of Gwomen and 15% of Gmen), while 74 and 2 genes remained men- and women-specific respectively (Supp. Figure 5). Men-specific genes with highest absolute log2FC values were Solute Carrier Family 22 member 10, SLC22A10) (σFCm = 0:42), Chitinase-3-like protein 1, CHI3L1 (σFCm = 3.36) and Hermansky-Pudlak syndrome 5 protein, HPS5 (σFCm =2.24) and the 2 women-specific genes were HYDIN1(σFCw = 0.52) and HYDIN2 (σFCw = 0.39).
10
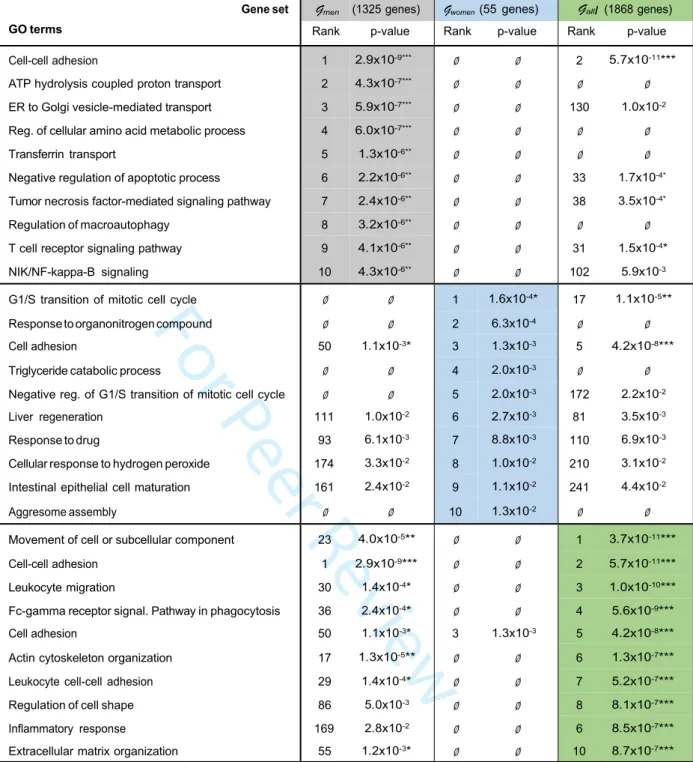
analysis did not provide an overview of altered liver functions in NASH. A gene ontology (GO) term enrichment was thus performed on reliable Gwomen, Gmen and Gall using the Biological Processes (BP) database (Table 3). Interestingly, term enrichment within Gall identified cell-cell contact, immune cell migration, inflammatory response and extracellular matrix remodeling as the most prominent processes, in agreement with the published literature (37). However, GO BP term enrichment of DEGs in Gwomen pointed to cell cycle regulation processes, whereas Gmen revealed a pattern more related to metabolic and inflammation processes (Table 3). This dichotomy was also observed when restricting gene lists to genes with absolute log2FC > log2(1.2) to reduce technical noise, which additionally revealed a specific enrichment of cholesterol-related genes in the men gene set (Supp. Table 4). Due to the low number of dysregulated genes passing this FC threshold (n=41), the women sub-cohort did not allow a statistically significant enrichment in any GO BP term, but visual inspection of the gene list did not highlight any gene involved in cholesterol metabolism.
RF-based identification of signatures
A recursive feature elimination (RFE) strategy coupled to RF models was used to select an optimal gene subset from Gwomen, Gmen and Gall (Figure 1, 6A, 6B; Supp. Figure 6) to predict NoNASH and NASH patients. By progressively eliminating genes with lowest classification power, a minimal gene set yielding a maximized AUC was defined. Signatures corresponding to these optimal subsets contained 20, 15 and 108 genes extracted from Gwomen, Gmen and Gall and are thereafter referred to as Swomen , Smen and Sall respectively (Supp. Table 5). The overlap between these 3 signatures indicated that men- and women-specific signatures shared only 1 gene (Thymidylate Synthetase, TYMS ) (Figure 6C). The larger signature obtained when considering all patients (Sall) largely overlapped with Swomen and with Smen, albeit to a lesser extent, highlighting the need of both sex-specific signature genes in the RF model to efficiently classify an heterogeneous population.
Classification power of signatures
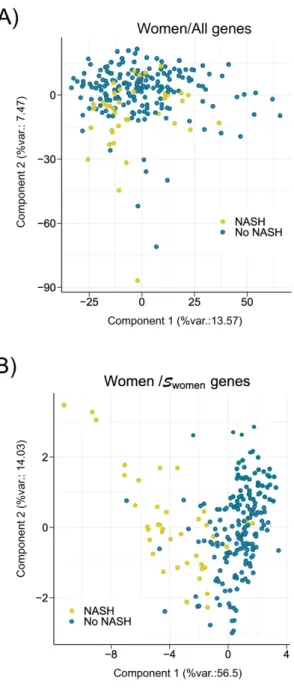
A Principal Component Analysis (PCA) was first employed to validate Swomen, Smen and Sall as tools to separate NASH from NoNASH patients. Separations between NoNASH and NASH patients using gene expression values from reference signatures were sharper than when considering all DEGs expression values (Figure 7; Supp. Figure 7), suggesting that these signatures are highly efficient in discriminating NoNASH vs NASH patients.
11
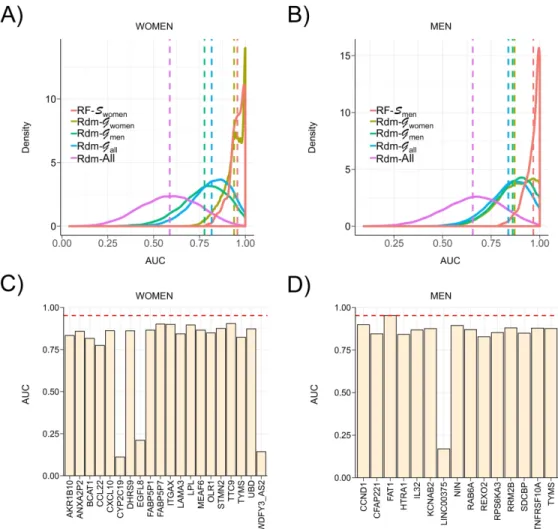
The classification power of these 3 signatures was then evaluated through 200 cross-validation runs using the learning cohort. The distribution of AUCs determined from these runs (Figure 8A, 8B, Supp. Figure 8) showed that highest AUC values were achieved by RF models learnt from Swomen, Smen and Sall to predict women (AUC Swomen = 0.957), men (AUC RF-Smen = 0.970) and all patients (AUC RF-Sall = 0.952) respectively. In comparison, mean AUC reached when using randomly selected signatures models built from Gwomen, Gmen and Gall (AUC Rdm- Gx) were strictly lower than those determined using reference signatures, however with AUCs > 0.8. Amongst guided random signatures, those built from Gwomen reached higher AUC to predict NASH when classifying all patients and more especially the women-only cohort, with performances close to reference signature (Figure 8A, AUC Rdm-Gwomen = 0.939). It is worth noting here that these guided random signatures are composed of 20 genes randomly selected amongst 55 reliable DEGs from Gwomen, thereby inducing a frequent overlap between reference and guided random signatures. Thus the high AUCs achieved by these random signatures did not suggest the uniqueness of a predictive NASH signature in RF models, but are rather indicative of a set of similar signatures built from a limited list (here n=55) of predictive genes. Unguided random signatures built from the full list of genes (Rdm-All) reached poor AUCs around 0.62.
Single gene predictors.
Reference signatures were also compared to single gene predictors to classify NASH vs NoNASH patients in the learning cohort. The classification power of each gene composing Swomen, Smen and Sall to classify women, men and all patients respectively were evaluated (Figure 8C, 8D and Supp. Figure 9). All genes from Swomen and Smen reached absolute AUC greater than 0.77 and 0.82 respectively, especially for FAT1 with an AUC close to the Smen model (AUCSmen = 0.970; AUCFAT1 = 0.953). For Sall genes, AUCs were low and fluctuated from 0.62 to 0.86, suggesting a higher complexity of the corresponding predictive model.
We also tested ad-hoc signatures including a number of genes equal to reference ones and displaying the highest FC in Gmen, Gwomen and Gall of the learning cohort (Supp. Figure 10). For some genes, despite high FC, corresponding individual prediction for NASH remained poor (HMGCS1 in the men group, FCmen=2.4; AUCmen=0.65). Of note, RF-based-models using these ad-hoc signatures most often reached better prediction than individual gene predictors. Taken together, these analyses demonstrate that the RF-calculated signals have a predictive power superior to random and ”single gene” predictors.
12
Independent cohort validation.
Reference signatures were used to classify NASH and NoNASH patients from other cohorts (Table 4). When confronted to the HUL “testing” cohort (excluding the 170-patient learning cohort, n=450), RF models learnt from Swomen, Smen and Sall reached similar AUC when classifying men as NASH or NoNASH patients (AUCmen = 0.87/0.87/0.93), women (AUCwomen = 0.86/0.84/0.87) and all patients (AUCall = 0.88/0.84/0.88). The similarly high AUC values reached when classifying the HUL cohort by these three signatures demonstrated the capacity of RF to learn efficient classification rules from various gene signatures. A validation using independent cohorts was however required to more precisely assess the ability of such signatures to identify NASH patients. Classification predictions ran on the UKD cohort yielded improved AUC values in the women and all patients sub-cohorts when compared to HUL AUC, whereas HUL-generated signatures were slightly less accurate at classifying UKD men as NASH or NoNASH patients (AUCmen = 0.79/0.75/0.79). HUL-generated signatures performed only fairly to classify the UZA cohort (56 NoNASH; 122 NASH), with the best AUC being reached when using Swomen to predict women, men and all patients (AUCwomen = 0.73; AUCmen = 0.76; AUCall = 0.75), whereas Smen yields an AUC around 0.65. Since these values remained significantly lower than AUCs obtained with other cohorts, we assessed signature performances after restricting the NASH category to highly fibrotic patients (F≥3, n=60). RF model performances on this UZAhigh fib. sub-cohort increased the classification prediction power to the same extent for men, women and all patients. Swomen and Sall models to reach similar performances with AUC in the 0.78-0.84 range, and remained higher than models learnt from Smen. These values remained however below those reached with other tested cohorts, suggesting a peculiar yet undetermined biological feature of the UZA cohort or a center effect.
The DU cohort has been stratified according to extreme histological phenotypes, distinguishing a “mild NAFLD” group with a low fibrosis grade (F≤1) and a “severe NAFLD” group with more pronounced liver damages associated to NASH (inflammation and ballooning) and strong fibrosis (F≥3) (10), thus ressembling the UZAhigh fib sub-cohort. We assessed the predictive power of signatures for all patients as sex was not discriminated in this cohort. RF models learnt from Swomen, Smen and Sall showed similar or better AUC for DU cohort (AUCall = 0.80/0.89/0.87) when compared to HUL patient classification. This shows that signature performances extend beyond NASH prediction and may identify patients with severe, clinically relevant fibrotic lesions.
13
To quantify gene relationships within each signature, gene expression correlation networks were built by computing Pearson correlations between each transcript pair in the learning cohort. The 3 resulting gene co-expression networks shared a similar structure, displaying a core of ”central” highly correlated genes and more loosely correlated ”peripheral” genes (Supp. Figure 11). The Sall signature contains 2 core gene sets, the first one including
KPNA2, ANXA2P2, ANXA2, MEAF6, ITGAX and TNFRSF12A and the second one containing DDB2, MDM2, ZMAT3, TYMS, RPS27L and RRM2B. The most highly correlated genes in
Swomen were UBD, STMN2, ANXA2P2, FABP5P1 and FABP5P7, whereas NIN, SDCBP,
CCND1, RRM2B and FAT1 were most correlated in the network computed from Smen. All
correlations were positive except for CYP2C19 in the Swomen network and SFP1 and CYP2C19 in Sall. Thus this correlation study again emphasized the male-female dichotomy in human NASH.
Correlation with clinical parameters
To assess whether RF-built signatures, in addition to identify NASH patients, also segregate patients according to biochemical or biometric parameters, Spearman correlation coefficients were computed between RF-based classification predictions learnt from Swomen, Smen and Sall and clinical parameters for the 620 NoNASH/NASH patient cohort (Table 1) to increase statistical power (549 NoNASH/71 NASH). Highest correlation was observed for HOMA-IR and HbA1c as expected due to higher values for both parameters in NASH patients compared to NoNASH patients of the learning cohort (Table 5). In contrast, no clear correlations were observed between BMI or HDL-C and any signature prediction. Other clinical parameters were correlated in a more sex-specific way, with age, LDL-C, HbA1c and HOMA-IR levels being more markedly correlated with Smen model prediction, whereas liver enzyme levels (ALAT, ASAT) were more strongly correlated with Swomen. Taken together, this correlation analysis suggests that despite being based on distinct gene sets, RF-built signatures identify patients with altered liver enzyme levels and altered glucose homeostasis.
14
Discussion
Several studies have already reported liver transcriptomic signatures of NASH, but their reliability and stability can be questioned due to limited cohort sizes and the lack of the evaluation of signature robustness. In this study, 170 propensity score-matched liver biopsies were selected with rigorous biological and statistical criteria, from which we determined DEGs using a robust bioinformatic protocol. Several methodological pitfalls, mostly ignored in previous studies, have been addressed in our analysis. The use of a bootstrap method to increase the robustness of DEGs identification by Limma, a commonly differential analysis approach, has previously evidenced a high sensitivity of the differential analysis to cohort composition (26). In our study, such a bootstrap analysis led to the exclusion of 50 to 82% of transcripts initially identified as DEGs by a single Limma run. This instability was noted for the 3 contrasts (Gall, Gwomen, Gmen). Importantly, exclusion was not restricted to poorly expressed or weakly modulated genes. Thus, to avoid misinterpretation, a stability analysis using a bootstrap approach should be systematically performed in cohort studies.
Numerous studies reported the sexual dimorphic nature of metabolic regulations (38, 39). In the liver, they have been mostly ascribed to the growth hormone/JAK2/STAT5 pathway
(40). NASH has also a strong sex-specific component with men generally displaying a more severe phenotype than non-menopausal women (41, 42). On the basis of RF models, we identified sex-specific NASH signatures whose predictive power were evaluated against independent cohorts. We further compared the robustness of such signatures to that of single gene predictors and random signatures. We found a larger number of reliable DEGs in men than in women, whose median age is 45 years +/-11 (sd). A distinct menopausal status amongst women around 40 to 50 year-old could explain such a difference by increasing biological noise to the differential analysis and impairing DEGs detection. The low overlap between Gwomen and Gmen and associated signatures hints at sex-specificity as well. Indeed, GO BP enrichment of reliable DEGs in men or women did not reveal recurrent biological themes with the exception of ”cellular adhesion”, a rather broad terminology unable to pin down specific biological pathways. The 39 commonly dysregulated genes are not associated to a specific biological process, leaving open the question of a potentially (dis)similar natural history of men or women NASH. Interestingly, we observed that GO BP term enrichment of DEGs in Gwomen pointed to cell cycle regulation processes, a feature which may be related to the higher propensity of female hepatocytes to proliferate (43).
Three signatures were identified using RF models, with Smen and Swomen encompassing a similar number of transcripts. Sall was larger due to a higher sample number used for training, thereby enabling more sophisticated classification rules to be employed with this more
15
heterogeneous population. A careful evaluation of bioinformatically-defined signatures is required as employed algorithms may use FCs which do not seem significant from a biological point of view. Thus, while several signatures can reach similarly high classification performances in RF, the identification of a unique signature surpassing all others in various conditions or cohorts remains unlikely. Additionally, such algorithms limit information redundancy when selecting signature genes, thus hindering the detection of significantly enriched GO terms in signature gene lists.
We compared the predictive performances of our signatures to those of randomly-generated signatures or single gene predictors. RF-based signatures were consistently more efficient at classifying NASH vs NoNASH patients from independent cohorts. A single gene predictor could perform better than a signature for a given dataset, but not as efficiently on other cohorts. For example, FAT1, a gene regulating cell-cell contact, which was highly predictive of NASH in male patients from the HUL cohort, turned out to be inefficient in the UKD cohort (Supp. Figure 12). Thus signatures are required to extrapolate classification performances to other cohorts by reducing prediction variability of single gene predictors. Among the tested 3 signatures elaborated from Gwomen, Gmen and Gall, Swomen was the more robust with a limited size (n=20). Reason(s) for this better performance are yet unclear.
The prognostic performance of signatures was improved in the UZA cohort when stratifying patients according to the fibrosis grade. In line with this, predictivity of signatures on the fibrosis-stratified DU cohort was in the highest range, suggesting that our analysis integrates features of the fibrotic response, which is clinically relevant when considering long term outcomes (7, 8). Interestingly, some genes constituting the NASH signatures were also identified when defining a cross-species transcriptomic signature of fibrosis (12). Indeed, 12 out of 34 (35%) genes constituting this fibrotic signature (12) were identified as strongly up-regulated (abs. log2FC>1.5) in the bootstrapped Limma analysis (Supp. Table 3) and 6 of them are common to both the cross-species fibrotic signature and NASH signatures reported here (Supp. Table 5). These genes are UBD/FAT10, CCDN1/cyclinD1, FAT1,SPP1/osteopontin,
ZMAT3 and FABP4/aP2.
Machine learning approaches like RF extract information and outperform linear approaches. They identified signatures in the HUL cohort that reached AUROCs in the 0.62-0.93 range when diagnosing independent cohorts, therefore being comparable to, or better than other NASH signatures based on lipidomic (44, 45) or combining multiple proteomic, biometric and genomic characteristics (46). Importantly, our study clearly points to sex as an often-neglected (22), but nevertheless important factor in liver and NASH biology (42). Indeed, liver physiopathological responses to various challenges are sex-dependent in rodents
(47-16
49). Although the translatability of these findings to our human-based analysis is not straightforward, all these data converge towards a definition of human NASH as a sexually dimorphic disease. This is a potentially important and relevant finding in terms of biomarker research (as for example YKL-40/CHI3L1 is included in a biomarker panel in development), as well as for risk stratification and pharmacological therapy. Liver pathophysiology displays gender-linked disparities, suggesting that liver-targeted drugs may exhibit distinct mechanisms of action in men and women. In this respect, we note that the recent randomized Phase II clinical trial evaluating the effect of cenicriviroc (a dual CCR2-5 antagonist) in the treatment of NASH with fibrosis, resulted in positive effect in men, but not in women, on the improvement of fibrosis after 1 year (50). Although a limitation of our work is the comparison of a rather small NASH population to a larger non-NASH cohort, our data and others call for a careful design of pre-clinical and clinical studies integrating sex as a major determinant of liver responses.
17
Author’s contributions
CG and BD performed experiments and collected data; JV, JDC, JE and PL analyzed data; JV and PL wrote the manuscript; DT provided expertise in statistical analysis; LVG, SF, VR and FP constituted and managed UZA and HUL cohorts, and collected biological data and samples; JV, BS and PL coordinated the study; JV, JDC, BS, SF, JE and PL revised the manuscript.
Competing interests
The authors declare that they have no competing interests.
Availability of data
The transcriptomic datasets generated during and/or analyzed during the current study are available in the NCBI GEO repository. Clinical data that support the findings of this study are available from the corresponding author upon reasonable request.
18
FIGURES LEGENDS
Figure 1: HUL cohort analysis. The main steps of the HUL cohort transcriptomic analysis,
stratification and bioinformatic analysis are indicated, as well as the steps during which definition and validation of proposed sex-specific NASH signatures were undertaken. Details can be found in the Methods and in the Results sections. sscDNA: single stranded complementary DNA; QC: quality control;
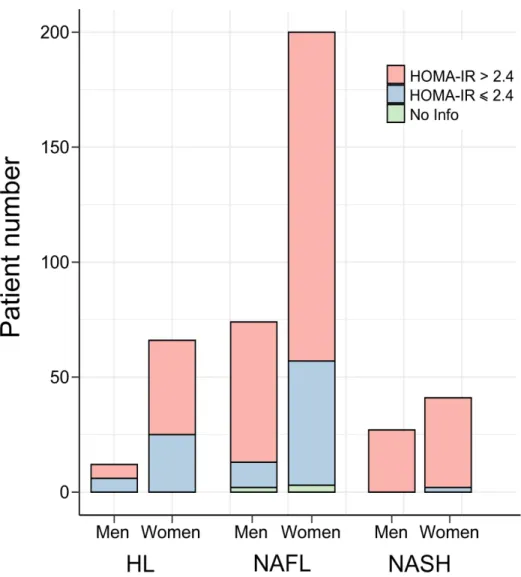
Figure 2: Insulin sensitivity and β-cell function in the HUL cohort. The proportion in the
HUL cohort of insulin-resistant IR index>2.4, in red) and non insulin-resistant (HOMA-IR index ≤ 2.4, in blue) patients amongst HL (n=78), NAFL (n=274) and NASH (n=68) groups is displayed as a function of sex. HL: healthy liver, NAFL: steatotic liver.
Figure 3: Analysis of variance (ANOVA). F-ratio values of factors included in the Limma
model were calculated. High F-ratio values indicate a strong linear relationship between a given factor and gene expression values. Interaction term between factors A and B are indicated as an A*B annotation. Factors were selected on the basis of published reports.
Figure 4: Instability of the Limma-based determination of DE genes. The number of DEGs
between NoNASH and NASH patients (FDR < 10%) for (A) men, (B) women was assessed after 100 subsamplings (rate = 0.9) of the learning cohort followed Limma analysis. Mean DEG number is represented by a black dotted line
Figure 5: Identification of reliable DE genes. The absolute log2FC of DEGs was computed for the men learning cohort (Gmen , n=85). Each significantly DEG (FDR<10%) is represented by a red dot. Gene reliability is established by the number of bootstrap runs for which the gene remains significantly DE (75%). Blue dots represent the mean absolute log2FC for a given bootstrap run count. Dashed line: FC=1.5; dotted line: occurrence=75. The grey-shaded area includes reliable DEGs (FC>1.5) with occurrences ≥ 75. B) Number of reliably identified DEGs between NoNASH and NASH groups [men (blue), women (red) and all patients (yellow)].
Figure 6: Random forest models. (A, B) Classification power (AUC) of RF models. RF were
trained with a progressively reduced number of genes to identify an optimal subset of genes corresponding to the proposed signature, for men and women, established by the second step
19
of RFE strategy. Maximal AUC is indicated by a vertical dotted red line. (C) Number of genes composing men (blue), women (red) and all patients (yellow) RF-based signatures.
Figure 7: Principal component analysis. A PCA was run using gene expression values from
women patients included in learning cohort based on: (A) all genes expression values or (B) Swomen genes. The percentage of the global data variance explained by each component is indicated by X and Y axis labels (%var.). Each dot represents a patient [NoNASH (blue) or NASH (yellow)].
Figure 8: AUC values of signatures and single gene predictors. (A,B) AUC distribution of
RF models to predict women (left) and men (right) of the learning cohort in a cross-validation scheme. RF models learnt using respectively Swomen and Smen (red) were compared in each plot to RF models learnt using random signatures built from Gwomen (khaki), Gmen (green), Gall
(blue) and the full list of available genes (purple). Distribution means are represented as vertical dashed lines. (C,D) AUC of single gene predictors to predict NASH status of women (left) and men (right) patients of the learning cohort for each gene composing corresponding signatures (Swomen and Smen). Mean AUC reached by RF models learnt from corresponding signature in a cross-validation scheme are represented through a red horizontal dashed line.
20
BIBLIOGRAPHY
1. Younossi Z, Anstee QM, Marietti M, Hardy T, Henry L, Eslam M, George J, et al. Global burden of NAFLD and NASH: trends, predictions, risk factors and prevention. Nat Rev Gastroenterol Hepatol 2018;15:11-20.
2. Younossi ZM, Koenig AB, Abdelatif D, Fazel Y, Henry L, Wymer M. Global epidemiology of nonalcoholic fatty liver disease-Meta-analytic assessment of prevalence, incidence, and outcomes. Hepatology 2016;64:73-84.
3. Friedman SL, Neuschwander-Tetri BA, Rinella M, Sanyal AJ. Mechanisms of NAFLD development and therapeutic strategies. Nat Med 2018;24:908-922.
4. Argo CK, Northup PG, Al-Osaimi AM, Caldwell SH. Systematic review of risk factors for fibrosis progression in non-alcoholic steatohepatitis. J Hepatol 2009;51:371-379.
5. Singh S, Allen AM, Wang Z, Prokop LJ, Murad MH, Loomba R. Fibrosis progression in nonalcoholic fatty liver vs nonalcoholic steatohepatitis: a systematic review and meta-analysis of paired-biopsy studies. Clin Gastroenterol Hepatol 2015;13:643-654 e641-649; quiz e639-640.
6. Kleiner DE, Brunt EM, Wilson LA, Behling C, Guy C, Contos M, Cummings O, et al.
Association of Histologic Disease Activity With Progression of Nonalcoholic Fatty Liver Disease. JAMA Netw Open 2019;2:e1912565.
7. Angulo P, Kleiner DE, Dam-Larsen S, Adams LA, Bjornsson ES, Charatcharoenwitthaya P, Mills PR, et al. Liver Fibrosis, but No Other Histologic Features, Is Associated With Long-term Outcomes of Patients With Nonalcoholic Fatty Liver Disease. Gastroenterology 2015;149:389-397 e310.
8. Dulai PS, Singh S, Patel J, Soni M, Prokop LJ, Younossi Z, Sebastiani G, et al. Increased risk of mortality by fibrosis stage in nonalcoholic fatty liver disease: Systematic review and meta-analysis. Hepatology 2017;65:1557-1565.
9. Schuppan D, Surabattula R, Wang XY. Determinants of fibrosis progression and regression in NASH. J Hepatol 2018;68:238-250.
10. Moylan CA, Pang H, Dellinger A, Suzuki A, Garrett ME, Guy CD, Murphy SK, et al. Hepatic gene expression profiles differentiate presymptomatic patients with mild versus severe nonalcoholic fatty liver disease. Hepatology 2014;59:471-482.
11. Ahrens M, Ammerpohl O, von Schonfels W, Kolarova J, Bens S, Itzel T, Teufel A, et
al. DNA methylation analysis in nonalcoholic fatty liver disease suggests distinct disease-specific and remodeling signatures after bariatric surgery. Cell Metab 2013;18:296-302. 12. Lefebvre P, Lalloyer F, Bauge E, Pawlak M, Gheeraert C, Dehondt H, Vanhoutte J, et al. Interspecies NASH disease activity whole-genome profiling identifies a fibrogenic role of PPARalpha-regulated dermatopontin. JCI Insight 2017;2:92264.
13. Teufel A, Itzel T, Erhart W, Brosch M, Wang XY, Kim YO, von Schonfels W, et al. Comparison of Gene Expression Patterns Between Mouse Models of Nonalcoholic Fatty Liver Disease and Liver Tissues From Patients. Gastroenterology 2016;151:513-525 e510.
14. Hyotylainen T, Jerby L, Petaja EM, Mattila I, Jantti S, Auvinen P, Gastaldelli A, et al.
Genome-scale study reveals reduced metabolic adaptability in patients with non-alcoholic fatty liver disease. Nat Commun 2016;7:8994.
15. Suppli MP, Rigbolt KTG, Veidal SS, Heeboll S, Eriksen PL, Demant M, Bagger JI, et
al. Hepatic transcriptome signatures in patients with varying degrees of nonalcoholic fatty liver disease compared with healthy normal-weight individuals. Am J Physiol Gastrointest Liver Physiol 2019;316:G462-G472.
16. Haas JT, Vonghia L, Mogilenko DA, Verrijken A, Molendi-Coste O, Fleury S, Deprince
A, et al. Transcriptional network analysis implicates altered hepatic immune function in NASH development and resolution. Nature Metabolism 2019;1:604-614.
17. Ryaboshapkina M, Hammar M. Human hepatic gene expression signature of non-alcoholic fatty liver disease progression, a meta-analysis. Sci Rep 2017;7:12361.
18. Subichin M, Clanton J, Makuszewski M, Bohon A, Zografakis JG, Dan A. Liver disease in the morbidly obese: a review of 1000 consecutive patients undergoing weight loss surgery.
21 Surg Obes Relat Dis 2015;11:137-141.
19. Souto KP, Meinhardt NG, Ramos MJ, Ulbrich-Kulkzynski JM, Stein AT, Damin DC. Nonalcoholic fatty liver disease in patients with different baseline glucose status undergoing bariatric surgery: analysis of intraoperative liver biopsies and literature review. Surg Obes Relat Dis 2018;14:66-73.
20. Gershoni M, Pietrokovski S. The landscape of sex-differential transcriptome and its consequent selection in human adults. BMC Biol 2017;15:7.
21. Labonte B, Engmann O, Purushothaman I, Menard C, Wang J, Tan C, Scarpa JR, et al. Sex-specific transcriptional signatures in human depression. Nat Med 2017.
22. Lonardo A, Nascimbeni F, Ballestri S, Fairweather D, Win S, Than TA, Abdelmalek
MF, et al. Sex Differences in NAFLD: State of the Art and Identification of Research Gaps. Hepatology 2019.
23. Tramunt B, Smati S, Grandgeorge N, Lenfant F, Arnal JF, Montagner A, Gourdy P. Sex differences in metabolic regulation and diabetes susceptibility. Diabetologia 2020;63:453-461. 24. Ein-Dor L, Zuk O, Domany E. Thousands of samples are needed to generate a robust gene list for predicting outcome in cancer. Proc Natl Acad Sci U S A 2006;103:5923-5928. 25. Chibon F. Cancer gene expression signatures - the rise and fall? Eur J Cancer 2013;49:2000-2009.
26. Michiels S, Koscielny S, Hill C. Prediction of cancer outcome with microarrays: a multiple random validation strategy. Lancet 2005;365:488-492.
27. Liao JG, Chin KV. Logistic regression for disease classification using microarray data: model selection in a large p and small n case. Bioinformatics 2007;23:1945-1951.
28. Higgins JP. Nonlinear systems in medicine. Yale J Biol Med 2002;75:247-260.
29. Diaz-Uriarte R, Alvarez de Andres S. Gene selection and classification of microarray data using random forest. BMC Bioinformatics 2006;7:3.
30. Boulesteix A-L, Janitza S, Kruppa J, König IR. Overview of random forest methodology and practical guidance with emphasis on computational biology and bioinformatics. Wiley Interdisciplinary Reviews: Data Mining and Knowledge Discovery 2012;2:493-507.
31. Guyon I, Weston J, Barnhill S, Vapnik V. Gene Selection for Cancer Classification using Support Vector Machines. Machine Learning 2002;46:389-422.
32. Margerie D, Lefebvre P, Raverdy V, Schwahn U, Ruetten H, Larsen P, Duhamel A, et
al. Hepatic transcriptomic signatures of statin treatment are associated with impaired glucose homeostasis in severely obese patients. BMC Medical Genomics 2019;12.
33. Verrijken A, Francque S, Mertens I, Prawitt J, Caron S, Hubens G, Van ME, et al.
Prothrombotic factors in histologically proven nonalcoholic fatty liver disease and nonalcoholic steatohepatitis. Hepatology 2014;59:121-129.
34. Kleiner DE, Brunt EM, Van Natta M, Behling C, Contos MJ, Cummings OW, Ferrell LD, et al. Design and validation of a histological scoring system for nonalcoholic fatty liver disease. Hepatology 2005;41:1313-1321.
35. Wallace TM, Levy JC, Matthews DR. Use and abuse of HOMA modeling. Diabetes Care 2004;27:1487-1495.
36. Tang Q, Li X, Song P, Xu L. Optimal cut-off values for the homeostasis model assessment of insulin resistance (HOMA-IR) and pre-diabetes screening: Developments in research and prospects for the future. Drug Discov Ther 2015;9:380-385.
37. Diehl AM, Day C. Cause, Pathogenesis, and Treatment of Nonalcoholic Steatohepatitis. N Engl J Med 2017;377:2063-2072.
38. Morselli E, Frank AP, Santos RS, Fatima LA, Palmer BF, Clegg DJ. Sex and Gender: Critical Variables in Pre-Clinical and Clinical Medical Research. Cell Metab 2016;24:203-209. 39. Mauvais-Jarvis F. Sex differences in metabolic homeostasis, diabetes, and obesity. Biol Sex Differ 2015;6:14.
40. Lichanska AM, Waters MJ. How growth hormone controls growth, obesity and sexual dimorphism. Trends Genet 2008;24:41-47.
41. Hashimoto E, Tokushige K. Prevalence, gender, ethnic variations, and prognosis of NASH. J Gastroenterol 2011;46 Suppl 1:63-69.
22
42. Ballestri S, Nascimbeni F, Baldelli E, Marrazzo A, Romagnoli D, Lonardo A. NAFLD
as a Sexual Dimorphic Disease: Role of Gender and Reproductive Status in the Development and Progression of Nonalcoholic Fatty Liver Disease and Inherent Cardiovascular Risk. Adv Ther 2017;34:1291-1326.
43. Chen F, Jimenez RJ, Sharma K, Luu HY, Hsu BY, Ravindranathan A, Stohr BA, et al. Broad Distribution of Hepatocyte Proliferation in Liver Homeostasis and Regeneration. Cell Stem Cell 2019.
44. Mayo R, Crespo J, Martínez-Arranz I, Banales JM, Arias M, Mincholé I, Aller de la
Fuente R, et al. Metabolomic-based noninvasive serum test to diagnose nonalcoholic steatohepatitis: Results from discovery and validation cohorts. Hepatology Communications 2018.
45. Barr J, Caballeria J, Martinez-Arranz I, Dominguez-Diez A, Alonso C, Muntane J, Perez-Cormenzana M, et al. Obesity-dependent metabolic signatures associated with nonalcoholic fatty liver disease progression. J Proteome Res 2012;11:2521-2532.
46. Wood GC, Chu X, Argyropoulos G, Benotti P, Rolston D, Mirshahi T, Petrick A, et al. A multi-component classifier for nonalcoholic fatty liver disease (NAFLD) based on genomic, proteomic, and phenomic data domains. Scientific Reports 2017;7.
47. Jacobs SAH, Gart E, Vreeken D, Franx BAA, Wekking L, Verweij VGM, Worms N, et al. Sex-Specific Differences in Fat Storage, Development of Non-Alcoholic Fatty Liver Disease and Brain Structure in Juvenile HFD-Induced Obese Ldlr-/-.Leiden Mice. Nutrients 2019;11. 48. Ande SR, Nguyen KH, Gregoire Nyomba BL, Mishra S. Prohibitin-induced,
obesity-associated insulin resistance and accompanying low-grade inflammation causes NASH and HCC. Sci Rep 2016;6:23608.
49. Kurt Z, Barrere-Cain R, LaGuardia J, Mehrabian M, Pan C, Hui ST, Norheim F, et al. Tissue-specific pathways and networks underlying sexual dimorphism in non-alcoholic fatty liver disease. Biol Sex Differ 2018;9:46.
50. Friedman SL, Ratziu V, Harrison SA, Abdelmalek MF, Aithal GP, Caballeria J,
Francque S, et al. A randomized, placebo-controlled trial of cenicriviroc for treatment of nonalcoholic steatohepatitis with fibrosis. Hepatology 2018;67:1754-1767.
For Peer Review
Figure 1 - Vandel et al. 175x192mm (600 x 600 DPI) Hepatology 1 2 3 4 5 6 7 8 9 10 11 12 13 14 15 16 17 18 19 20 21 22 23 24 25 26 27 28 29 30 31 32 33 34 35 36 37 38 39 40 41 42 43 44 45 46 47 48 49 50 51 52 53 54 55 56 57 58 59 60
For Peer Review
Figure 2 - Vandel et al. 148x150mm (600 x 600 DPI) Hepatology 1 2 3 4 5 6 7 8 9 10 11 12 13 14 15 16 17 18 19 20 21 22 23 24 25 26 27 28 29 30 31 32 33 34 35 36 37 38 39 40 41 42 43 44 45 46 47 48 49 50 51 52 53 54 55 56 57 58 59 60
For Peer Review
Figure 3 - Vandel et al. 156x133mm (600 x 600 DPI) Hepatology 1 2 3 4 5 6 7 8 9 10 11 12 13 14 15 16 17 18 19 20 21 22 23 24 25 26 27 28 29 30 31 32 33 34 35 36 37 38 39 40 41 42 43 44 45 46 47 48 49 50 51 52 53 54 55 56 57 58 59 60
For Peer Review
Figure 4 - Vandel et al. 176x85mm (600 x 600 DPI) Hepatology 1 2 3 4 5 6 7 8 9 10 11 12 13 14 15 16 17 18 19 20 21 22 23 24 25 26 27 28 29 30 31 32 33 34 35 36 37 38 39 40 41 42 43 44 45 46 47 48 49 50 51 52 53 54 55 56 57 58 59 60
For Peer Review
Figure 5 - Vandel et al. 242x171mm (600 x 600 DPI) Hepatology 1 2 3 4 5 6 7 8 9 10 11 12 13 14 15 16 17 18 19 20 21 22 23 24 25 26 27 28 29 30 31 32 33 34 35 36 37 38 39 40 41 42 43 44 45 46 47 48 49 50 51 52 53 54 55 56 57 58 59 60
For Peer Review
Figure 6 - Vandel et al. 288x91mm (600 x 600 DPI) Hepatology 1 2 3 4 5 6 7 8 9 10 11 12 13 14 15 16 17 18 19 20 21 22 23 24 25 26 27 28 29 30 31 32 33 34 35 36 37 38 39 40 41 42 43 44 45 46 47 48 49 50 51 52 53 54 55 56 57 58 59 60For Peer Review
Figure 7 - Vandel et al. 142x256mm (600 x 600 DPI) Hepatology 1 2 3 4 5 6 7 8 9 10 11 12 13 14 15 16 17 18 19 20 21 22 23 24 25 26 27 28 29 30 31 32 33 34 35 36 37 38 39 40 41 42 43 44 45 46 47 48 49 50 51 52 53 54 55 56 57 58 59 60
For Peer Review
Figure 8 - Vandel et al. 188x177mm (600 x 600 DPI) Hepatology 1 2 3 4 5 6 7 8 9 10 11 12 13 14 15 16 17 18 19 20 21 22 23 24 25 26 27 28 29 30 31 32 33 34 35 36 37 38 39 40 41 42 43 44 45 46 47 48 49 50 51 52 53 54 55 56 57 58 59 60
For Peer Review
Vandel et al., HEP-20-0090 R1
Characteristics
Women (n; %) 110; 85% 300; 72% 44; 60% Age (mean±sd)
BMI (mean±sd) Body mass (kg)(mean±sd)
35.6±11 46.2±7 128.4±23 42.1±11 47.6±8 134.3±26 47.2±10 47.5±8 135.3±27 Steatosis grade (n; %) 0 118; 100% 0; 0% 0; 0% 1 0; 0% 310; 72% 18; 25% 2 0; 0% 86; 20% 28; 40% 3 0; 0% 35; 8% 25; 35% Lobular inflammation (n; %) 0 118; 100% 431; 100% 0; 0% 1 0; 0% 0; 0% 50; 70% 2 0; 0% 0; 0% 21; 30% Ballooning (n; %) 0 118; 100% 431; 100% 0; 0% 1 0; 0% 0; 0% 50; 70% 2 0; 0% 0; 0% 21; 30% Fibrosis (Kleiner) (n; %) 0 107; 87% 321; 74% 9; 12% 1a 4; 2% 21; 3% 9; 12% 1b 2; 1% 17; 1% 9; 12% 1c 5; 4% 44; 9% 4; 5% 2 0; 0% 13; 3% 12; 16% 3q 0; 0% 10; 2% 13; 18% 3s 0; 0% 4; 1% 13; 18% 4 0; 0% 0; 0% 5; 7%
AST (IU/L)(median; IQR) 21; 9 23; 9 38; 23 ALT (IU/L)(median; IQR) 20; 11 27; 16 47; 31 GGT (IU/L)(median; IQR) 25; 21 30 ;27 57; 44
Diabetes (n; %) Treated diabetes (n; %) Fasting blood glucose (mM)(mean±sd)
20; 16% 16; 12% 5.4±0.9 145; 35% 121; 29% 6.4±2.4 63; 86% 56; 77% 9.2±3.3
Fasting insulin (IU/mL)(median; IQR) 12.2; 8.3 13.7; 11.3 23.5; 25.8 HbA1c (%)(median; IQR) 5.5; 0.5 5.9; 0.9 7.8; 3.6
HOMA-IR (median; IQR) 2.9; 2.2 3.5; 3.2 9.3; 10.9 Total cholesterol (mmol/L)(mean±sd)
LDL cholesterol (mmol/L)(mean±sd) HDL cholesterol (mmol/L)(mean±sd) Triglycerides (mmol/L)(mean±sd) 4.9±1.0 3.1±0.9 1.2±0.2 1.3±0.5 5.0±1.0 3.1±0.8 1.1±0.3 1.7±1.7 4.8±1.0 2.8±0.9 1.1±0.2 2.1±1.0
Diastolic blood pressure (mmHg)(mean±sd) 72.6±14 77.1±14 76.6±13
Systolic blood pressure (mmHg)(mean±sd) 130.3±15 137.1±19 139.2±19
Table 1. Characteristics of NASH/NoNASH 620 patients from theHUL cohort.
HL NAFL NASH n=118 n=431 n=71 Hepatology 1 2 3 4 5 6 7 8 9 10 11 12 13 14 15 16 17 18 19 20 21 22 23 24 25 26 27 28 29 30 31 32 33 34 35 36 37 38 39 40 41 42 43 44 45 46 47 48 49 50 51 52 53 54 55 56 57 58 59 60
For Peer Review
Vandel et al., HEP-20-0090 R1
Men Women
NoNASH NASH NoNASH NASH
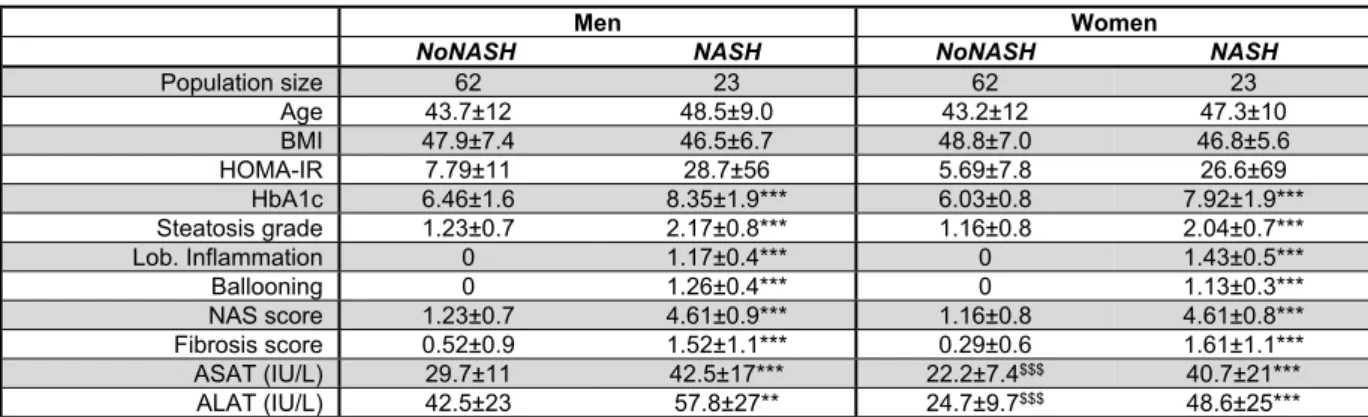
Population size 62 23 62 23 Age 43.7±12 48.5±9.0 43.2±12 47.3±10 BMI 47.9±7.4 46.5±6.7 48.8±7.0 46.8±5.6 HOMA-IR 7.79±11 28.7±56 5.69±7.8 26.6±69 HbA1c 6.46±1.6 8.35±1.9*** 6.03±0.8 7.92±1.9*** Steatosis grade 1.23±0.7 2.17±0.8*** 1.16±0.8 2.04±0.7*** Lob. Inflammation 0 1.17±0.4*** 0 1.43±0.5*** Ballooning 0 1.26±0.4*** 0 1.13±0.3*** NAS score 1.23±0.7 4.61±0.9*** 1.16±0.8 4.61±0.8*** Fibrosis score 0.52±0.9 1.52±1.1*** 0.29±0.6 1.61±1.1*** ASAT (IU/L) 29.7±11 42.5±17*** 22.2±7.4$$$ 40.7±21*** ALAT (IU/L) 42.5±23 57.8±27** 24.7±9.7$$$ 48.6±25***
Table 2: Main biometric and biochemical parameters of the learning cohort. Mean ±
standard deviation of clinical parameters for each patient category are indicated. (BMI: Body Mass Index; HOMA-IR: HOmeostasis Model Assessment of Insulin Resistance; HbA1c: glycated hemoglobin; NAS: NAFLD Activity Score; ALAT: Alanine transaminase; ASAT: Aspartate transaminase). NoNASH vs NASH comparison: **, p<0.05; ***, p<0.01. Women vs men comparison: $$$, p<0.01 Hepatology 1 2 3 4 5 6 7 8 9 10 11 12 13 14 15 16 17 18 19 20 21 22 23 24 25 26 27 28 29 30 31 32 33 34 35 36 37 38 39 40 41 42 43 44 45 46 47 48 49 50 51 52 53 54 55 56 57 58 59 60
For Peer Review
Vandel et al., HEP-20-0090 R1
Gmen n
(1325 genes) Gwomen (55 genes) Galll (1868 genes) Gene set
GO terms Rank p-value Rank p-value Rank p-value
Cell-cell adhesion 1 2.9x10⁻⁹*** ∅ ∅ 2 5.7x10⁻¹¹***
ATP hydrolysis coupled proton transport 2 4.3x10⁻⁷*** ∅ ∅ ∅ ∅
ER to Golgi vesicle-mediated transport 3 5.9x10⁻⁷*** ∅ ∅ 130 1.0x10⁻²
Reg. of cellular amino acid metabolic process 4 6.0x10⁻⁷*** ∅ ∅ ∅ ∅
Transferrin transport 5 1.3x10⁻⁶** ∅ ∅ ∅ ∅
Negative regulation of apoptotic process 6 2.2x10⁻⁶** ∅ ∅ 33 1.7x10⁻⁴*
Tumor necrosis factor-mediated signaling pathway 7 2.4x10⁻⁶** ∅ ∅ 38 3.5x10⁻⁴*
Regulation of macroautophagy 8 3.2x10⁻⁶** ∅ ∅ ∅ ∅
T cell receptor signaling pathway 9 4.1x10⁻⁶** ∅ ∅ 31 1.5x10⁻⁴*
NIK/NF-kappa-B signaling 10 4.3x10⁻⁶** ∅ ∅ 102 5.9x10⁻³
G1/S transition of mitotic cell cycle ∅ ∅ 1 1.6x10-4* 17 1.1x10⁻⁵**
Response to organonitrogen compound ∅ ∅ 2 6.3x10⁻⁴ ∅ ∅
Cell adhesion 50 1.1x10-3* 3 1.3x10⁻³ 5 4.2x10⁻⁸***
Triglyceride catabolic process ∅ ∅ 4 2.0x10⁻³ ∅ ∅
Negative reg. of G1/S transition of mitotic cell cycle ∅ ∅ 5 2.0x10⁻³ 172 2.2x10⁻²
Liver regeneration 111 1.0x10⁻² 6 2.7x10⁻³ 81 3.5x10⁻³
Response to drug 93 6.1x10⁻³ 7 8.8x10⁻³ 110 6.9x10⁻³
Cellular response to hydrogen peroxide 174 3.3x10⁻² 8 1.0x10⁻² 210 3.1x10⁻²
Intestinal epithelial cell maturation 161 2.4x10⁻² 9 1.1x10⁻² 241 4.4x10⁻²
Aggresome assembly ∅ ∅ 10 1.3x10⁻² ∅ ∅
Movement of cell or subcellular component 23 4.0x10⁻⁵** ∅ ∅ 1 3.7x10⁻¹¹***
Cell-cell adhesion 1 2.9x10⁻⁹*** ∅ ∅ 2 5.7x10⁻¹¹***
Leukocyte migration 30 1.4x10⁻⁴* ∅ ∅ 3 1.0x10⁻¹⁰***
Fc-gamma receptor signal. Pathway in phagocytosis 36 2.4x10⁻⁴* ∅ ∅ 4 5.6x10⁻⁹***
Cell adhesion 50 1.1x10-3* 3 1.3x10⁻³ 5 4.2x10⁻⁸***
Actin cytoskeleton organization 17 1.3x10⁻⁵** ∅ ∅ 6 1.3x10⁻⁷***
Leukocyte cell-cell adhesion 29 1.4x10⁻⁴* ∅ ∅ 7 5.2x10⁻⁷***
Regulation of cell shape 86 5.0x10⁻³ ∅ ∅ 8 8.1x10⁻⁷***
Inflammatory response 169 2.8x10⁻² ∅ ∅ 6 8.5x10⁻⁷***
Extracellular matrix organization 55 1.2x10⁻³* ∅ ∅ 10 8.7x10⁻⁷***
Table 3: Biological term enrichment. Top 10 enriched gene ontology terms for reliable DEGs
in NASH vs NoNASH men, women and all patients sub-cohorts. P-values and Benjamini-Hochberg FDR were computed using DAVID and the Biological Process Direct GO terms database, enrichments were ranked following p-values. Enrichments with corresponding FDR < 10%, 1% and 0.1% are tagged with *, ** and *** respectively.
Hepatology 1 2 3 4 5 6 7 8 9 10 11 12 13 14 15 16 17 18 19 20 21 22 23 24 25 26 27 28 29 30 31 32 33 34 35 36 37 38 39 40 41 42 43 44 45 46 47 48 49 50 51 52 53 54 55 56 57 58 59 60
For Peer Review
Vandel et al., HEP-20-0090 R1
Prediction of: Women Men All
by : Swomen en
Smen Sall Swomen
en
Smen Sall Swomen
en Smen Sall HUL 0.86 0.84 0.87 0.87 0.87 0.93 0.88 0.84 0.88 UZA 0.73 0.62 0.70 0.76 0.67 0.76 0.75 0.63 0.71 UZAHigh Fib. 0.82 0.69 0.78 0.83 0.71 0.84 0.82 0.69 0.79 UKD 0.90 0.87 0.93 0.83 0.83 0.83 0.89 0.88 0.91 DU ∅ ∅ ∅ ∅ ∅ ∅ 0.80 0.89 0.87
Table 4: AUC of RF models. The ability of signatures to classify women, men and all patients
of HUL, UZA, UZAHigh Fib. and UKD cohorts, and all patients of DU cohort as NASH or NoNASH was evaluated. For each classified population, RF models were learnt from Swomen,
Smen and Sall. A color gradient is used from low AUC (in red) to high AUC (in green) values.
Hepatology 1 2 3 4 5 6 7 8 9 10 11 12 13 14 15 16 17 18 19 20 21 22 23 24 25 26 27 28 29 30 31 32 33 34 35 36 37 38 39 40 41 42 43 44 45 46 47 48 49 50 51 52 53 54 55 56 57 58 59 60
For Peer Review
Vandel et al., HEP-20-0090 R1
Signature Smen Swomen Sall
Clinical parameter Correlation p-value Correlation p-value Correlation p-value
Age 0.275 3.3x10⁻⁴*** 0.153 1.1x10⁻³** 0.21 1.3x10⁻⁷*** BMI 0.002 9.7x10⁻¹ 0.110 1.9x10⁻² 0.065 1.0x10⁻¹ LDL-C -0.205 8.6x10⁻³ -0.069 1.4x10⁻¹ -0.098 1.5x10⁻² HDL-C -0.084 2.8x10⁻¹ -0.078 9.7x10⁻² -0.077 5.7x10⁻² Triglycerides 0.243 1.6x10⁻³** 0.205 1.1x10⁻⁵*** 0.272 5.7x10⁻¹²*** HbA1c 0.471 1.9x10⁻¹⁰*** 0.279 1.5x10⁻⁹*** 0.353 1.4x10⁻¹⁹*** HOMA- IR 0.423 1.8x10⁻⁸*** 0.307 3.2x10⁻¹¹*** 0.294 1.3x10⁻¹³*** ASAT 0.253 1.0x10⁻³** 0.312 1.2x10⁻¹¹*** 0.322 2.5x10⁻¹⁶*** ALAT 0.170 2.9x10⁻² 0.352 1.1x10⁻¹⁴*** 0.306 7.2x10⁻¹⁵***
Table 5: Correlation analysis. Correlation between prediction of RF models learnt from
reference signatures on the learning cohort and clinical parameters of the HUL cohort. Spearman correlation coefficient and corresponding p-value were computed in R. Bonferroni correction was applied to deal with multiple comparisons situation, p-values with corresponding FWER < 10%, 1% and 0.1% are tagged with *, ** and *** respectively.
Hepatology 1 2 3 4 5 6 7 8 9 10 11 12 13 14 15 16 17 18 19 20 21 22 23 24 25 26 27 28 29 30 31 32 33 34 35 36 37 38 39 40 41 42 43 44 45 46 47 48 49 50 51 52 53 54 55 56 57 58 59 60