HAL Id: halshs-00552245
https://halshs.archives-ouvertes.fr/halshs-00552245
Preprint submitted on 5 Jan 2011
HAL is a multi-disciplinary open access archive for the deposit and dissemination of sci-entific research documents, whether they are pub-lished or not. The documents may come from teaching and research institutions in France or abroad, or from public or private research centers.
L’archive ouverte pluridisciplinaire HAL, est destinée au dépôt et à la diffusion de documents scientifiques de niveau recherche, publiés ou non, émanant des établissements d’enseignement et de recherche français ou étrangers, des laboratoires publics ou privés.
Jean-Louis Combes, Christian Hubert Ebeke
To cite this version:
Jean-Louis Combes, Christian Hubert Ebeke. Remittances and Household Consumption Instability in Developing Countries. 2011. �halshs-00552245�
Document de travail de la série Etudes et Documents
E 2010.15
Remittances and Household Consumption Instability
in Developing Countries
Jean-Louis COMBES and Christian EBEKE1
Clermont Université, Université d’Auvergne, CERDI
1
Clermont Université, Université d’Auvergne, Centre d’Etudes et de Recherches sur le Développement International, F-63000 CLERMONT-FERRAND. CNRS, UMR 6587, CERDI, F-63009 CLERMONT-FERRAND.
Corresponding author: Christian_Hubert.Ebeke@u-clermont1.fr.
We would like to thank Lisa Chauvet and Yannick Lucotte for their useful suggestions on an earlier draft of this paper. We would also like to thank participants at the doctoral seminars at University of Paris 1 (FRANCE) in 2009 and at CSAE 2010 Conference on Development in Oxford (UK).
Summary. – This paper analyzes the impact of remittances on household consumption instability in developing countries on a large panel of developing countries. The four main results are the following: Firstly, remittances significantly reduce household consumption instability. Secondly, the insurance role played by remittances is highlighted: remittances dampen the effect of various sources of consumption instability in developing countries (natural disasters, agricultural shocks, discretionary fiscal policy). Thirdly, the insurance role played by remittances is more important in less financially developed countries. Fourthly, the overall stabilizing effect of remittances is mitigated when remittances over GDP exceed 8.5%.
JEL codes: D02, D64, F02, F22, F24
1. INTRODUCTION
The recent economic crisis has led policymakers and economists to rethink about the instruments for economic stabilization. One of the most damaging consequences of output shocks is the consumption instability which negatively affects risk adverse agents’ welfare. As pointed by Athahasoulis and van Wincoop (2000) and Pallage and Robes (2003), consumption instability could have detrimental consequences for the accumulation of human capital and physical capital.
Consumption instability is driven by a complex array of factors (Wolf, 2004): economic shocks, the determinants of the household income elasticity with respect to shocks (risk management mechanism) and the determinants of the household consumption elasticity with respect to household income (risk coping mechanism). Several characteristics of countries shape the consumption instability. Economic size plays a crucial role: large economies with diversified production structure are more immune to both sector-specific shocks and—reflecting the negative association between size and openness—to external shocks. Financial development opens new diversification opportunities and dampens consumption instability. The effect of shocks on macroeconomic instability depends on the extent to which participation in international goods and asset markets allows for specialization and for risk diversification. Fiscal policy can be used to offset shocks, and to smooth consumption, but large fiscal imbalances are also a factor of macroeconomic instability. Otherwise, fiscal policy instability might be linked to consumption instability through the connection between public and household budgets (Herrera and Vincent, 2008). Institutional factors, such as democracy, lower social instability and hence smooth consumption.
It is surprising to see that remittances are not present in the literature explaining consumption instability while several papers have recently analyzed the potential stabilizing impact of migrants' remittances (Chami et al, 2009; Bugamelli and Patterno, 2009; IMF, 2005 and World Bank, 2006). The literature focuses on the low procyclicality and perhaps on the contracyclicality of remittances with GDP. Unlike other private capital flows, remittances tend to be a hedge against shocks.
Two mechanisms through which remittances might affect household consumption instability could be put forward. Firstly, remittances might act as a risk management mechanism. For instance, the remittance-receiving households in Burkina Faso and Ghana have housing built of concrete rather than mud and have greater access to communications, and they are less prone to natural shocks. Moreover, Ethiopian remittance-receiving households rely more on cash reserves during food crisis episodes, than the sale of productive assets (Mohapatra et al. 2009). Altogether, remittances constitute a factor of resilience at the household level which in turn contributes to protect the productive capacity through ex ante investments and then smooth income and promote economic growth.
Secondly, remittances might reduce household consumption instability through their contribution to risk coping. According to Mohapatra et al. (2009), remittances rise when the recipient economy suffers a natural disaster. Yang (2008) also provides cross-country evidence on the response of international flows to hurricanes, and concludes that for poorer countries, increased hurricane exposure is associated with greater remittance flows as well as greater foreign aid. In contrast, other private flows (commercial lending, FDI, and portfolio investment), actually decline in response to hurricane exposure. Remittances might also act as a substitute for the low level of financial development: the marginal benefit of remittances received by households, increases with the low level of financial development (Giuliano and Ruiz-Arranz, 2009).
This paper tries to answer several questions concerning the contribution of remittances on household consumption instability. (i) Do remittances significantly reduce the level of household consumption instability? (ii) What is the main channel of the stabilizing effect: risk management or risk coping? (iii) What are the types of shocks that remittances insure against? (iv) Do the households’ financial constraints reinforce the stabilizing effect of remittances? (v) Is there a threshold level of remittances beyond which they increase macroeconomic instability?
A large cross-section panel of developing countries is built. To deal with the endogeneity of remittances, the System-GMM-IV allows to instrument remittances by their lagged value as well as two external instruments: the remittances ratio received by neighbors and the weighted GDP per capita of migrants’ host countries. We find firstly that remittances significantly reduce household consumption instability. Secondly, the insurance role played
by remittances is confirmed. Thirdly remittances appear to be a hedge against natural disasters, agricultural shocks and discretionary fiscal policy. Fourthly, remittances work better in the less financially developed countries. Fifthly when remittances are too high, their stabilizing impact on consumption is weakened.
The rest of the article is organized as follow. Section 2 is devoted to the empirical investigation of the relationship between remittances and household consumption instability. We construct an econometric model for this relationship, present the data, the estimations and discuss the preliminary results obtained. In Section 3, the hypothesis of the insurance role played by remittances when households faced various types of shocks is tested. The issue of threshold effects on the impact of remittances on consumption instability is addressed in section 4. Concluding remarks are presented in section 5.
2. DO AND HOW REMITTANCES REDUCE HOUSEHOLD
CONSUMPTION INSTABILITY?
(a) The econometric model
The following dynamic panel model which allows catching the impact of remittances on consumption instability is estimated:
τ τ τ τ τ τ
α
ρσ
β
φ
ν
η
ε
σ
, = i, 1 i, 1 i, i i, c c i + − +X′ + R + + + (1) c iτσ
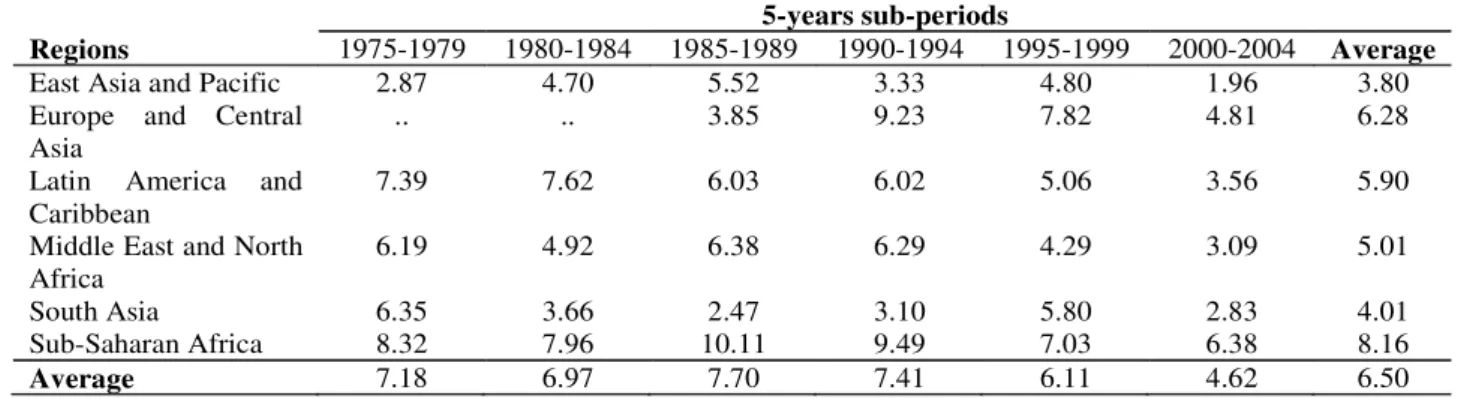
, , is the standard deviation of the consumption growth rate estimated over 5 years. Table 1 in Appendix 1 presents the evolution of consumption instability. Sub-Saharan Africa is most affected by the consumption instability. Moreover, from 1980-1985 to 2000-2004, a declining trend of consumption instability can be observed.Table 1
i ,
τ
are respectively the country and the non-overlapping 5-year period.ν
i andη
τare respectively the country and period fixed effects. The former is included to control for time invariant heterogeneity and the later is included to control for common shocks at each period among countries in the sample.
ε
is the idiosyncratic error term. It is worth noting thatestimation using panel data allows exploiting the time series nature of the relationship between remittances and consumption instability. Since the magnitude of remittance flows has changed substantially over time, this is an important advantage. The data are organized into a panel consisting of at most 89 countries over the period 1975–2004. The data are averaged over non-overlapping five-year periods so that – data permitting – there are six observations per country (1975-1979, 1980–1984, 1985–1989, 1990–1994, 1995–1999, and 2000–2004).
R is the remittances variable measured as the ratio of remittances to GDP. X is a matrix of control variables which includes:1
• Per capita income: consumption instability is expected to be lower in more developed countries (Auffret 2003; Bekaert et al., 2006). We include the logarithmic term of GDP per capita at the beginning of each period.
• Financial development: The degree of consumption smoothing could depend on the depth and on the efficiency of financial markets (Bekaert et al, 2006; Ahmed and Suardi, 2009). The ratio of credit provided by the banks to the private sector over GDP is considered to catch the intensity of financial constraints.
• Trade and financial openness: The literature on trade openness and macroeconomic instability likewise combines theoretical ambiguity with varied empirical findings. Enhanced real integration can lead to greater sectorial specialization but also provides greater diversification across demand sources (Di Giovanni and Levchenko, 2009). On the one hand financial openness increases the degree of exposure to world financial crises. On the other hand, financial openness offers new portfolio diversification opportunities. Trade openness is measured as the ratio of exports and imports of goods and services to GDP. Financial openness is measured as the Chinn-Ito index rescaled to obtain only positive values. This index is introduced in a quadratic form to catch a threshold effect (Kose et al., 2003).
• Country size: Smaller economies are expected to suffer from higher consumption instability than larger economies. Moreover, smaller economies are less able to take advantage of economies of scale because their production is not diversified. Country size is measured by the logarithmic term of total population.
• Democracy: Democracies not only set policies through consensus, but also allow greater decision-making diversification, hence leading to economic stability. In addition, democratic institutions may result in more macroeconomic stability through political competition: the risk-averse voters punish incumbent governments for economic instability. It is also plausible that democracies induce greater willingness to cooperate and to compromise in the political sphere, generating greater stability as a result. These theoretical arguments of a negative relationship between democracy and instability are supported by empirical studies (Acemoglu et al., 2003; Mobarak, 2005 and Yang, 2008).
• The discretionary fiscal policy: Fatas and Mihov (2003) have shown that discretionary fiscal policy is an important factor of output instability. The notion of discretionary fiscal policy refers to changes in fiscal policy that do not represent reaction to economic conditions. Discretionary fiscal policy is associated with large household consumption instability given the interconnections between household consumption and public budget (Herrera and Vincent, 2008; Ahmed and Suardi, 2009). Fiscal policy instability2 is measured as the standard deviation of the residual component of the log difference of government consumption from an econometric model of the former over the log difference of GDP growth, a time trend and inflation in a quadratic form (Fatas and Mihov, 2003). 3
• Foreign aid: Foreign aid may contribute to enhance the risk management mechanism. Moreover, the countercyclical aid plays an insurance role. Aid is measured as the ratio between official development assistance to GDP.
• Lagged level of consumption instability: This variable catches the strong inertia which characterizes the dynamic of household consumption instability.
If remittances increase when the recipient economy experiences a bad shock, estimation of
φ
1 by the Ordinary Least Squares Estimator (OLS) is biased upward: the true impact of remittances on consumption instability will be underestimated. Moreover, the OLS estimator is inconsistent since the lagged dependent variable is positively correlated with the error term due to the presence of fixed effects. Hence an econometric strategy based on instrumental variables must be implemented. The equation in levels and the equation in first differences are combined in a system and estimated with an extended GMM estimator system which allows for the use of lagged differences and lagged levels of the explanatory variablesas instruments (Blundell and Bond, 1998).4 The GMM estimations control for the endogeneity of the remittances and other explanatory variables.5
Two external instruments are added: the ratio of remittances to GDP of all other recipient countries located in the same region and the log weighted GDP per capita for each of the migrant host countries (Aggarwal et al, 2006; Acosta et al., 2009).6 External instruments weaken the potential “weak instruments” problem that often arises in the context of traditional GMM estimation.
Two specification tests check the validity of the instruments. The first is the standard Sargan/Hansen test of over-identifying restrictions. The second test examines the hypothesis that there is no second-order serial correlation in the first-differenced residuals.
(b) The preliminary results
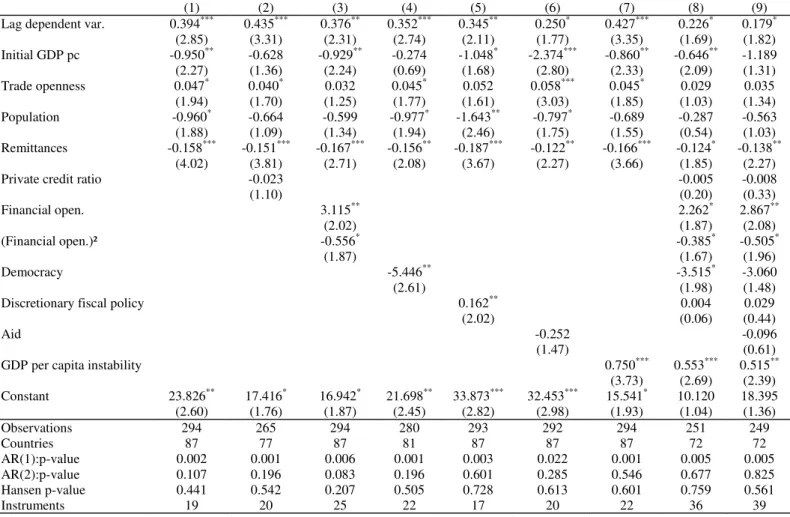
The results are presented in Table 3. The baseline model (column 1) includes lagged value of dependent variable, trade openness, population and migrants’ remittances. As expected, the remittances significantly reduce household consumption instability. Trade openness and lagged dependent variable amplify consumption instability. In contrast, per capita income and population impact negatively and significantly the consumption instability.
Table 3
The next step consists of adding a battery of control variables in order to check the robustness of these results to changes in model specifications (see columns 2-9): financial development, financial openness, democracy, discretionary fiscal policy, foreign aid, GDP per capita instability. Whatever the controls introduced, the coefficient of migrants’ remittances remains strongly significant and negative. As in Kose et al. (2003), financial openness is related to consumption instability in an inverted U relationship: the benefits of financial integration only appear beyond a given threshold (column 3). Democracy is negatively associated with instability (column 4). Discretionary fiscal policy is a factor amplifying household consumption volatility (column 5). GDP per capita instability is a significant source of consumption instability (columns 7, 8 and 9).
If remittances contribute to preserve the productive capacity through ex ante investments (risk management), then one can expect a stabilizing impact of remittances on
domestic production. We then introduce the GDP per capita instability to check whether the stabilizing impact of remittances on consumption is driven by the risk management channel. If this works, the coefficient of remittances should be no longer significant when the GDP instability is already controlled for. The second channel through which remittances might stabilize household consumption is their contribution on risk coping, i.e. the insurance role of transfers during shock episodes. The residual impact of the remittances after controlling for GDP instability will capture the risk coping mechanism induced by remittances. In other words, without controlling for GDP instability (columns 1 to 6), risk coping and risk management mechanisms go through the remittances variable. After controlling for GDP instability (columns 7, 8 and 9), only risk coping is caught by the remittances variable since GDP instability depends on risk management strategies. Hence the comparison between the two specifications allows distinguishing the two mechanisms. It appears that when we add GDP per capita instability in the benchmark specification (column 1), the coefficient of remittances remains robustly significant and hardly changes (columns 7, 8 and 9). Hence the contribution of remittances on risk management seems negligible. We will explore in more detail, the role of migrants’ remittances as risk coping mechanism in the next sub-sections.
(c) Alternative specifications related to the risk coping mechanism
To test the contribution of remittances on risk coping, two alternative models can be run. The first one consists of a model including a multiplicative term of remittances crossed with the GDP per capita instability:
(
τ τ)
τ τ τ τ τ τ τα
ρσ
φ
φ
σ
δσ
β
ν
η
ε
σ
, = , 1 1 , 2 , , i, i, i i, y i y i i i c c i + − + R + R × + + X′ + + + (2)where
σ
yi,τ is the standard deviation of GDP per capita growth over each sub-period. The hypothesis is thatφ
2<0 so that remittances reduce the response of household instability (δ +φ2Ri,τ) to macroeconomic shocks.An alternative strategy is to calculate a new dependent variable as the ratio of consumption instability to GDP per capita instability.7 An increase in this ratio means an inability of households to cope with shocks. The following model is estimated:8
τ τ τ τ τ τ
ε
η
ν
β
φ
α
σ
σ
, , , 1 , , = i i i i i y c i X R + ′ + + + + (3)The results of the estimation are presented in Table 4. Column 1-2 indicate the results of the estimation of model (2) while columns 3-7 present the results of model (3). Regarding columns 1 and 2, we notice that the coefficient associated to the interaction between remittances and the GDP per capita instability is significant and negative while the GDP instability, introduced additively, is positively related to consumption instability. Moreover, the coefficients of the remittances and of the interactive term are jointly significant. Remittances dampen significantly the effects of GDP instability on consumption instability. The threshold level of remittances is evaluated at 20% of GDP in column 1 and 16% in column 2 when foreign aid is included. Then, when the remittances are above these values, the full stabilization of aggregated shocks is observed. Nevertheless, it is not surprising to observe that this full insurance concerns only a very limited number of countries.
In columns 3-7, remittances impact negatively the ratio of consumption instability to GDP instability: remittances increase the ability to cope with shocks. Whatever the control variables included, the coefficient of remittances remains significant and negative. When we look at the effects of control variables introduced we see that the ability to cope with shocks increases with the economic development, the financial development, the foreign aid, the democracy and the financial openness. Instead the trade openness and the dependency ratio play in the opposite direction.
Table 4
In short remittances appear to be a robustly effective risk coping mechanism in developing countries. The next step is to test the hypothesis that the insurance role played by remittances is larger in less financially developed countries.
(d) Potential heterogeneity: Do remittances insure more in less financially developed
countries?
The first estimated model is the following:
(
τ τ)
τ τ τ τ ττ
τ
α
ρσ
φ
φ
δ
β
ν
η
ε
σ
ic, = + ci,−1+ 1Ri, + 2 Ri, ×FDi, + FDi, +Xi′, + i + + i, (4)where FD represents the ratio of bank credit to GDP, a proxy of the level of financial development and X ′ is the vector of control variables including GDP per capita growth instability. Our hypothesis is that
φ
1 <0 andφ
2 >0 so the impact of migrants’ remittancesτ
φ
φ
1+ 2FDi, is more stabilizing at low levels of financial development. 9Moreover, when
φ
1and
φ
2 have opposite signs, a threshold effect arises:2 1 * , , 2 1 , , 0
φ
φ
φ
φ
σ
τ τ τ τ − = < ⇔ < + = ∂ ∂ FD FD FD Ri i i i c .The results are presented in Table 5. We begin with a benchmark specification in which the controls are the lagged value of dependent variable, the logarithm of initial GDP per capita, the logarithm of the population, democracy, trade and the discretionary fiscal policy (column 1). The coefficient associated with remittances is negative and significant. The coefficient of the interactive term is positive and significant. The test of the joint significance of the two coefficients rejects the hypothesis that the two coefficients are statistically non significant. Then remittances work better in less financially developed countries. The threshold of private credit ratio is evaluated at 44% of GDP and 65 countries (90% of the sample) are located in the area of an overall stabilizing impact of remittances on consumption. We successfully test the robustness of this result by including in the model additional control variables: financial openness and foreign aid (columns 2-4). From columns 2 to 4, the threshold of financial development (the private credit ratio) is around 33% of GDP. Indeed, 60 countries (80% of the sample) experience a robust and negative association between remittances and household consumption instability given their levels of financial development under the estimated threshold
Table 5
An alternative way to test the insurance role played by remittances depending on the level of financial development is to use, as previously, the ratio of consumption instability to GDP instability as the dependent variable. The interactive term of remittances with the level of financial development allows catching the decreasing marginal stabilizing impact of remittances with the level of financial development. Hence, the coefficient associated with this variable will be positive while the coefficient of remittances introduced additively will be negative. The following equation is estimated:
(
τ τ)
τ τ τ τ τ τ τα
φ
φ
δ
β
ν
η
ε
σ
σ
, , , , , 2 , 1 , , = i i i i i i i i y c i X FD FD R R + × + + ′ + + + + (5)The hypothesis is that
φ
1<0 andφ
2 >0 so that the impact of migrants’ remittances (φ
1+φ
2FDi,τ) is more negative, i.e. more stabilizing, at low levels of financial development.The results are presented in Table 6. The matrix of control variables here includes the control variables used before.
Table 6
In column 1, as expected, the coefficient of the interaction between remittances and private credit ratio is positive while the coefficient of remittances and private credit ratio is both statistically significant and negative. Moreover, the coefficients associated with remittances and with the interactive term are jointly significant. So the contribution of remittances to the ability to cope with macroeconomic risk increases with the shallowness of the domestic financial market. The threshold of the private credit ratio is 34% and hence remittances smooth consumption in 87% of the countries.10
An alternative model with rolling estimations for different values taken by the ratio of private credit is implemented. A new variable dFD in interaction with the remittances variable is added in equation 4. dFD is equal to 1 if the country has a value of private credit ratio greater than FD* and 0 otherwise. This methodology for threshold determination in the case of endogenous regressors in a System-GMM framework has been previously implemented by Masten et al. (2008) and Chami et al. (2009).11 The following equation is specified:
(
τ)
τ τ τ τ τ τ τε
η
ν
β
δ
φ
φ
α
σ
σ
, , , , 2 , 1 , , = i i FD i i i i i y c i X FD d R R + × + + ′ + + + + (6) with dFD =1[
FD≥FD*]
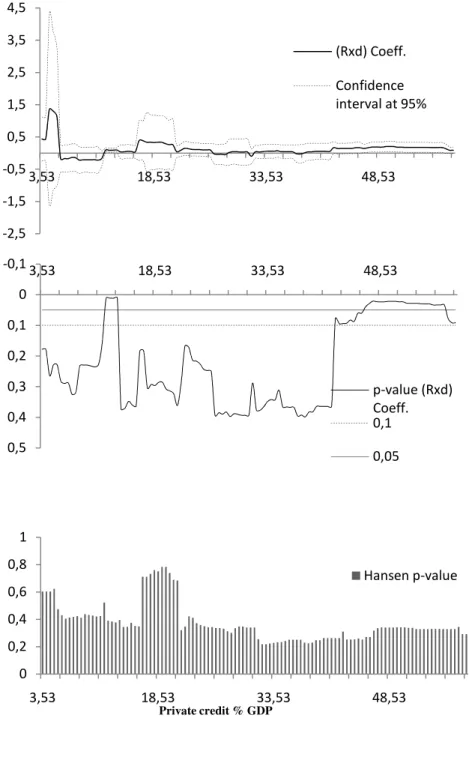
5% of the sample is left on both sides of the private credit ratio scan interval to control for outliers. Private credit cutoffs from 0.5 to 0.5 percent of the private credit ratio to GDP are explored. The test for no nonlinear effect refers simply to the test of the null hypothesis that the coefficient on the interactive variable
φ
2 is equal to zero. The results of simulations are presented in Figure 1 in Appendix. The first graph shows the evolution of the coefficientφ
2(the confidence interval of the coefficient at 95% is added in dot lines) and the second graph presents the statistical significance of the coefficient.
Figure 1
2
φ
is positive in several cases. Several observations can be identified as possible thresholds given their statistical significance at 5%. The first threshold range is located between 12% and 13.5% of private credit ratio and the second between 46.5% and 57.5%. The optimal cutoff which minimizes the Hansen test statistic is a level of private credit ratio equal to 13.5%. The corresponding estimation is shown in Table 7. All the diagnostic tests associated with the System-GMM estimator validate the specification. An increase in private credit and foreign aid improves the ability of households to smooth consumption.Table 7
Hence, the enhancing role of migrants’ remittances on the ability of households to smooth consumption is effective up to this threshold (53% of countries). This value of the private credit ratio threshold is however different to that estimated from the model (5) in which we found a value around 34-36%. This difference arises from the fact that the rolling estimations allows for a determination of an optimal threshold identified among a wide range of potential thresholds. So, this result is preferred to the previous one.
While the result of a reinforced stabilizing effect of remittances in less financially developed countries is intuitive, the opposite (remittances appears to lead to an instability of consumption in high financially developed countries) is more striking. One plausible explanation is that remittances are not invested on risk management mechanisms (diversification strategies) in high financially developed countries. Another explanation is that remittances might appear to be strongly procyclical in high financially developed countries and so exacerbate business cycles and thus fuel consumption instability. Indeed when the country is financially developed and thus insurance products are available for private entities, the level of countercyclical remittances is then reduced while procyclical remittances increase.
3. WHAT SHOCKS ARE MITIGATED BY REMITTANCES?
The following equation is estimated to test the hypothesis that remittances insure differently against natural disaster, agricultural and discretionary fiscal policy shocks (Sh):
(
τ τ)
τ τ τ τ ττ
τ
α
ρσ
φ
φ
δ
β
ν
η
ε
Natural disaster data are drawn from Center for Research on the Epidemiology of Diseases (CRED), International Emergency Disasters Database (EM-DAT).12 CRED defines a disaster as a natural situation or event which overwhelms local capacity, necessitating a request for external assistance (Noy, 2009; EM-DAT Glossary of terms).13 We consider all disaster events taken together within a country in a year rather than each of them examined separately. Indeed different regions in a country can be affected by different types of disasters in a given year and since remittances data is available only at annual frequency and at the country level, we would not be able to separate the response of remittances for a specific disaster (Mohapatra et al., 2009). The reported measure of the total number of people affected is used. The number of people affected is divided by the total population in the year prior to the disaster year (Noy, 2009; Mohapatra et al., 2009).
The hypothesis is that
φ
2 <0: the impact of migrants’ remittances (φ
1+φ
2Shi,τ) ismore negative, i.e. stabilizing, at high levels of shocks. Put differently, the equation will help to appreciate how remittances reduce the sensitivity
δ
+φ
2Ri,τ of consumption instability withrespect to each type of shock. Moreover, it allows computation of the remittances level which fully stabilizes each type of shock. The results are presented in Table 8. The variables of interest are the interactions between remittances and different shock variables.
Table 8
The coefficients associated with the interaction terms are highly significant and also negative while the shocks variables introduced additively are positively related to consumption instability. Moreover, whatever the specifications, the coefficients of the remittances and of the interactive terms are jointly significant. In column 1, the results suggest that remittances dampen significantly the effects of natural disasters on consumption instability. When the ratio of remittances is equal to 3%, a full stabilizing impact of remittances is observed.
In column 2, natural disasters are replaced by agricultural shocks measured as the instability of the agricultural value added over GDP. Remittances are really a hedge against agricultural shocks and fully stabilize these shocks when the ratio is equal to 10%.
Column 3 presents the result of the estimation including the interaction between remittances and fiscal policy shocks. It appears that remittances insure households against the
discretionary fiscal policy: the coefficient associated to the interaction term of remittances with the discretionary fiscal policy variable is strongly significant and negative. The value of remittances which fully insure discretionary fiscal policy is around 9%.
Altogether, these three results suggest that remittances appear to be a hedge at the household level against various types of shock. However, it appears that the level of remittances needed to fully offset the effects of each of these shocks is much lower in the case of natural disasters (3%) than in the two other types of shock (agricultural instability and discretionary fiscal policy). A relatively small amount of remittances is needed to offset the consequences of natural disasters. A possible explanation is that foreign aid may be a substitute for remittances in countries affected by natural disaster. It is more difficult to assess evidence that foreign aid reacts positively to discretionary fiscal policy.
4. IS THERE A THRESHOLD EFFECT IN THE RELATIONSHIP
BETWEEN REMITTANCES AND CONSUMPTION INSTABILITY?
There is some evidence that the macroeconomic effects of remittances in the recipient economies may depend on the size of remittance flows (Abdih et al., 2008, Chami et al., 2008 and Chami et al, 2009). Several explanations are proposed. Chami et al. (2008), using a stochastic dynamic general equilibrium model with endogenous labor supply, show that a high level of remittance-to- GDP ratio may actually enhance output instability due to the negative impact of these flows on the labor supply of remittance-dependent households. High levels of remittance-to-GDP may actually lead to higher levels of corruption (Abdih et al., 2008). The countries which over long periods receive high remittances do not undertake reforms that diversify the economy and make it less sensitive to shocks. A high value of remittances may translate into an appreciation of the real exchange rate (Dutch disease effect).14 We test the hypothesis of a threshold for remittances beyond which their impact on consumption instability could be weakened.
Several approaches can be followed to determine the relevant threshold of remittances. One can allow for a quadratic term of remittances in the consumption instability equation. The drawback of this approach is that the functional form is not necessarily “true”. A second approach may consist in ad hoc thresholds in remittances values, but it is not relevant. A third approach can consist in an endogenously determined threshold with the Hansen methodology.
But the principal assumption is the exogeneity of the threshold variable. Remittances are not exogenous. We then need a methodology which can be compatible with the instrumental strategy. Our approach, similar to Masten et al. (2008) and Chami et al. (2009), is based on rolling estimations for different values taken by the threshold variable. More precisely, we add in equation 1, a variable dr in interaction with the remittances variable. dr is equal to 1 if the country has a value of remittances greater than R* and 0 otherwise. The following equation is specified:
(
τ)
τ τ τ τ τ τα
ρσ
β
φ
φ
ν
η
ε
σ
i i i i r i i c c i = + ,−1+X′ + 1R + 2 R ×d + + + (8) with, dr =1[
R≥R*]
5% of the sample is left on both sides of the remittances scan interval to control for outliers. Remittance cutoffs from 0.5 to 0.5 percent of the remittances ratio are explored. The hypothesis that the coefficient on the interactive variable is equal to zero is rejected. Each equation corresponding to a different threshold is estimated by the System-GMM method. The results are presented in Figure 2. The first graph shows the evolution of the coefficient
φ
2of the multiplicative term, the second graph presents the statistical significance of the coefficient and the third box shows the Hansen p-value associated with each of estimation.
Figure 2
If we take only those for which the p-value is less than 5%, two ratios of remittances can be selected: 6% and 8.5%. The optimal value of the remittances ratio is 8.5% which minimizes the Hansen statistic. Table 9 presents the estimation of the model on the basis of the threshold endogenously determined.
Table 9
When remittances exceed 8.5% of GDP (13 countries, 18% of the sample), the marginal stabilizing impact becomes weaker (column 1). Comparing to the 2% threshold computed by Chami et al. (2009) from an equation of output instability, the results suggest a high value of remittances at which a much weaker stabilizing effect on consumption is observed. The permanent income hypothesis which puts forward the fact that consumption is less volatile than income can provide an explanation. Then, remittances need to be very high
to lead to instability of consumption while much lower amount of remittances is sufficient to generate GDP instability.
In column 2, the instability of GDP per capita is included in the model to highlight one possible origin of this non linearity. Indeed large remittances could enhance GDP instability, especially when the absorption capacity is low (Chami et al., 2009). It appears that the significance of the coefficients of the two remittances variables is lower than in column 1 and these results don’t invalidate the former intuition.
5. CONCLUDING REMARKS
This paper has analyzed the relationship between migrants’ remittances and household consumption instability. Using a large sample of developing countries over the period 1975-2004 and after controlling for endogeneity of remittances, the econometric results suggest that remittance-recipient countries exhibit low instability of their household consumption. Remittances play an insurance role that is strengthened when the country is characterized by a low level of financial development. Remittances appear then to be a hedge against the GDP instability and more particularly against natural disaster, agricultural shocks and fiscal policy shocks. Finally, the insurance role of remittances is weakened when they exceed 8.5% of GDP.
Given the stabilizing role of remittances on household consumption, the international community needs to take efforts to reduce the current high transaction costs of remitting money to labor-exporting countries. At present, high transaction costs resulting from lack of competition, regulation, and/or low levels of financial sector performance in labor-exporting countries act as a type of regressive tax on international migrants, who often tend to be poor and to remit small amounts of money with each remittance transaction. Lowering the transaction cost of remittances would help to increase the economic welfare-increasing impact of international remittances.
This paper also highlights the schizophrenia of remittances. Indeed, remittances inflows are stabilizing on average for all recipients, but the stabilizing effects of remittance inflows appear to be achieved rather quickly when the remittances ratio is less than 8.5% and to weaken when inflows exceed this threshold due to the positive effect on output instability.
Countries receiving large remittance inflows may need to devise appropriate policies to deal with their possible negative consequences. Financial development should be enhanced not only to favor the inflows of remittances but also to effectively channel remittances into investment opportunities in high remittance-dependent countries. The negative effects of remittances for example through a real exchange rate appreciation in highly dependent countries emerge from the fact that in most cases, remittances are consumed, in particular on non-tradable goods and services. If such funds were otherwise channeled through investment, the real exchange rate appreciation and macroeconomic instability would attenuate or even disappear. Such attenuation is dependent upon the level of financial development in the recipient country (Acosta et al., 2009).
REFERENCES
Abdih, Y., Dagher, J., Chami, R., & Montiel, P. (2008). Remittances and institutions: Are remittances
a curse?, IMF Working Papers 08/29, International Monetary Fund.
Acemoglu, D., Johnson, S., Robinson, J., & Thaicharoen, Y. (2003). Institutional causes, macroeconomic symptoms: volatility, crises and growth, Journal of Monetary Economics, 50(1), 49-123.
Acosta, P. A., Baerg, N. R., & Mandelman, F. S. (2009). Financial development, remittances, and real exchange rate appreciation, Economic Review, 1-12.
Agénor, P., McDermott, C., & Prasad, E. (2000). Macroeconomic fluctuations in developing countries: Some stylized facts, The World Bank Economic Review, 14(2), 251-285.
Ahmed, A. & Suardi, S. (2009). Macroeconomic Volatility, Trade and Financial Liberalization in Africa, World Development, 37(10), 1623-1636.
Amuedo-Dorantes, C., & Pozo, S. (2004). Workers' remittances and the real exchange rate: a paradox of gifts, World Development, 32(8), 1407-1417.
Arellano, M., & Bond, S. (1991). Some tests of specification for panel data: Monte Carlo evidence and an application to employment equations, The Review of Economic Studies, 277-297.
Athanasoulis, S., & Van Wincoop, E. (2000). Growth uncertainty and risk sharing, Journal of
Monetary Economics, 45(3), 477-505.
Auffret, P. (2003). High consumption volatility: the impact of natural disasters?, Policy Research Working Paper Series 2962, The World Bank.
Bekaert, G., Harvey, C., & Lundblad, C. (2006). Growth volatility and financial liberalization, Journal
of International Money and Finance, 25(3), 370-403.
Blundell, R., & Bond, S. (1998). Initial conditions and moment restrictions in dynamic panel data models, Journal of econometrics, 87(1), 115-143.
Bourdet, Y., & Falck, H. (2006). Emigrants' remittances and Dutch Disease in Cape Verde,
International Economic Journal, 20(3), 267-284.
Bugamelli, M., & Paternò, F. (2009). Do workers' remittances reduce the probability of current account reversals?, World Development, 37(12), 1821-1838.
Chami, R., Gapen, M., Barajas, A., Montiel, P., Cosimano, T., & Fullenkamp, C. (2008). Macroeconomic Consequences of Remittances, IMF Occasional Paper 259, (1), 1-92.
Chami, R., Hakura, D., & Montiel, P. (2009). Remittances: An automatic output stabilizer?, IMF Working Paper No. 09/91.
Chinn, M., & Ito, H. (2008). A new measure of financial openness, Journal of Comparative Policy
Analysis: Research and Practice, 10(3), 309-322.
Di Giovanni, J., & Levchenko, A. (2009). Trade openness and volatility, The Review of Economics
Fatas, A., & Mihov, I. (2003). The Case for Restricting Fiscal Policy Discretion, Quarterly Journal of
Economics, 118(4), 1419-1447.
Giuliano, P., & Ruiz-Arranz, M. (2009). Remittances, financial development, and growth, Journal of
Development Economics, 90(1), 144-152.
Herrera, S., & Vincent, B. (2008). Public expenditure and consumption volatility, Policy Research Working Paper Series 4633, The World Bank.
IMF. (2005). World Economic Outlook, April 2005: Globalization and External Imbalances chap. Two Current Issues Facing Developing Countries, International Monetary Fund.
Kose, M., Prasad, E., & Terrones, M. (2003). Financial integration and macroeconomic volatility, IMF
Staff Papers, 50, 119-142.
Lartey, E. K., Mandelman, F. S., & Acosta, P. A. (2008). Remittances, exchange rate regimes, and the
dutch disease: a panel data analysis, Working Paper 2008-12, Federal Reserve Bank of Atlanta. Masten, A. B., Coricelli, F., & Masten, I. (2008). Non-linear growth effects of financial development: Does financial integration matter?, Journal of International Money and Finance, 27(2), 295-313. Mobarak, A. M. (2005). Democracy, volatility, and economic development, The Review of Economics
and Statistics, 87(2), 348-361.
Mohapatra, S., Joseph, G., & Ratha, D. (2009). Remittances and natural disasters: ex-post response
and contribution to ex-ante preparedness, Policy Research Working Paper Series 4972, The World Bank.
Pallage, S., & Robe, M. (2003). On the welfare cost of economic fluctuations in developing countries,
International Economic Review, 44(2), 677-698.
Windmeijer, F. (2005). A finite sample correction for the variance of linear efficient two-step GMM estimators, Journal of econometrics, 126(1), 25-51.
Wolf, H. (2004). Accounting for Consumption Volatility Differences, IMF Staff Papers, 51, 109-126. World Bank. (2006). Development Impact of Workers' Remittances in Latin America, Vol. 2: Detailed Findings, Report No. 37026, World Bank.
Yang, B. (2008). Does democracy lower growth volatility? A dynamic panel analysis, Journal of
Macroeconomics, 30(1), 562-574.
Yang, D. (2008). Coping with disaster: The impact of hurricanes on international financial flows, 1970-2002, Advances in Economic Analysis & Policy, 8(1), 1903-1903.
APPENDIX 1: DESCRIPTIVE STATISTICS AND RESULTS OF ESTIMATIONS
Table 1: Household consumption instability in developing countries
5-years sub-periods
Regions 1975-1979 1980-1984 1985-1989 1990-1994 1995-1999 2000-2004 Average
East Asia and Pacific 2.87 4.70 5.52 3.33 4.80 1.96 3.80 Europe and Central
Asia
.. .. 3.85 9.23 7.82 4.81 6.28
Latin America and Caribbean
7.39 7.62 6.03 6.02 5.06 3.56 5.90
Middle East and North Africa 6.19 4.92 6.38 6.29 4.29 3.09 5.01 South Asia 6.35 3.66 2.47 3.10 5.80 2.83 4.01 Sub-Saharan Africa 8.32 7.96 10.11 9.49 7.03 6.38 8.16 Average 7.18 6.97 7.70 7.41 6.11 4.62 6.50
Table 2 : Descriptive statistics
Variables Obs Mean Sts. Dev Min Max
1st order autocorrelation coefficient Instability of household consumption per capita 434 6.49 5.42 0.20 43.67 0.56* Initial GDP per capita (log) 625 6.77 1.06 4.44 9.02 0.98*
Trade openness 645 73.27 39.43 2.35 226.87 0.92*
Total population (log) 743 15.51 1.93 10.62 20.97 0.99*
Remittances (% GDP) 513 3.98 8.30 0 80 0.92*
Private credit ratio 523 22.35 18.93 0.41 145.31 0.89*
Financial openness 629 1.51 1.18 0.18 4.53 0.81*
Democracy 604 0.45 0.32 0 1 0.85*
Government consumption (%GDP) 627 15.68 6.80 2.34 54.37 0.83* Discretionary fiscal policy 425 10.74 11.44 0.77 91.69 0.58*
Aid (%GDP) 632 8.01 9.38 -0.02 58.05 0.81*
GDP per capita instability 600 4.09 3.37 0.25 32.19 0.31*
Dependency ratio 729 43.87 5.69 29.73 53.66 0.97*
* significant at 5% level. Countries (87) : Albania, Algeria, Argentina, Armenia, Azerbaijan, Bangladesh, Belize, Benin, Bolivia, Botswana, Brazil, Bulgaria, Burkina Faso, Cambodia, Cameroon, Cape Verde, Chile, China, Colombia, Comoros, Costa Rica, Cote d’Ivoire, Dominica, Dominican Republic, Ecuador, Egypt, El Salvador, Eritrea, Ethiopia, Gabon, Gambia, Ghana, Guatemala, Guinea, Guinea-Bissau, Guyana, Honduras, India, Indonesia, Iran, Jordan, Kazakhstan, Kenya, Lebanon, Lesotho, Macedonia, Madagascar, Malawi, Malaysia, Mali, Mauritania, Mauritius, Mexico, Moldova, Morocco, Mozambique, Namibia, Nicaragua, Oman, Pakistan, Panama, Paraguay, Peru, Philippines, Romania, Russia, Rwanda, Senegal, Seychelles, Slovak Rep., South Africa, Sudan, Swaziland, Syrian A.R., Tajiskistan, Tanzania, Thailand, Togo, Tunisia, Turkey, Uganda, Ukraine, Uruguay, Venezuela, Vietnam, Zambia, Zimbabwe.
Table 3: Impact of remittances on household consumption instability
(1) (2) (3) (4) (5) (6) (7) (8) (9) Lag dependent var. 0.394*** 0.435*** 0.376** 0.352*** 0.345** 0.250* 0.427*** 0.226* 0.179*
(2.85) (3.31) (2.31) (2.74) (2.11) (1.77) (3.35) (1.69) (1.82) Initial GDP pc -0.950** -0.628 -0.929** -0.274 -1.048* -2.374*** -0.860** -0.646** -1.189 (2.27) (1.36) (2.24) (0.69) (1.68) (2.80) (2.33) (2.09) (1.31) Trade openness 0.047* 0.040* 0.032 0.045* 0.052 0.058*** 0.045* 0.029 0.035 (1.94) (1.70) (1.25) (1.77) (1.61) (3.03) (1.85) (1.03) (1.34) Population -0.960* -0.664 -0.599 -0.977* -1.643** -0.797* -0.689 -0.287 -0.563 (1.88) (1.09) (1.34) (1.94) (2.46) (1.75) (1.55) (0.54) (1.03) Remittances -0.158*** -0.151*** -0.167*** -0.156** -0.187*** -0.122** -0.166*** -0.124* -0.138** (4.02) (3.81) (2.71) (2.08) (3.67) (2.27) (3.66) (1.85) (2.27)
Private credit ratio -0.023 -0.005 -0.008
(1.10) (0.20) (0.33) Financial open. 3.115** 2.262* 2.867** (2.02) (1.87) (2.08) (Financial open.)² -0.556* -0.385* -0.505* (1.87) (1.67) (1.96) Democracy -5.446** -3.515* -3.060 (2.61) (1.98) (1.48)
Discretionary fiscal policy 0.162** 0.004 0.029 (2.02) (0.06) (0.44)
Aid -0.252 -0.096
(1.47) (0.61) GDP per capita instability 0.750*** 0.553*** 0.515** (3.73) (2.69) (2.39) Constant 23.826** 17.416* 16.942* 21.698** 33.873*** 32.453*** 15.541* 10.120 18.395 (2.60) (1.76) (1.87) (2.45) (2.82) (2.98) (1.93) (1.04) (1.36) Observations 294 265 294 280 293 292 294 251 249 Countries 87 77 87 81 87 87 87 72 72 AR(1):p-value 0.002 0.001 0.006 0.001 0.003 0.022 0.001 0.005 0.005 AR(2):p-value 0.107 0.196 0.083 0.196 0.601 0.285 0.546 0.677 0.825 Hansen p-value 0.441 0.542 0.207 0.505 0.728 0.613 0.601 0.759 0.561 Instruments 19 20 25 22 17 20 22 36 39
Note: The estimation method is two-step system GMM with Windmeijer (2005) small sample robust correction. Time effects are included in all the regressions. t-statistics are below the coefficients. Instability is the five-year standard deviation of the growth rate of the corresponding variable. Data are averaged over six non-overlapping five-year periods between 1975 and 2004. Dependent variable: Household consumption instability. *** p<0.01,** p<0.05,* p<0.1
Table 4: Insurance role of remittances: Alternative specifications Dependent variable Household consumption
instability
Ratio of household consumption instability to GDP instability
(1) (2) (3) (4) (5) (6) (7)
Lag dependent variable 0.244* 0.181* (1.86) (1.93)
Initial GDP per capita -0.337 -0.577 -0.740*** -1.413*** -0.449* -0.571** -0.888* (0.83) (0.84) (3.04) (3.42) (1.87) (2.38) (1.90) Trade openness 0.018 0.040* 0.047** 0.053*** 0.057** 0.044* 0.050** (0.94) (1.93) (1.99) (2.80) (2.48) (1.76) (2.50)
Population -0.900 -0.807* 0.241 0.122 0.382 -0.270 0.077
(1.44) (1.78) (0.67) (0.36) (0.94) (0.51) (0.17) Discretionary fiscal policy 0.046 0.026
(0.58) (0.30)
Democracy -2.057 -2.705 -1.391*** -0.698
(1.14) (1.31) (2.67) (1.61)
Private credit ratio -0.004 -0.011 -0.039** -0.044*** -0.038** -0.030 -0.032* (0.22) (0.54) (2.17) (2.74) (2.00) (1.51) (1.76)
Financial openness 0.628 0.487 1.879 2.357** 1.301 0.769 1.315
(0.81) (0.62) (1.45) (2.10) (1.29) (0.53) (1.21) (Financial openness)² -0.118 -0.102 -0.313 -0.387* -0.228 -0.168 -0.249 (0.75) (0.65) (1.31) (1.83) (1.26) (0.71) (1.33) GDP per capita instability 0.757*** 0.775***
(3.88) (2.84)
Remittances 0.136 0.146 -0.155*** -0.123*** -0.141*** -0.148*** -0.088* (1.64) (1.34) (2.78) (3.90) (3.32) (2.89) (1.98) Remittances×GDP per capita instability -0.038*** -0.047**
(2.97) (2.06) Aid -0.003 -0.145* -0.130 (0.02) (1.74) (1.33) Dependency ratio 0.113* 0.122** (1.99) (2.15) Constant 17.576* 18.080* -0.390 5.827 -9.995 8.379 -1.636 (1.77) (1.69) (0.05) (0.73) (0.95) (0.86) (0.15) Observations 251 249 326 323 317 307 304 Countries 72 72 83 83 81 77 77
Joint significance of remittance (p-value) 0.002 0.050
Turning point of remittances ratio 20% 16%
AR(1):p-value 0.002 0.004 0.033 0.041 0.038 0.036 0.041
AR(2):p-value 0.941 0.947 0.232 0.435 0.111 0.086 0.100
Hansen p-value: 0.885 0.669 0.276 0.188 0.624 0.484 0.344
Instruments 30 36 20 22 21 21 24
Note: The estimation method is two-step system GMM with Windmeijer (2005) small sample robust correction. Time effects are included in all the regressions. t-statistics are below the coefficients. Instability is the five-year standard deviation of the growth rate of the corresponding variable. Data are averaged over six non-overlapping five-year periods between 1975 and 2004.
Table 5: Remittances, Financial Constraints and Household Consumption instability
(1) (2) (3) (4)
Lag dependent var. 0.245** 0.212* 0.259** 0.202**
(2.02) (1.91) (2.62) (2.44)
Initial GDP per capita -0.001 -0.045 -0.264 -1.631*
(0.00) (0.10) (0.81) (1.82)
Trade openness 0.034 0.023 0.026 0.042**
(1.25) (1.12) (1.13) (2.05)
Population -0.652 -0.761 -0.466 -0.201
(1.00) (1.46) (0.95) (0.46)
Discretionary fiscal policy 0.168* 0.115* 0.046 0.074*
(1.81) (1.76) (0.80) (1.82)
Democracy -3.988** -3.695* -2.775 -0.605
(2.18) (1.92) (1.36) (0.28)
Private credit ratio -0.027 -0.028 -0.026 -0.058**
(1.13) (1.08) (1.14) (2.31)
Remittances -0.161** -0.159** -0.183** -0.186**
(2.11) (2.19) (2.23) (2.13) Remittances×Private credit ratio 0.004* 0.005* 0.005* 0.006* (1.81) (1.71) (1.81) (1.71)
Financial openness 2.845* 2.719* 3.662**
(1.99) (1.78) (2.40)
(Financial openness)² -0.602** -0.551* -0.680**
(2.34) (1.95) (2.46)
GDP per capita instability 0.605*** 0.635***
(3.64) (3.76) Aid -0.248 (1.40) Constant 14.205 15.720* 9.798 14.077 (1.36) (1.87) (1.22) (1.19) Observations 251 251 251 249 Countries 72 72 72 72
Joint significance of remittances’ coef. (p-val) 0.114 0.094 0.090 0.100 Private credit turning-point (% GDP) 44.09 32.94 34.94 31.55
Countries below the threshold of private cred. 65 60 60 60
Percentage of countries below the threshold 90 83 83 83
AR(1):p-value 0.002 0.002 0.000 0.005
AR(2):p-value 0.770 0.691 0.923 0.782
Hansen p-value 0.633 0.603 0.896 0.936
Instruments 24 31 33 34
Note: The estimation method is two-step system GMM with Windmeijer (2005) small sample robust correction. Time effects are included in all the regressions. t-statistics are below the coefficients. Instability is the five-year standard deviation of the growth rate of the corresponding variable. Data are averaged over six non-overlapping five-year periods between 1975 and 2004. Dependent variable: Household consumption instability. *** p<0.01,** p<0.05,* p<0.1
Table 6: Remittances, financial constraints and the ratio of consumption instability to GDP per capita instability
(1) (2)
Population -0.164
(0.41)
Initial GDP per capita -1.262*** -0.883**
(3.00) (2.53) Trade openness 0.045** 0.046*** (2.24) (3.54) Financial openness 1.520 0.258 (1.47) (0.18) (Financial openness)² -0.295 -0.071 (1.50) (0.24) Aid -0.128 -0.106 (1.45) (1.32)
Private credit ratio -0.047** -0.039**
(2.48) (2.55)
Remittances -0.169*** -0.135***
(3.55) (2.92) Remittances×Private credit ratio 0.005** 0.004*
(2.16) (1.94) Dependency ratio 0.096 (1.60) Constant 10.666 1.680 (1.21) (0.43) Observations 323 314 Countries 83 81
Joint significance of remittances (p-value) 0.002 0.016 Turning point for private credit ratio 33.915 35.968 Countries below the threshold of credit 72 72 Percentage of countries below the threshold 87 89
AR(1):p-value 0.034 0.037
AR(2):p-value 0.223 0.106
Hansen p-value 0.338 0.381
Instruments 24 22
Note: The estimation method is two-step system GMM with Windmeijer (2005) small sample robust correction. Time effects are included in all the regressions. t-statistics are below the coefficients. Instability is the five-year standard deviation of the growth rate of the corresponding variable. Data are averaged over six non-overlapping five-year periods between 1975 and 2004. Dependent variable: The ratio of household consumption instability to GDP per capita instability. *** p<0.01,** p<0.05,* p<0.1.
Table 7: Remittances, financial constraints and the ratio of consumption instability to GDP per capita instability: Nonlinear System-GMM method
Remittances -0.067**
(2.14)
Remittances×dFD=1[FD>13.5%] 0.097
***
(2.72)
Private credit ratio -0.037***
(3.00)
Initial GDP per capita -1.217**
(2.63) Trade openness 0.041** (2.28) Financial openness 1.379 (1.41) (Financial openness)² -0.268 (1.39) Aid -0.142* (1.95) Dependency ratio 0.009 (0.05) Constant 7.355 (0.69) Observations 314 Countries 81
Joint significance of remittances (p-value) 0.008
Threshold of private credit ratio 13.531%
Countries below the threshold 43
Percentage of countries below the threshold 53
AR(1):p-value 0.034
AR(2):p-value 0.100
Hansen p-value 0.396
Instruments 24
Note: The estimation method is two-step system GMM with Windmeijer (2005) small sample robust correction. Time effects are included in all the regressions. t-statistics are below the coefficients. Instability is the five-year standard deviation of the growth rate of the corresponding variable. Data are averaged over six non-overlapping five-year periods between 1975 and 2004. Dependent variable: The ratio of household consumption instability to GDP per capita instability. *** p<0.01,** p<0.05,* p<0.1.
Table 8: Impact of remittances on the sensitivity of household consumption to several shocks
(1) (2) (3)
Lag dependent variable 0.350* 0.247* 0.227*
(1.94) (1.69) (1.88)
Initial GDP per capita -0.789 -0.602 -0.008
(1.22) (1.42) (0.01)
Trade openness 0.030 0.022 0.018
(1.00) (1.21) (0.91)
Population -1.661 -0.870** -1.112
(1.52) (2.03) (1.60)
Discretionary fiscal policy 0.183** 0.092* 0.214*
(2.19) (1.86) (1.97) Democracy 4.798 -2.493 -2.384 (1.35) (1.35) (0.92) Financial openness -0.213 0.303 1.375 (0.15) (0.43) (1.58) (Financial openness)² 0.035 -0.024 -0.264 (0.14) (0.17) (1.51)
Private credit ratio -0.011 0.010 -0.018
(0.40) (0.49) (0.93) Remittances 0.081 0.108 0.090 (0.83) (1.64) (0.96) Remittances×Natural disasters -0.032** (2.51) Natural disasters 0.114 (1.29)
Instability of agricultural value added 0.119**
(2.30) Remittances×Instability of agricultural value added -0.012***
(4.22)
Remittances×Discretionary fiscal policy -0.023**
(2.35)
Constant 31.445* 20.176*** 20.686*
(1.76) (2.74) (1.84)
Observations 251 242 251
Countries 72 72 72
Joint significance of remittances’ coeff. (p-value) 0.011 0.000 0.002
Turning point of remittances ratio 3% 10% 9%
Countries above the threshold 33 10 12
Percentage of countries above the threshold 46% 14% 17%
AR(1):p-value 0.004 0.004 0.002
AR(2):p-value 0.717 0.716 0.903
Hansen p-value: 0.379 0.694 0.598
Instruments 29 35 27
Note: The estimation method is two-step system GMM with Windmeijer (2005) small sample robust correction. Time effects are included in all the regressions. t-statistics are below the coefficients. Instability is the five-year standard deviation of the growth rate of the corresponding variable. Data are averaged over six non-overlapping five-year periods between 1975 and 2004. Dependent variable: Household consumption growth instability. *** p<0.01,** p<0.05,* p<0.1
Table 9: Threshold effects in the relationship between remittances and household consumption instability: Nonlinear System-GMM method
(1) (2)
Lag dependent variable 0.228* 0.240*
(1.70) (1.75) Remittances -0.822** -0.820* (2.44) (1.92) Remittances×dr=1[R>8.5%] 0.702 ** 0.700* (2.13) (1.69)
GDP per capita instability 0.397*
(1.67)
Private credit ratio -0.002 -0.001
(0.10) (0.03) Population -0.084 -0.275 (0.13) (0.55) Financial openness 2.042* 2.245 (1.97) (1.56) (Financial openness)² -0.330* -0.379 (1.68) (1.45)
Discretionary fiscal policy 0.135* 0.061
(1.87) (0.67)
Initial GDP per capita -0.532 -0.622**
(1.36) (2.07) Democracy -4.925** -3.870* (2.38) (1.73) Trade openness 0.028 0.021 (1.04) (0.78) Constant 8.751 11.380 (0.73) (1.17) Observations 251 251 Countries 72 72
Joint significance of remittances (p-value) 0.016
Threshold of remittances ratio 8.536%
Countries above the threshold of remittances 13 Percentage of countries above the threshold 18
AR(1):p-value 0.003 0.004
AR(2):p-value 0.717 0.703
Hansen p-value 0.857 0.614
Instruments 35 38
Note: The estimation method is two-step system GMM with Windmeijer (2005) small sample robust correction. Time effects are included in all the regressions. t-statistics are below the coefficients. Instability is the five-year standard deviation of the growth rate of the corresponding variable. Data are averaged over six non-overlapping five-year periods between 1975 and 2004. Dependent variable: Household consumption instability.
Figure 1: Evolution of the coefficient associated to the interactive term of remittances with the private credit ratio: Nonlinear System GMM Estimation
-2,5 -1,5 -0,5 0,5 1,5 2,5 3,5 4,5 3,53 18,53 33,53 48,53 (Rxd) Coeff. Confidence interval at 95% -0,1 0 0,1 0,2 0,3 0,4 0,5 3,53 18,53 33,53 48,53 p-value (Rxd) Coeff. 0,1 0,05 0 0,2 0,4 0,6 0,8 1 3,53 18,53 33,53 48,53 Private credit % GDP Hansen p-value
Figure 2: Evolution of the coefficient associated to nonlinear term in remittances: Nonlinear System GMM Estimation -6 -4 -2 0 2 4 6 8 0,54 3,04 5,54 8,04 10,54 13,04 15,54 (Rxdr) Coeff. Confidence interval at 95% 0 0,05 0,1 0,15 0,2 0,25 0,3 0,35 0,4 0,45 0,54 3,04 5,54 8,04 10,54 13,04 15,54 p-value (Rxdr) Coeff. p-value 5% p-value 10% 0 0,2 0,4 0,6 0,8 1 0,54 3,04 5,54 8,04 10,54 13,04 15,54 Remittances % GDP Hansen p-value
APPENDIX 2: DATA DEFINITIONS AND SOURCES
Household consumption instability: standard deviation of the household consumption per capita growth rate
estimated over non-overlapping 5 years. Household consumption per capita are drawn from World Bank tables, World Development Indicators (2009)
Gross domestic product per capita: logarithm of the GDP per capita. Data are in constant 2000 U.S. dollars
(World Development Indicators, 2009)
Trade openness: Sum of exports and imports of goods and services measured as a share of gross domestic
product (World Development Indicators, 2009)
Population: logarithm of the total population in corresponding countries (World Development Indicators, 2009) Remittances: Ratio of workers’ remittances and compensation of employees to GDP. Workers' remittances and
compensation of employees comprise current transfers by migrant workers and wages and salaries earned by nonresident workers. Workers’ remittances are classified as current private transfers from migrant workers who are residents of the host country to recipients in their country of origin. They include only transfers made by workers who have been living in the host country for more than a year, irrespective of their immigration status. Compensation of employees is the income of migrants who have lived in the host country for less than a year. Migrants’ transfers are defined as the net worth of migrants who are expected to remain in the host country for more than one year that is transferred from one country to another at the time of migration. (World Development Indicators, 2009)
Private credit ratio: Private credit by deposit money banks to GDP (Thorsten Beck, Asli Demirgüç-Kunt and
Ross Levine, (2000), “A New Database on Financial Development and Structure”)
Financial openness: defined as 2+KAOPEN, where KAOPEN is the Chinn-Ito Financial Openness Variable
(Chinn and Ito, (2008), “A New Measure of Financial Openness”). The index takes on higher values the more open the country is to cross-border capital transactions. KAOPEN takes into account four major categories on the restrictions on external account: 1-the presence of multiple exchange rates, 2-restrictions on the current account transactions, 3-restrictions on the capital account transactions, 4-the requirement of the surrender of export proceeds.
Democracy: Democracy index (polity score): Scale from 0 to 1, with 0 indicating full autocracy and 1 full
democracy. (Marshall and Jaggers, 2002)
Aid: Ratio of foreign aid to Gross National Income (GNI). Aid includes both official development assistance
(ODA) and official aid. Ratios are computed using values in U.S. dollars (World Development Indicators, 2009)
GDP per capita growth volatility: standard deviation of GDP per capita growth rate estimated over
non-overlapping 5 years (World Development Indicators, 2009)
Dependency ratio: Age dependency ratio (dependents to working-age population). Data are drawn from World