HAL Id: inserm-00191133
https://www.hal.inserm.fr/inserm-00191133
Submitted on 24 Nov 2007
HAL is a multi-disciplinary open access
archive for the deposit and dissemination of
sci-entific research documents, whether they are
pub-lished or not. The documents may come from
teaching and research institutions in France or
abroad, or from public or private research centers.
L’archive ouverte pluridisciplinaire HAL, est
destinée au dépôt et à la diffusion de documents
scientifiques de niveau recherche, publiés ou non,
émanant des établissements d’enseignement et de
recherche français ou étrangers, des laboratoires
publics ou privés.
An original methodology for quantitative assessment of
perfusion in small animal studies using
contrast-enhanced ultrasound.
Sébastien Mulé, Alain de Cesare, Frédérique Frouin, Olivier Lucidarme, Alain
Herment
To cite this version:
Sébastien Mulé, Alain de Cesare, Frédérique Frouin, Olivier Lucidarme, Alain Herment. An
orig-inal methodology for quantitative assessment of perfusion in small animal studies using
contrast-enhanced ultrasound.. Conference proceedings : .. Annual International Conference of the IEEE
Engineering in Medicine and Biology Society. IEEE Engineering in Medicine and Biology Society.
Annual Conference, Institute of Electrical and Electronics Engineers (IEEE), 2007, 1, pp.347-50.
�10.1109/IEMBS.2007.4352295�. �inserm-00191133�
inserm-00191133, version 1 - 24 Nov 2007
An Original Methodology for Quantitative Assessment of Perfusion in
Small Animal Studies Using Contrast-Enhanced Ultrasound
S´ebastien Mul´e, Alain De Cesare, Fr´ed´erique Frouin, Olivier Lucidarme and Alain Herment
Abstract— The aim of this paper was to validate the
com-binaison of two original methods for assessing perfusion in small animal studies using Contrast-Enhanced Ultrasound. Respiratory motion was first removed using a frame selection method. This method, based on a Principal Component Analy-sis, enabled the definition of two subsequences, corresponding to the end-of-inspiration plane and to the end-of-expiration plane. Attenuation caused by contrast agent microbubbles was then estimated. The developed method, based on the assumption that a linear relationship holds between local attenuation and backscatter, used the time-intensity variation in a highly echogenic distal area without contrast uptake to estimate local attenuation coefficients. Ten murine renal perfusion studies were investigated after a bolus injection of SonoVue. Replenishment kinetics were acquired too and were finally modeled with an exponential function. Preliminary results were promising. Indeed, the SonoVue concentration was more faithfully represented than on native images, which allowed a better assessment of perfusion parameters in the whole field of view.
I. INTRODUCTION
The development of ultrasound contrast agents (UCA) and contrast-specific imaging modalities has increased the interest in ultrasound for functional studies by improving the contrast resolution and suppressing signal from sta-tionary tissues. In addition, UCA consist of microbubbles and thus are blood-pool agents, making Contrast-Enhanced Ultrasound (CEUS) an excellent tool for delineating perfused tissues. They allow functional assessment of their contrast enhancement, especially for tumor angiogenesis and response to new therapeutic regimes.
Several methods have been developed for quantifying microvascular perfusion using CEUS in vitro and in vivo [1], [2], [3]. These methods are based on the fact that microbub-bles can be destroyed by ultrasound. During continuous infusion of a UCA, the kinetics of bubble destruction [2] or bubble replenishment after destruction [1], [3] can be used to describe and quantify organ perfusion. Quantification of contrast uptake kinetics starts with the design of user-defined regions-of-interest (ROI). The time-intensity variation for each ROI is then fitted with a model, e.g., an exponential function [1].
However perfusion coefficients estimated with these mod-els could be impaired by several artefacts. The aim of this
S. Mul´e, A. De Cesare, F. Frouin and A. Herment are with INSERM UMR-S 678, UPMC, Paris, France smule@imed.jussieu.fr Tel: (33) 153828437 Fax: (33) 153828448
O. Lucidarme is with the Radiology Department, Piti´e-Salpˆetri`ere Hos-pital, Paris, France
paper is to propose an original methodology for quantifying perfusion in small animal CEUS studies by investigating original methods to correct for these artefacts.
Artefacts may be due to motion that is present in medical images. As the same tissue should remain in the studied ROI for an accurate quantification, any motion has to be removed before. Motion artefacts may be related either to patient’s respiration or to probe displacement. Motion involves a degradation of estimates of perfusion indices and needs to be removed. Many methods for automatic motion compensation have been developed, using rigid or non-rigid registration algorithms. However these methods are based on the assumption that the motion is always contained in the acquisition plane, which is not necessarily true for in vivo acquisitions. Indeed, the motion is most of the time three-dimensional, whereas the acquisition is only bidimensional. New methods have thus to be considered and investigated.
In this paper, an original frame selection method that selects the frames acquired at the same respiratory phase is proposed, assuming that the investigated organ reaches almost the same position at each extreme phase of the respiratory cycle. This a posteriori respiratory gating is based on a Principal Component Analysis (PCA) and integrates a priori information about the respiratory frequency.
The other main limitation of accurate quantification is the shadowing effect resulting from an incorrect attenuation cor-rection. Attenuation is typically compensated for by applying a time-gain compensation (TGC) curve. TGC is based on the assumption that attenuation is a function only of depth. This theory is insufficient, particularly when using UCA. Several methods for automatic attenuation compensation have been developed, either assuming sufficient homogeneity in the im-ages [4], [5], [6] or making the less constraining assumption that local attenuation and backscatter are directly related [7]. Even if these methods provide useful attenuation correction for soft tissues, no method has yet been developed to assess microbubble attenuation in vivo. There is thus a crucial need to compensate for microbubble attenuation to quantify tissue perfusion accurately. A first approach for automatic microbubble attenuation in small animal studies, based on the time-intensity variation in a highly echogenic distal area without contrast uptake, has already been proposed [8]. In this paper, an improvement of this method which introduces a regularized estimation of attenuation coefficients is presented.
HAL author manuscript inserm-00191133, version 1
HAL author manuscript
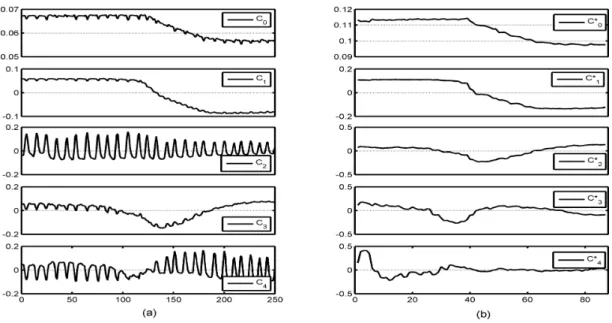
Fig. 1. Exemple of the five main normalized components C0to C4and C0∗to C4∗given by PCA, before (a) and after (b) frame selection, respectively.
II. MATERIALS AND METHODS A. Data acquisition and preprocessing
Ten mice were studied to validate the process. Mice were anaesthetized and placed on the right flank against a heating pad. Contrast ultrasound images were acquired at a low mechanical index of 0.09 after a bolus injection of 0.1 ml of Sonovue™, using an Acuson Sequoia 512 device (Siemens Medical Solutions). The linear-array transducer (15L8w, with a central transmit frequency of 7 MHz) was mechanically fixed above the mice allowing them to breathe freely. The penetration depth was adjusted to include both kidneys and the skin-table interface at the opposite side of the mouse in the field of view. A first bolus sequence was acquired during 10 seconds, followed by a 50 seconds delay to allow microbubble concentration to reach equilibrium. After destruction of microbubbles with destructive frames at maximum power during 5 seconds, an other sequence was acquired at 25 frames per seconds during 10 seconds. Dual images in Cadence™Contrast Pulse Sequencing (CPS) [9] and fundamental modes were acquired. Both the frame selec-tion and the attenuaselec-tion estimaselec-tion methods were applied to the acquisitions in fundamental mode, which were converted from gray levels into decibels using the grayscale colorbar displayed on the monitor.
B. Methods
1) Frame selection: The first step of the proposed frame selection method was the estimation of the respiratory cycle by applying a PCA to the image sequences. This estimation was based on the assumption that not only one but several components held information related to the respiratory mo-tionR(t), so that the latter was found as a linear combination of the five main components provided by PCA, referred to as C0, ..., C4 (Fig. 1(a)):
R(t) = C0(t)+λ1C1(t)+λ2C2(t)+λ3C3(t)+λ4C4(t). (1)
As values of respiratory frequencies are always in a fixed frequential window betweenfmin andfmax (in practice we
chose fmin = 1Hz and fmax = 5Hz for an anesthetized
mouse), the respiratory motion was estimated by maximiza-tion of a frequential criteriaCr defined by:
Cr = max λ Z fmax fmin F F T (R) ! , (2)
where λ = (λ1, . . . , λ4) and F F T (X) is the fast Fourier
transform of vector X. Cr thus corresponds to the energy ofR in the predefined frequential window.
After the estimation of the respiratory motion, the local minima and maxima of respiration were extracted following the method described in [10]. Frames corresponding to each extreme phase of the respiratory cycle were selected by applying a threshold of 5%, i.e for each respiratory period, values lower than 5% of the local minima and values upper than 95% of the local maxima were retained for generating the minima subsequenceSmin and the maxima subsequence
Smax respectively. These subsequences corresponded to the
Fig. 2. Estimated respiratory motion and definition of Sminand Smax by detecting local minima (in blue) and maxima (in red), respectively.
end-of inspiration plane and the end-of-expiration plane, respectively (Fig. 2).
2) Microbubble attenuation estimation: A propagation model of the ultrasound pulse specific to CEUS studies was proposed [8]. This model considered that the time-intensity variation in a highly echogenic distal area without contrast uptake (i.e., the skin-table interface at the opposite side of the mouse), thereafter referred to as Rdist, provided the
cumulative attenuation from the transducer toRdist. At each
time (t), the variation of intensity of each pixel of an A-line (N pixels per line) was expressed as:
Pk(t) = βk(t) − 2 k−1
X
i=1
αi(t), 1 ≤ k ≤ N − 1, (3)
where αk(t) is the attenuation caused by microbubbles
andβk(t) is a function of the backscatter.
Pixels beyond Rdist were not considered, so that the
last pixel of each A-line (i.e., the Nth) belonged to R dist.
As there was no contrast uptake in Rdist, the backscatter
coefficient associated with the last pixel was equal to zero: βN(t) = 0. Therefore, PN(t) = −2 N −1 X i=1 αi(t). (4)
So for each image of the sequence, sound propaga-tion along each A-line of N pixels was modeled by N equations (i.e., (3) and (4)) for 2(N − 1) unknowns (i.e., α1(t), ..., αN −1(t), β1(t), ..., βN −1(t)), which could not be
solved without additional information.
This equation system was previously analytically solved by assuming the ratio ak(t) = βk(t)/αk(t) constant on
each A-line [8]. This paper proposed an improvement of that method. A smooth constraint onak(t) was introduced,
allowing regularized attenuation coefficients to be estimated. At each time (t),ak(t) was constrained to be homogeneous
on the field of view. For each A-line,αk(t) and βk(t)
coeffi-cients were obtained by minimization of an error depending on the propagation equations (3) and (4) and on the additional constraint of homogeneity on ak(t), which was initialized
by applying the analytical method [8]. The process was then iterated. For each image,ak(t) was calculated for each pixel
and its mean value was used as initial value for the next iteration. The process stopped when relative variation of ak(t) was lower than 5%.
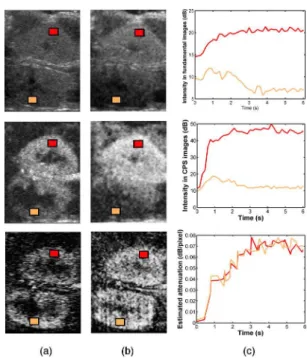
3) Reperfusion kinetics modeling: After microbubble at-tenuation has been estimated, quantification of contrast up-take kinetics after microbubble destruction can be investi-gated, even in deep areas. Two ROIs were defined in the cortex of each kidney to compare their replenishment kinetics (Fig. 3). Time intensity curve (TIC) were extracted from fundamental and CPS images and from attenuation images and then fitted by a mono-exponentiel model [1]:
T IC(t) = BI + A(1 − e−βt). (5)
Fig. 3. Images acquired in fundamental mode (top) and in CPS mode (middle) 2 seconds (a) and 4 seconds (b) after the contrast agent enters the acquisition plane. (bottom) Associated parametric images of microbubble attenuation. (c) Time-intensity curves in both cortices extracted from the fundamental acquisition (top), the CPS acquisition (middle) and the atten-uation sequence (bottom).
BI is the baseline intensity. A andβ indicate the amplitude of enhancement and the velocity parameter, respectively. They correspond to three functional parameters typically estimated in destruction-replenishment studies.
III. RESULTS A. Frame selection
Frame selection was performed on the 10 studies on both bolus and replenishment sequences. Almost half of the frames (mean value of 48.6%, standard deviation of 7.4%) were selected on average. Typical mouse respiratory frequency values were estimated, with a mean value of 2.68 Hz and a standard deviation of 0.36 Hz.
For all the studies, no more respiratory motion could be detected on Smin and Smax by visual analysis. A PCA
was performed on the 40 subsequences (2 subsequences per original sequence) to confirm this result. The five main com-ponents estimated for one bolus study after frame selection are shown in Fig. 1(b). While respiratory information can be easily observed on the 5 components before frame selection (Fig. 1(a)), especially onC2andC4, components after frame
selection are respiratory motion free. ComponentsC∗ 0, C1∗
and C∗
2 seem to fit to C0, C1 and C3. They are related
with physiological kinetics. On the other hand, a component equivalent to C2, that mainly contains respiratory motion
information, cannot be found after frame selection. B. Attenuation estimation
Microbubble attenuation images were estimated for each of the 20 sequences (Fig. 3). While shadowing artefacts can
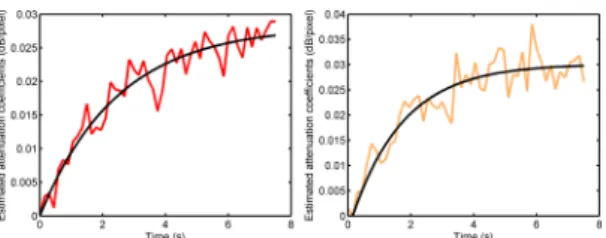
Fig. 4. Exemple of replenishment curves in the proximal kidney (left) and in the distal kidney (right) extracted from attenuation images. The same ROIs as those on Fig. 3 were used.
be easily noticed in native images, attenuation coefficients are homogeneous within each cortex and equivalent in both cortices, which agrees with a homogeneous concentration of UCA microbubbles in these areas.
In both fundamental and CPS images, time-intensity curves in the distal kidney revealed shadowing artefacts, while equivalent attenuation coefficients are found in both cortices (Fig. 3(b)). Similar results were obtained with the replenishment kinetics (Fig. 4).
C. Reperfusion kinetics modeling
An exponential modeling was performed on the reperfu-sion kinetics extracted from the attenuation images (Fig. 4). For this study, values estimated for the exponential model were A = 0.028, β = 0.4 for the proximal kidney (Fig. 4(a)) and A = 0.03, β = 0.61 for the distal kidney (Fig. 4(b)). In both cases, baseline intensity was equal to zero.
IV. DISCUSSION AND CONCLUSION The assessment of replenishment kinetics following de-struction of UCA microbubbles can allow the assessment of tissue perfusion parameters. However, a preliminary step consists of removing any artefacts such as respiratory motion and attenuation caused by microbubbles.
In this study, new tools for perfusion assessment in small animal studies have been presented. The developed frame selection method allowed the selection of images acquired at the same time of the respiratory cycle by generating two subsequences for each initial acquisition. Because of the rel-atively high respiratory frequency of mice, time for reaching the same extreme position two consecutive times is very short in front of replenishment speed and duration. Consequently, differentiation of the different contrast enhancement phases was not altered by the lower temporal resolution of Smin
andSmax.
UCA microbubble attenuation was then estimated. The method made use of the time-intensity variation in a highly echogenic distal area without contrast uptake, which pro-vided cumulative attenuation in the perfused area. Results were promising. Compared with the initial method [8], attenuation estimation was more accurate and homogeneous in the cortices. Shadowing artefacts were highly reduced, allowing a more faithful representation of UCA concentration than both fundamental and CPS images. The assumption of proportionality between attenuation and backscatter coeffi-cients appeared to be reasonable in a first approximation.
Making this relationship more flexible is under investigation. The pressure-dependence of microbubble attenuation will be further investigated too. However, this dependance should not be very substantial in the experimental conditions of this study. Indeed, Tang et Eckersley [11] found that attenuation of Sonovue rapidly decreased when the frequency was away from resonance, which was the case here.
After respiratory motion and microbubble attenuation arte-facts have been removed, quantitative assessment of per-fusion could be investigated, even in distal areas. Results showed that while native images only allowed quantitative study in areas close to the probe, replenishment curves extracted from attenuation images could be modeled to estimate functional parameters in the whole field of view. Next step would be the study of the correlation between these parameters and perfusion parameters, such as blow flow.
The complete processing is fast. Indeed, the computation time for the estimation of respiratory motion is of few seconds, while the iterative process of attenuation estimation takes few seconds per iteration with a number of iterations varying from ten to twenty.
The complete processing described in this paper has been implemented in a user friendly software which could be very useful for the perfusion assessment of different organs in small animal studies.
REFERENCES
[1] K. Wei, A. R. Jayaweera, S. Firoozan, A. Linka, D. M. Skyba, and S. Kaul, “Quantification of myocardial blood flow with ultrasound-induced destruction of microbubbles administered as a constant venous infusion,” Circulation, vol. 97, no. 5, pp. 473–83, 1998.
[2] J. Eyding, W. Wilkening, M. Reckhardt, G. Schmid, S. Meves, H. Ermert, H. Przuntek, and T. Postert, “Contrast burst depletion imaging (codim): a new imaging procedure and analysis method for semiquantitative ultrasonic perfusion imaging,” Stroke, vol. 34, no. 1, pp. 77–83, 2003.
[3] O. Lucidarme, Y. Kono, J. Corbeil, S. H. Choi, and R. F. Mattrey, “Validation of ultrasound contrast destruction imaging for flow quan-tification,” Ultrasound Med Biol, vol. 29, no. 12, pp. 1697–704, 2003. [4] E. Walach, A. Shmulewitz, Y. Itzchak, and Z. Heyman, “Local tissue attenuation images based on pulsed-echo ultrasound scans,” IEEE
Trans Biomed Eng, vol. 36, no. 2, pp. 211–21, 1989.
[5] F. M. Valckx, J. M. Thijsse, A. J. van Geemen, J. J. Rotteveel, and R. Mullaart, “Calibrated parametric medical ultrasound imaging,”
Ultrason Imaging, vol. 22, no. 1, pp. 57–72, 2000.
[6] B. S. Knipp, J. A. Zagzebski, T. A. Wilson, F. Dong, and E. L. Madsen, “Attenuation and backscatter estimation using video signal analysis applied to b-mode images,” Ultrason Imaging, vol. 19, no. 3, pp. 221– 33, 1997.
[7] D. I. Hughes and F. A. Duck, “Automatic attenuation compensation for ultrasonic imaging,” Ultrasound Med Biol, vol. 23, no. 5, pp. 651–64, 1997.
[8] S. Mule, A. De Cesare, G. Renault, O. Lucidarme, F. Frouin, and A. Herment, “Compensation of attenuation in contrast-enhanced ul-trasound: application to small animal studies,” in Proceedings of the
2006 IEEE International Ultrasonics Symposium, Vancouver, 2006,
pp. 1111–14, 2006.
[9] P. Phillips and E. Gardner, “Contrast-agent detection and quantifica-tion,” Eur Radiol, vol. 14 Suppl 8, pp. P4–10, 2004.
[10] G. Renault, F. Tranquart, V. Perlbarg, A. Bleuzen, A. Herment and F. Frouin, “A posteriori respiratory gating in contrast ultrasound for assessment of hepatic perfusion,” Phys Med Biol, vol. 50, no. 19, pp. 4465–80, 2005.
[11] M. X. Tang and R. J. Eckersley, “Frequency and pressure dependent attenuation and scattering by microbubbles,” Ultrasound Med Biol, vol. 33, no. 1, pp. 164–8, 2007.