Journal of Plankton Research Vol.20 no.7 pp.1357-1375, 1998
The critical pressures of gas vesicles in Planktothrix rubescens in
relation to the depth of winter mixing in Lake Zurich, Switzerland
Anthony E.Walsby, Avril Avery and Ferdinand Schanz1
School of Biological Sciences, University of Bristol, Woodland Road, Bristol BS8 1UG, UK and Institut fur Pflanzenbiologie der Universitat Zurich,
Limnologische Station, Seestrasse 187, CH-8802 Kilchberg, Switzerland
Abstract. The vertical distribution of the cyanobacterium Planktothrix (Oscillatoria) rubescens in
Lake Zurich was investigated from March 1993 to June 1995 by collecting filaments on filters and measuring them by epifluorescence microscopy and computer image analysis. The initial population, which began to stratify in April, decreased by up to 99% by June. During the summer, the population peaked at depths of 8—15 m; it reached a maximum areal filament-volume concentration of -60 cm3
m~2 of lake surface in early September and was then entrained in the deepening surface layer. It
became mixed progressively deeper, to the lake bottom in the cold winter of 1993-94, but less completely in the milder winter of 1994-95. Most of the filaments remained viable during the winter. At the end of the mild winter of 1994-5, 70% of filaments in the water column retained buoyancy, but after the cold winter of 1996-7 only 22% were buoyant. Few remained buoyant below 80 m, where the hydrostatic pressure caused gas vesicle collapse. The proportion that remain buoyant decreases with the depth and duration of winter mixing, and increases with the critical collapse pressure (pc) of
the gas vesicles, which provide buoyancy. Strains of P.rubescens isolated from Lake Zurich differed in mean pc of their gas vesicles, from 0.9 to 1.1 MPa, the highest values in freshwater cyanobacteria.
Allowing for a turgor pressure of 0.2 MPa, these strains would remain buoyant at depths down to 70 and 90 m, respectively. Natural selection for gas vesicles of high pc will operate by increasing the
proportion of filaments that remain buoyant in the upper parts of the water column after circulation to various depths during the winter because only buoyant filaments will form the inoculum for the following season.
Introduction
Many planktonic cyanobacteria possess gas vacuoles, which provide buoyancy. The gas vacuoles are composed of stacks of hollow cylindrical gas vesicles. Gas vesicles are rigid structures that withstand moderate pressures with little elastic decrease in volume, but at certain critical pressures they collapse irreversibly and then no longer provide buoyancy (Walsby, 1994).
The critical collapse pressure, pc, of gas vesicles decreases with width, whereas their efficiency in providing buoyancy increases with width (Walsby and Bley-thing, 1988). The mean width of gas vesicles varies in different cyanobacterial species (Walsby, 1971; Hayes and Walsby, 1986; Walsby and Bleything, 1988). It has been suggested that these differences evolved through natural selection for gas vesicles of maximum width (and hence maximum efficiency) permitted by the minimum critical pressure that prevented their collapse in each natural habitat (Walsby, 1994). This idea is supported by the correlation between the critical pressures of gas vesicles in cyanobacteria and the depths of the lakes or seas in which the organisms occur.
Collapse of gas vesicles occurs if the sum of the hydrostatic pressure, ph, and cell turgor pressure, p,, exceeds the critical pressure, pc. Comparison of the mean critical pressures with the hydrostatic pressures that would be generated by © Oxford University Press 1357
A.E.Walsby, A.Avery and EScfaanz
depths of the water columns in temperate lakes suggests that the depth that deter-mines the selection of strength is not the relatively shallow depth at which most of the cyanobacteria grow during the summer months, but the depth to which they would be mixed in winter. It is this depth that determines the proportion of cyanobacteria that remain buoyant at the end of the winter, and hence of those which could float up and form the inoculum for growth during the next season.
These ideas were developed from a study on the gas-vacuolate cyanobacterium Planktothrix {Oscillatoria) agardhii in Lake Gjersj0en, in Norway. The gas vesicles in this cyanobacterium, the strongest then known in freshwater
cyanobac-teria, had a mean pc of 0.99 MPa (9.9 bar), which exceeded the sum of pt (0.3
MPa) and ph (0.15 MPa) at its greatest depth (15 m) in the summer growing
period, but was equal to the sum when the organism was circulated to the lake
bottom at 70 m, generating a ph of nearly 0.7 MPa in the winter (Walsby et al.,
1983). We have now investigated the relationship between gas-vesicle critical pressure and winter mixing depth in a population of a similar cyanobacterium, Planktothrix rubescens, in a deeper lake, Lake Zurich in Switzerland.
Planktothrix rubescens in Lake Zurich and other Swiss lakes
Planktonic cyanobacteria previously classified as Oscillatoria rubescens, and now classified as Planktothrix rubescens (Anagnostidis and Komarek, 1988), are common in the lakes of north-eastern Switzerland: they occur in both small lakes (e.g. Wilemsee) and large ones (e.g. Zugersee), but not in very oligotrophic (e.g. Walensee) or hypertrophic (e.g. Pfaffikersee, Greifensee) lakes of the region (Soracreppa, 1978). The relationship between the development of P.rubescens and the trophic state of lakes is not yet understood (see Schanz, 1994).
Planktothrix rubescens was first found in Lake Zurich in 1898 by Pfenninger (1902); it remained the dominant phytoplankton species for many years ((Thomas and Marki, 1949; Pavoni, 1963), but it was not detected in the 12 years following 1964, the period of greatest eutrophication in the lake (Schanz and Thomas, 1981). Thomas and Marki (1949) showed that P.rubescens occurred in Lake Zurich at all times of year. In the summer, it stratified in the metalimnion. The population peak followed the fluctuating position of the thermocline (Thomas, 1949) and, during periods of sustained wind direction, moved down to a depth of 12 m (Thomas, 1950). In autumn, the cyanobacterium became entrained in the surface mixed layer and, as this progressively deepened during the winter, it was mixed to depths of 80 m or more (Thomas and Ma*rki, 1949). The extent and duration of winter mixing in Lake Zurich varies from year to year. Kutschke (1966) recorded the annual cycles of temperature from 1937 to 1963, and Orn (1980) recorded the temperature and oxygen concentration profiles over the period of 1930-68.
Our own studies spanned the 2 years from March 1993 to June 1995, the first of which was colder, and the second milder, than normal. We have investigated the relationship between the depth of mixing during the winter periods and the proportion of the filaments that retain buoyancy. Such information is needed to determine the importance of strong gas vesicles in permitting filaments to retain
Gas-vacuolate cyanobacteria in Lake Zurich
their buoyancy during deep circulation, and then to float back to the epilimnion in the spring.
Method
Sampling
Samples were collected from Lake Zurich at 7°17'16"N, 8°35'43"E, between Herrliberg on the north-east side and Oberrieden on the south-west side, over the deepest point in the lake. Samples were collected with a 5 1 Friedinger flask, usually at depths of 0,10 and 20 m, at 20 m intervals to 120 m, and near the bottom depth of 136 m (Orn, 1980). During the summer period of stratification, collec-tions were also made at 2 m depth intervals to determine the concentration profile of the population in the metalimnion. Measurements of temperature were made at depth intervals of 1 m from 0 to 20 m, 2 m down to 30 m, and 5 m down to 130 m.
The water samples were taken to the lake-side laboratory, mixed, and measured volumes of 0.1-2 1 (depending on the filament concentration) were filtered through nitrocellulose membrane filters of 50 mm diameter and 8 um pore size (Schleicher and Schuell), which retained the filaments of Planktothrix. The area of the filter exposed to the water sample, a circle of diameter 40 mm,
was 1257 mm2. The filters were air dried, wrapped in foil and stored at room
temperature.
Microscope image analysis
The membrane filters were inspected with a X2.5 objective on a Leitz Orthoplan microscope using epifluorescence illumination through a Ploemopak M2 filter block, with an excitation wavelength of 546 nm and fluorescent waveband >580 nm. The filaments of P.rubescens, which contained phycoerythrin, fluoresced strongly and showed as orange-red lines against a dark background. Digital images of the field were captured with a Cohu CCD camera connected to a PC computer using a Synoptics integration circuit and Synapse Grabber software. The monochrome images were saved as 0.39 Mbyte BMP (bitmap) computer files and displayed on a high-resolution monitor. The images were edited with Synop-tics PC_Image for VGA and Windows software, and filament length was measured by the detected area method of Walsby and Avery (1996).
At least five image fields (and up to 30 for samples containing low concentra-tions of filaments) were analysed from each filter. The filament length (Lf) in each image field was calculated from the total detected area in pixels multiplied by the equivalent mean pixel length (2.625 um at the magnification used), with the corrections for average geometrical orientation (xl.1222) and filament overlaps (a function of concentration), described by Walsby and Avery (1996). The total filament-length concentration in the lake-water sample (CL) was then calculated as:
A-E-Walsby, A-Avery and ESdunz
where At is the area of the filter (1257 mm2), A, is the area of the image field (2.704 mm2) and V, is the volume of lake water filtered.
An estimate of the biovolume of the P.rubescens population can be made by multiplying the filament length by the mean cross-sectional area of the Plank-tothrix filaments (AP); the mean diameter determined by microscope measure-ments was 5.7 ± 0.5 urn, giving AP equal to 25.6 um2.
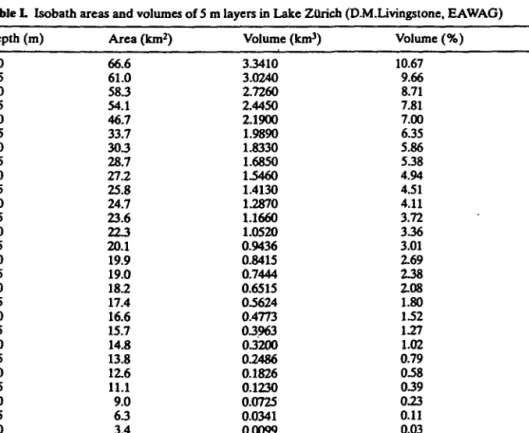
The areal concentration of filament volume (in cm3 m~2; i.e. the total filament volume in the water column, per unit area of water surface) was calculated by integration of the values over the sampling depth. The total filament volume in the lake was calculated by multiplying the mean areal concentration at each 5 m depth interval by the volume of each 5 m layer of the lake (Table I).
Measurements on gas vesicles and buoyancy
The critical pressure distributions of gas vesicles in the cyanobacteria were measured with a pressure nephelometer, modified from the design described by Walsby (1973), at pressures up to 2 MPa. Cell turgor pressure (pt) was determined from the difference between the mean critical pressure (pc) of gas vesicles in fila-ments suspended in water containing 5 mM K2HPO4 and 0.5 M sucrose, and the
Table L Isobath areas and volumes of 5 m layers in Lake Zurich (D.M.Livingstone, EAWAG)
Depth (m) 0 5 10 15 20 25 30 35 40 45 50 55 60 65 70 75 80 85 90 95 100 105 110 115 120 125 130 135 136 Area (km2) 66.6 61.0 58.3 54.1 46.7 33.7 303 28.7 27.2 25.8 24.7 23.6 223 20.1 19.9 19.0 18.2 17.4 16.6 15.7 14.8 13.8 1Z6 11.1 9.0 6 3 3.4 0.5 0.0 Volume (km3) 3.3410 3.0240 2.7260 2.4450 2.1900 1.9890 1.8330 1.6850 1.5460 1.4130 1.2870 1.1660 1.0520 0.9436 0.8415 0.7444 0.6515 0.5624 0.4773 03963 03200 0.2486 0.1826 0.1230 0.0725 0.0341 0.0099 0.0002 0.0000 Volume (%) 10.67 9.66 8.71 7.81 7.00 635 5.86 538 4.94 4.51 4.11 3.72 336 3.01 2.69 238 2.08 1.80 1.52 1.27 1.02 0.79 0.58 039 0.23 0.11 0.03 0.00
Gas-vacuolate cyanobacteria in Lake Zurich
apparent mean critical pressure (pa), in cells suspended in either lake water or culture medium (Walsby and Bleything, 1988).
The buoyancy state and presence of gas vacuoles were determined in P.rubescens filaments that had been concentrated by filtration from 11 samples of lake water and resuspended in 5 ml of 5% (v/v) neutral formaldehyde (in March 1995) or lake water (March 1997). The buoyancy state was determined by count-ing those filaments that floated under the coverslip and those that sank onto the platform of a haemocytometer (Walsby and Booker, 1980). The presence of gas vacuoles was determined by comparison of the appearance of filaments under the light microscope before and after application of a pressure of 1.4 MPa.
Results
Seasonal changes in the vertical distribution of Planktothrix rubescens
Series of depth samples were taken on 27 occasions at approximately monthly intervals over the period of 24 March 1993 to 26 June 1995. From the filament-volume concentrations at each depth were calculated the profiles of vertical distri-bution of the P.rubescens population in the lake (Figure 1). The main aim was to determine the depth distribution of the population during the growth period and the subsequent period of winter mixis, but information was also collected on the total filament volume throughout the water column to the lake bottom at 136 m, which was calculated by integration using the trapezoidal rule (Figure 2). The annual cycle
1. Increase to the summer maximum. The areal concentration of the P. rubescens population was at a minimum value in mid-May to early June of each year; it was 7.9 cm3 nr2 in 1993,1.7 cm3 nr2 in 1994 and 0.3 cm3 nr2 in 1995 (Figure 2). No significance can be attached to the differences in these values because it is not known whether the true minimum value occurred at the sampling date. The popu-lation then showed a rapid increase over the period up to early September when it reached a total areal concentration of -60 cm3 nr2 in 1993 and 1994 (Figure 2). Again, the intervals of sampling depth and time are too wide to determine the date and value of the maximum precisely; in particular, it is noted that during periods of thermal stratification the main peak of the population could occur at a depth several metres from the nearest sampling depth and that the size of the population could then be substantially underestimated. In a subsequent study (Micheletti et al., 1998), samples were taken at 1 m depth intervals around the metalimnetic maximum of P.rubescens to provide more detail of the vertical distribution.
During this main growth period, the population formed a maximum at a depth of -10 m. On 30 August 1994, samples taken at 2 m depth intervals showed the peak to be at 8 m. Throughout the months of June-August, the concentration of filaments in the surface samples was always much lower than that in the metalimnion. This sort of distribution can be explained by the combination of buoyancy regulation and phototrophic growth at the depth of the population 1361
A.E.Walsby, A_Avery and ESchanz
ui/qjdap
Gas-vacuolate cyanobacteria in Lake Zfiricb
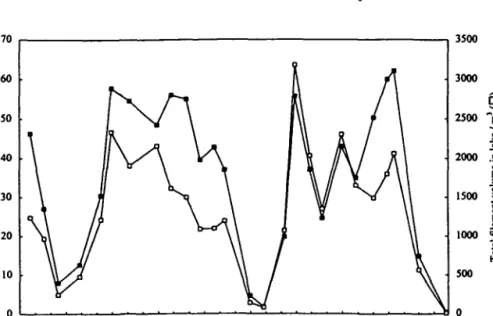
3500
Mar-93 Jun-93 Scp-93 Dec-93 Mar-94 hm-94 Sep-94 Dec-94 Mn-95 Jun-95
Fig. 2. Integrated values over the 2 year sampling period 24 March 1993 to 26 June 199S of ( • ) areal concentration of the Alament volume throughout the water column at the deepest point of Lake Zurich; (D) total filament volumes in the whole lake, calculated with the assumption that the concen-trations are uniform over the lake area.
maximum. Throughout this summer period, the difference in temperature between the surface layer and 8 m exceeded 4°C; the strong thermal gradient prevented mixing to this depth, providing the stability necessary for the mainten-ance of the sub-surface population peak.
During the summer period, a small proportion of the population persisted in the hypolimnion. This proportion decreased steadily during the summer months; the decrease was more rapid in 1994 and by the beginning of August little was left in the hypolimnion (Figure 3).
2. The autumnal and winter mixing. The cooling of the surface layer resulted in a shallower temperature gradient in September the daytime temperature differ-ence between 0 and 10 m was only 1.4°C on 1 September 1993 (Figure 4); at night, convective cooling of the water surface would have caused mixing of the near-surface layers (Spigel and Imberger, 1987) and this would explain the appearance by entrainment of some filaments into the surface mixed layer. On 6 October 1993, the temperature difference between 0 and 10 m was only 0.2°C, indicating that surface mixing had penetrated to the population peak; by the end of the month (25 October 1993), the Planktothrix population had become completely entrained. The depth of the surface mixed layer continued to increase and the original metalimnetic population was uniformly distributed through this pro-gressively deepening layer, but without significantly entering the receding hypolimnion (compare profiles of filament concentration and temperature on 25 October 1993 and 29 November 1993). The depth of mixing extended rapidly and by 28 December 1993 had penetrated to nearly 100 m; in early 1994, mixing
A-E.Walsby, A~Avery and EScfaanz
Msr-93 0
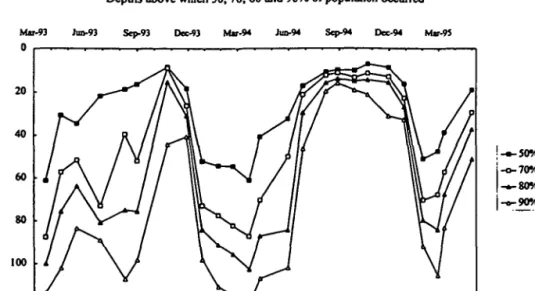
Depths above which SO, 70, 80 and 90% of population occurred
iim-93 Scp-93 Dec-93 Mv-94 Juo-94 Scp-94 Dcc-94 Mar-95
|-a-S0% j -o-70%
l-o-90%
Fig. 3. The depths above which SO, 70, 80 and 90% of the P.rubescens population were present in Lake Zurich from the spring of 1993 to 1994.
reached the lake bottom. The water column then remained isothermally mixed and the Planktothrix population was uniformly distributed to the lake bottom until the end of March 1994, as it had been in the previous year (Figure 1).
The winter of 1994-5 was milder (mean air temperatures for January-February were 2.7°C in 1994 and 4.1°C in 1995) with the consequence that the cooling and mixing of the lake was considerably delayed (Figure 4). Thus, while 50% of the population had been mixed below 52 m by the end of December 1993,50% had been mixed to only 16 m by the end of December 1994. Both the extent and duration of deep mixing were much less in the 1994-5 winter (Figure 3). The significance of this for natural selection of gas vesicles is that a smaller propor-tion of the filaments in the populapropor-tion would have been circulated to depths where the hydrostatic pressure collapsed their gas vesicles. More of the filaments would have remained buoyant and, in particular, more of the filaments with weaker gas vesicles would have been able to float up when the lake restratified in spring (see below).
3. The persistence of filaments during the winter. A remarkable result of the study is the demonstration that a large proportion of the filament population persisted from the time of the late-summer maximum (1 September 1993) until the follow-ing sprfollow-ing. By integratfollow-ing the filament concentration throughout depth, it is calcu-lated that >90% of the filaments persisted until the end of January 1994 and over 70% until the end of March 1994 (Figure 2). In making this calculation, based on simple integration down the water column, no account is taken of lateral mixing. If lateral dispersion occurs, then allowance must be made for the different
lAp r Uu l lOc t 1 Ja n 9 4 1 Ap r 1 Ju l 1 Oc t 1 Ja n 9 5 1 Ap r 1 Ju l Fig . 4 . Th e vertica l distributio n o f temperatur e i n Lak e Zuric h fro m Marc h 199 3 t o Jun e 1995 . Th e isotherm s fo r 5,6,7 , 8,10,15,2 0 an d 25° C ar e shown .
A.E.Walsby, A.Avery and ESchanz
volumes of water at the different depths in the lake (Table I). With complete lateral dispersion, the total quantity in the lake is calculated as the sum of the
products of CL in each layer and the volume of lake water in each layer, from
Table I. It is then calculated that 64% persisted until the end of January 1994 and 47% until the end of March 1994 (Figure 2). Since lateral mixing would not have been complete, the true percentages must lie between these values and those given above. The changes in total biovolume were broadly similar in 1994-5 despite the differences in vertical distribution.
4. Upward movement of filaments in spring. By mid-April in each year, there was warming of the surface layer, bringing stability to the water column. The total integrated filament volume down the water column showed a slight decrease between 23 March 1994 (43 cm3 m"2) and 12 April 1994 (37 cm3 nr2); throughout the top 35 m of the water column, however, there had been an increase in fila-ment concentration, which was matched by a corresponding decrease at depths of 40 m and below. This redistribution of the population can therefore be explained by the upward movement of buoyant filaments as stability returned to the water column.
In the spring of 1995, an upward redistribution could also be seen from the population profile, which remained skewed towards the surface throughout the winter period.
5. Filament losses in late spring. Between April and June, the P.rubescens popu-lation decreased by two orders of magnitude; the decrease was particularly marked in the near-surface layers. Similar losses occurred in the corresponding periods in 1993 and 1995. They correspond to the 'clear water phase' observed in many freshwater lakes, attributed to zooplankton grazing (Bleiker and Schanz, 1989; Lampert and Sommer, 1993). The predation of the P.rubescens population has not been studied and the cause of these losses is therefore unknown. In each of the years, only a small population remained in late spring, forming a peak at 15-20 m; it is not known whether this was a remnant of the earlier peak or comprised filaments that had been recruited from other depths.
In the period of August-November 1995, following this study, it was demon-strated that P.rubescens formed a major component of the phytoplankton in Lake Zurich, accounting for between 50 and 85% of the chlorophyll a in the top 20 m of the water column (Micheletti et al., 1998). It accounted for >50% of the phyto-plankton biomass throughout the winter period until its decline in the spring, when diatoms and cryptomonads formed the major populations (data from City of Zurich Water Supply).
Viability of filaments
Cultures were set up from 20 single filaments selected from a water sample taken at the water surface on 19 February 1993; 17 of the filaments grew to produce cultures. Since not all viable filaments would necessarily have grown, this suggests that >85% were viable in this sample. More samples are needed to determine the viability in the lake population.
Gas-vacuolate cyanobacteria in Lake Zurich
The filaments in the 17 cultures showed some variation in width, pigmentation and gas-vesicle critical pressure; 10 of the cultures are being maintained in the Limnological Station of the University of Zurich, at Kilchberg, and three of these, selected for their contrasting features, have been deposited at the CCAP, Insti-tute of Freshwater Ecology, Ambleside, UK (Table II). The other seven cultures were discarded: five appeared to be identical to strains that were kept; two were discarded because of poor growth and heavy bacterial contamination.
An attempt was made to establish a collection of representative cultures from the summer population at a depth of 8 m in the metalimnion on 30 August 1994. The filaments in samples from this depth appeared uniform, of red-brown colouration and 6 um width. Cultures were established from only two of the 24 filaments selected (Table II), but it is suspected that others were lost through adverse incubation conditions; no inferences can be drawn on their viability. Critical pressures of gas vesicles
1. From the winter population. The mean critical pressure of the gas vesicles in a sample of cyanobacteria (filaments in hypertonic sucrose) taken from the lake on 19 February 1993, but not analysed until 13 days later, waspc = 1.04 MPa. The
mean apparent critical pressure (filaments suspended in water) was pa = 0.91
MPa, and the turgor pressure was therefore only 0.13 MPa. This is a low value for turgor in freshwater cyanobacteria; the turgor pressure may have decreased
Table II. Some characteristics of the strains of P.rubescens isolated from Lake Zurich water samples
taken on 19 February 1993 and 30 August 1994 Strain number BC Pla 9301 9302 9303 9304 9305 9306 9307 9308 9309 9310 9311 9312 9316 9317 9318 9319 9320 9401 9402 CCAP 1459/40 1459/41 1459/42 Filament width (Mm) 7 7 4.5 6 8 7 5 6 6 4.5 6 7 8 7 6 7 8 6 6 Culture habit and colour
Red-brown even suspension Red-brown clumped suspension Pink even suspension
Red-brown even suspension Brown even suspension Dumped olive suspension Stringy pink suspension Clumped brown suspension Clumped olive suspension Pink even suspension Olive clumps Red-brown filaments Olive brown suspension Olive brown suspension Olive brown Dark brown Weak greenish Brown suspension Brown suspension Gas vesicle Pc(MPa) 1.02 0.98 0.98 0.96 0.94 0.96 0.96 1.02 0.90 1.08
No growth occurred in cultures 13,14 and 15. Cultures in bold type were kept; others discarded. The state of the suspension was probably affected by bacterial contaminants.
A.E.Walsby, A^Avery and RSchanz
during the prolonged exposure to low irradiance in the lake and during the subse-quent storage.
It is useful to have a term to describe the depth at which the hydrostatic
pres-sure, ph, generates a pressure equal to pa, as at this pressure turgid cells,
suspended in water, lose half their gas vesicles and are unlikely to remain buoyant; we refer to this as the critical pressure depth, zp:
where p is the density of water (999.96 kg nv3 at 5°C) and g is the gravitational acceleration (9.808 m s"2 at Lake Zurich). Hence, when pa is 0.91 MPa, zp is 92.8 m.
Mean critical pressures (pc) in the strains of P.nibescens isolated in 1993 varied over the range 0.90-1.08 MPa with a mean for all strains of 0.976 MPa (see Table II and Figure 5). Gas vesicles would have survived intact in more of the Plankto-thrix filaments with stronger gas vesicles, as they were circulated through the water column of the lake.
2. From the summer population. Measurements of gas-vesicle critical pressure distributions were made on a sample of lake water from a depth of 8 m, the popu-lation maximum: the Planktothrix filaments were concentrated by floating up in jars left standing overnight. The measurements showed a mean critical pressure (with filaments in 0.5 M sucrose) of pc = 0.97 MPa, an apparent critical pressure
"VMM
0.0 0.6 0.1 1.0
Pressure / MPa
1.2 1.6 Fig. 5. Critical pressure distributions of gas vesicles in three strains of P.rubescens isolated from the
Gas-vacuolate cyanobacteria in Lake Ziiricfa
(with filaments in lake water) of pa = 0.77 MPa, and a turgor pressure of
Pi=Pc-Pa = 0-20 MPa. It is noted that the value ofpc is similar to the mean value in the 10 strains in culture, but lower than the value found in the winter sample. The buoyancy and gas vacuole content of filaments after winter mixis
The losses of gas vesicles and buoyancy were investigated directly, towards the end of the periods of winter mixing.
In March 1995, the majority of filaments in the top 60 m were buoyant, whereas the majority below 80 m were not (Figure 6a). The vertical distribution of fila-ments indicated that the water column was not completely mixed to the lake bottom; this is confirmed by the temperature profile (Figure 4). It is calculated, however, that only 78% of the filaments in the top 80 m were buoyant and this suggests that some (but <22%) of the filaments in the top 80 m of the water column had at some time been circulated to depths greater than the mean
criti-cal pressure depth, zp- (The slightly lower proportion buoyant in the surface
sample may indicate buoyancy loss in response to exposure to the higher irradi-ance there; see Utkilen et al, 1985; Oliver, 1994.) The marked decrease in buoy-ancy of filaments collected at depths of 80 m indicated that >75% of the filaments there had at some point been circulated below zp (perhaps at 93 m). Surprisingly, a few filaments retained their buoyancy in samples from depths of 100 and 120 m.
20
% filaments floating (D) or without gas vacuoles (O)
40 60 80 ' 100 t 0 20 40 60 80 00 120 140 20 40 / / (A / /
1 1
b 0.6 0.8 1.0 1.2 o.O 0.1 Filament concentration / cm' m"' ( • ) 0.3Fig. 6. (a) The vertical distributions of filament-volume concentration (•), the percentage of
fila-ments with positive buoyancy ( • ) , and the percentages of filafila-ments without gas vacuoles (O), on 14 March 1995. (b) The vertical distributions of filament-volume concentration ( • ) and the percentage of filaments with positive buoyancy (D), on 18 March 1997.
A.E.Waisby, A.Avery and RScham
No direct investigations of filament buoyancy were made in 1993 or 1994, but an investigation was made on 18 March 1997, at the end of another cold winter, during which the filaments had similarly been uniformly distributed to the lake bottom. The percentage of filaments that retained buoyancy was much lower throughout the water column; only 25% were buoyant in the top 80 m and even within the top 20 m only 42% floated (Figure 6b). A much greater proportion of the population in the surface layers must therefore have been circulated to depths exceeding zp.
In the sample of 14 March 1995, an estimate was made of the proportion of fila-ments without gas vacuoles: it increased from - 3 % in samples from the top 60 m to 100% from the deepest sample (Figure 6a). Cyanobacterial cells appear to be devoid of gas vacuoles when 95% of the constituent gas vesicles are collapsed (Walsby, 1985). This proportion is collapsed in turgid cells from the lake by a hydrostatic pressure of 1.2 MPa, which would occur at a depth of 122 m. A small proportion of the filaments at 120 m retained some gas vacuoles, and -10% of them retained sufficient to provide buoyancy (Figure 6a). This indicates that there are strains of Planktothrix in the lake with stronger gas vesicles than those in any of the isolated strains (Table II).
There were many more filaments without gas-vesicles in the 18 March 1997 samples, but again some gas-vacuolate filaments were present at 120 m; an attempt is being made to culture them.
Discussion
Natural selection of gas-vesicle critical pressure
The critical pressure of the gas vesicles in all of the strains of P.rubescens isolated from Lake Zurich (>0.9 MPa; see Table II) is greater than that required to
with-stand the 0.4 MPa combination of turgor pressure (px = 0.2 MPa) and hydrostatic
pressure at the depths to which the organism is distributed during the summer growth period (ph = 0.2 MPa at 20 m). Natural selection for high critical pressure must therefore occur at some other time of the year. It is proposed that the selec-tion occurs during recruitment to the spring inoculum in the metalimnion, after filaments have been circulated down by mixing during the winter.
The maximum useful critical pressure for organisms in Lake Zurich is given by
the sum of turgor pressure (pt = 0.2 MPa) and hydrostatic pressure at the lake
bottom (ph = 1.33 MPa at 136 m), a total of pc = 1.53 MPa; this would enable all filaments to float up and contribute to the spring inoculum. If there were no other constraints on critical pressure, this would be the (minimum) critical pressure expected. The lower values of pc (0.9-1.1 MPa) in all of the strains isolated from Lake Zurich suggest that the extra benefits of having gas vesicles with apc as high as 1.53 MPa does not repay the additional costs of making them. An attempt is made to explain this.
The benefits of making stronger gas vesicles
The benefits of making stronger gas vesicles can be determined from the additional numbers of filaments that would be recruited to the P.rubescens
Gas-vacuolate cyanobacteria in Lake Zurich
population in the following season, and the relative contribution they would make to the final population. There are several complicating factors here, which are considered in turn. In all of these cases, it is assumed that the filaments have a turgor pressure of 0.2 MPa and that they lose their buoyancy at pressures exceeding the mean pc.
1. The water column fully mixed to the bottom. First, assume that, during winter, filaments are mixed uniformly down to the lake bottom, but none are mixed back up again (in practice, an impossibility). Assume also that at the end of winter mixing all buoyant filaments float back to the epilimnion and contribute equally to the summer population. A strain A, with the lowest pc of 0.90 MPa (Table II),
would remain buoyant at depths down to a zp of 70 m; only 51% (= 70 m/136 m)
of the population in the water column would remain buoyant and float up. For a strain B, with the highest pc of 1.08 MPa (Table II), zp would be 90 m and 66% would remain buoyant. If the filaments were mixed horizontally over the lake, the percentage of filaments retaining buoyancy would be equal to the percentage of lake volume above the critical pressure depths: 85% above 70 m for strain A, 94% above 90 m for B (Table I).
2. Partial recirculation from below the critical pressure depth. Some of the fila-ments mixed below the critical pressure depths must be recirculated back to shal-lower layers during the winter period, adding to the buoyancy losses considered in (1). These losses will increase with the depth, duration and speed of mixing, which vary from year to year, and will decrease with increasing values of pc. The probability of a filament circulating to the greatest depth within a given time will increase with its proximity to the deepest part of the lake.
Some information on the outcome of circulation is given by the observations on the vertical distributions of filament abundance and buoyancy state in March 1995 and March 1997 (Figure 6). The percentage of the total population in the water column that retained buoyancy in each depth interval (of 5 m) can be
calcu-lated as 10QNzF/LN, where Nz is the filament volume in the 5 m depth interval
below depth z, T.N is the volume in the whole water column, and Fis the propor-tion of filaments in the depth interval that are buoyant. These values are plotted in Figure 7a. The overall percentage of the total filaments that were buoyant is
calculated as 100I.(NZF)/LN by integration at 5 m intervals. In March 1995,70%
of the filaments in the whole column were buoyant; in March 1997, only 22% remained buoyant.
If complete horizontal mixing is assumed, the percentage of filaments in the whole lake that were buoyant is calculated in a similar manner except that the quantity of filaments in each 5 m layer is calculated by multiplying Nz by Vz, the proportion of the total lake volume in the depth interval (Table I): the percent-age of total filaments in the lake that were buoyant is then 75% in March 1995 and 29% in March 1997. Of the filaments that retained buoyancy on 14 March 1995, it is noted that only 2.4% of them occurred at depths below 70 m, and only 0.4% occurred below 90 m (Figure 6c).
These analyses reveal the large differences in the proportions of the spring 1371
A.E. Walsby, A.Avery and EScfaanz
% total filaments buoyant in water column % total filaments buoyant in whole lake
0 I 2 3 4 5 6 0 1 2 3 4 5 6 7 8 9 10 20 40 60 SO 100 120 140 L Much 1997 V 20 40 60 SO Much 1997 - x ^ ^^g**-^ / jP Math 1995
r
100 X 120 I 140 ' bFig. 7. (a) The percentage in 5 m layers of the total filament biomass in the water column that were buoyant ( • ) on 14 March 1995 and ( • ) 18 March 1997. (b) The percentage in 5 m layers of the total filament biomass in the whole lake volume that were buoyant.
population that remain buoyant in different years, 22-70% (for the water column) and 29-75% (for the lake), after different degrees of winter mixing. A higher proportion of the filaments with stronger gas vesicles would have retained buoyancy in March 1997. They would have accounted for all of the buoyant
fila-ments below the minimum zp (i.e. for the weakest gas vesicles), and they would
also have formed a greater proportion of the buoyant filaments in the near-surface layers, after recirculation from depths below the minimum zp.
3. Time to float up during the stratification period. The percentages of buoyant filaments indicate the maximum proportions of the population that would have been able to float up and form the inoculum for the next season's growth. The next step is to estimate the proportion of these floating filaments that were likely to float up.
Based on measurements made on other filamentous cyanobacteria (Davey and Walsby, 1985) and preliminary investigations on P.rubescens strain 9303 (P.A.Davis, D.A.Cole-Powney and A.E.Walsby, unpublished), the floating vel-ocity of fully buoyant Planktothrix filaments is unlikely to exceed 1 m day1. At this speed, it would take -4 weeks for a filament to float up from a depth of 40 m
to the epilimnion at 10 m, 12 weeks to float up from a zp of 93 m, and, for any
forms with exceptionally strong gas vesicles, over 19 weeks to float up from 135 m near the lake bottom (Table II).
If stratification started at the beginning of April and growth continued until the end of August (5 months), then a filament that was present in the epilimnion in
Gas-vacnolate cyanobacteria in Lake Zurich
April and doubled once per week would pass through 22 generations and leave a progeny of I?2 or 4 million. A filament that joined the epilimnion only after 12 weeks, which it takes to float up from the zp at 93 m, would pass through only 10 generations and leave a progeny of -1000: the genotype that specifies its stronger gas vesicles would therefore represent only 1/4000 of the next overwintering population. The corresponding value is 1/500 000 for the filament recruited after 4 months floating up from the lake bottom. In summary, the contribution that buoyant filaments make to the eventual population decreases exponentially with their depth at the time of stratification in spring. Because of this, the increasing proportion of buoyant filaments that have stronger gas vesicles at increasing depths make little contribution to natural selection of this character. This is, however, mitigated by losses in the epilimnetic population.
4. Consequences of filament losses in the epilimnion in May-June. In the period of late May to early June of each year, the P.rubescens population decreased by 90-99%. The nature of the loss is not known. If the loss were specific to the popu-lation concentrated in the metalimnion, part of the advantage gained by the early colonizers there would have been lost. If, for example, losses of 90% occurred in mid-June, after 7 weeks of growth, only 13 of the 128 progeny would remain and one additional filament, recruited after 6 weeks of floating up from a depth of 50 m, would then form 7% of the total population. This would increase the advan-tage of producing stronger gas vesicles.
5. Consequences of gas vesicle reformation. Filaments that have lost their buoy-ancy may regain it by producing new gas vesicles; in fact, collapse of existing gas vesicles stimulates further production (Hayes and Walsby, 1984). Studies with Microcystis sp., however, show that gas vesicle production in darkness or very low irradiances is limited; sufficient production to support the regaining of buoyancy requires light for photosynthesis (Deacon and Walsby, 1990). Effectively, this limits buoyancy regain to the euphotic zone, which may extend to 15 m or more in Lake Zurich (Micheletti et al, 1998). Once stratification occurs, only those fila-ments that remain in the epilimnion for long enough to make sufficient gas vesicles will be able to recover their buoyancy. In the regions of the lake that are shallower than the euphotic depth (19% of the area is <15 m deep; Table I), all of the filaments may be able to recover their buoyancy.
6. Summary of benefits of stronger gas vesicles. It can be concluded that during recruitment to the metalimnion in the spring there will be a rise in the propor-tion of strains with stronger gas vesicles, and this will increase with the extent and duration of winter mixing. The new population will develop principally from fila-ments that happen to be present towards the top of the water column when the lake restratifies in spring. The selection of strains with strong gas vesicles occurs here because a significant proportion of these filaments are recirculated from depths that exceed the critical pressure depths. In the selection for gas vesicles of increasing strength, however, the law of diminishing returns will operate because 1373
A.E. Walsby, A^Avery and EScfaanz
the volume of each layer decreases with depth and the probability of a filament mixing further down decreases with depth.
It has been suggested that strains of cyanobacteria with wide gas vesicles may grow faster than strains with narrower gas vesicles because they need invest less of their protein in gas vesicle production to obtain buoyancy (Walsby, 1994). During its main growth period in the summer and autumn in Lake Zurich, P.rubescens is restricted largely to the top 20 m of the water column, in which even the weakest gas vesicles would survive. During this period, there may be a counter-selection for strains with weaker gas vesicles. The proportions of the different strains would therefore be expected to change during the yearly cycle and in different years, depending on factors affecting growth and mixing depth. To obtain information on the selection process, it would be necessary to deter-mine the proportions of different strains present after winter mixing, during the spring recruitment and after the summer growth periods. The different strains might be identified by isolating single filaments and amplifying specific DNA sequences that characterize them, using the techniques described by Hayes and Barker (1997).
Acknowledgements
We wish to thank Angela Mechsner, Dr Steven Beard, Jacqueline Corves, Claudia Lehmann and Silvia Micheletti for assistance in the lake sampling, and Dr Barbara Handley for assistance with image analysis. We also thank Tim Colburn for redrawing Figures 1 and 4. This work was supported by grants (GR9/1201 and GR3/10790) from the Natural Environment Research Council.
References
Anagnostidis,K. and KomarekJ. (1988) Modern approach to the classification system of cyanophytes. 3—Oscillatoriales. Arch. Hydrobioi, 80(SuppL), 327-472.
Bleiker.W. and SchanzJ7. (1989) Influence of environmental factors on the phytoplankton spring
bloom in Lake Zurich. Aquai. Sci., 51,47-58.
Davey,M.C. and Walsby.AE. (1985) The form resistance of sinking algal chains. Br. PhycoL J., 20, 243-248.
Deacon.C. and Walsby,A.E. (1990) Gas vesicle formation in the dark and in light of different irradi-ances, by the cyanobacterium Microcystis sp. Br. PhycoL /., 25,133-139.
HayesJ'.K. and Barker,G.L.A. (1997) Genetic diversity within Baltic Sea populations of Nodularia (cyanobacteria). / PhycoL, 33,919-923.
HayesJP.K. and Walsby,A.E. (1984) An investigation into the recycling of gas vesicle protein derived from collapsed gas vesicles. J. Gen. MicrobioL, 130,1591-1596.
HayesJ'.K. and WalsbyA-E. (1986) The inverse correlation between width and strength of gas vesicles in cyanobacteria. Br. PhycoL J., 21,191-197.
KutschkeJ. (1966) Die thermischen Verhaltnisse im ZOrichsee zwischen 1937 und 1963 und ihre Beeinftussung durch meteorologische Faktoren. Vierteljahrssch. Naturforsch. Ces. Zurich, 111,
47-124.
Lampert,W. and Sommer.U. (1993) Limnookologie. Georg Thieme Verlag, Stuttgart, 439 pp. Micheletti^., SchanzJ. and Walsby,A.E. (1998) The daily integral of photosynthesis by Planktothrix
rubescens during summer stratification and autumnal mixing in Lake Zurich. New PhytoL, 138, in
press.
Oliver.R.L. (1994) Floating and sinking in gas-vacuolate cyanobacteria. J. PhycoL, 30,161-173. Orn.C.G. (1980) Die Sauerstoffverhaltnisse im Zurichsee (Untersee) von 1937 bis 1975 und ihre
Gas-vacuolate cyanobacteria in Lake Ziiricfa
Pavoni,M. (1%3) Bedeutung des Nannoplanktons im Vergleich zum Netzplankton. Schweiz. Z.
Hydrol., 25,220-341.
Pfeffinger,A. (1902) Beitrage zur Biologie des Zurichsees. Dissertation, University of Zurich, Lepzig, 61pp.
Schanz^. (1994) Oligotrophication of Lake Zurich as reflected in Secchi depth measurements. Ann.
Limnol., 30, 57-65.
Schanz,F. and Thomas,E.A. (1981) Reversal of eutrophication in Lake Zurich. WHO Water Qual
Bull, 6,108-112.
SoracreppaJ3- (1978) Jahreszeitliche Veranderungen von Wasserchemismus und Phykozonosen in zehn Seen der Umgebung von Zurich. Vierteljahrssch. Naturforsch. Ces. Zurich, 123,161-235. Spigel.R.H. and ImbergerJ. (1987) Mixing processes relevant to phytoplankton dynamics in lakes. N.
Z. J. Mar. Freshwater Res., 21, 361-377.
ThomasJE.A. (1949) Sprungschichtneigung im ZUrichsee. Schweiz. Z. Hydrol., XX, 527-545. ThomasJE.A. (1950) Auffallige biologische Folgen von Sprungschichtneigungen im ZUrichsee.
Schweiz. Z. Hydrol., 12,1-24.
Thomas.E.A. and Marki.E. (1949) Der heutige Zustand des Zurichsees. Mitt. Int. Ver. Limnol, 10, 476^88.
UtkilenJiC, Oliver,R.L. and WalsbyA-E- (1985) Buoyancy regulation in a red Oscillatoria unable to collapse gas vacuoles by turgor pressure. Arch. HydrobioL, 104,407-417.
Wakby^A.E. (1971) The pressure relationships of gas vacuoles. Proc. R. Soc. London Ser. B, 178, 301-326.
Walsby,A.E. (1973) A portable apparatus for measuring relative gas vacuolation, the strength of gas vacuoles, and turgor pressure in planktonic blue-green algae and bacteria. Limnol Oceanogr., 18, 653-658.
WalsbyA-E. (1985) The permeability of heterocysts to the gases nitrogen and oxygen. Proc. R. Soc.
London Ser. B, 226, 345-366.
Walsby,A.E. (1994) Gas vesicles. Microbiol Rev., 58,94-144.
Walsby,A.E. and Avery,A. (1996) Measurement of filamentous cyanobacteria by image analysis. /
Microbiol Methods, 26,11-20.
Walsby^A.E. and Bleything.A. (1988) The dimensions of cyanobacterial gas vesicles in relation to their efficiency in providing buoyancy and withstanding pressure. J. Gen. Microbiol, 134, 2635-2645. WalsbyAE. and Booker.M J. (1980) Changes in buoyancy of a planktonic blue-green alga in response
to light intensity. Br. Phycol J., 15,311-319.
Walsby^A-E., Utkilen,H.C. and Johnsen.1 J. (1983) Buoyancy changes of a red coloured Oscillatoria
agardhii in Lake Gjersj0en, Norway. Arch. Hydrobiol, 97,18-38.
Received on July 20,1997; accepted on March 11,1998