By Kathrin H. Fischer1, Ingo Fischer1 ,∗, and Andras Bodi2 1
Institut für Physikalische und Theoretische Chemie, Universität Würzburg, Am Hubland, 97074 Würzburg, Germany
2Paul-Scherrer-Institut, 5232 Villigen, Switzerland
This paper is dedicated to Wolfgang Kiefer on the occasion of his 70thbirthday (Received November 26, 2010; accepted in revised form February 11, 2011)
NTCDA / Ionization Energy / Gas Phase / Threshold Photoelectron Spectrum / Synchrotron Radiation
The threshold photoelectron spectrum of NTCDA (1,4,5,8-naphthalene-tetracarboxylic dianhydride) has been recorded using synchrotron radiation. An ionization energy of 9.66 eV was observed. The experiments are supported by DFT computations that yield a value of 9.51 eV, in good agreement with the measured value. Several bands corresponding to excited electronic states of the cation are also visible and can be assigned with the aid of computations.
1. Introduction
Molecules with conjugatedπ-electron systems are investigated as potential building blocks for optoelectronic materials. A molecule that awoke particular interest is 1,4,5,8-naphthalene-tetracarboxylic dianhydride, abbreviated NTCDA. Its structure is depicted in Fig.1. NTCDA is for example employed in solar cells [1], in thin film transis-tors [2] and in humidity sensors [3]. Its molecular properties are thus of considerable interest. Electron affinities (EA) and ionization energies (IE) are among the most im-portant quantities in describing and understanding charge transfer processes. NTCDA has therefore been a subject of studies in a number of research groups. Most investiga-tions so far focused on the chemistry and physics of thin films deposited on surfaces. In a number of experiments NTCDA was deposited on a Ag(1,1,1) surface and investi-gated by X-ray absorption and photoemission [4–7]. Thin films on a Au substrate were also studied by photoelectron spectroscopy and an IE of 8 eV was reported [8].
The energy-transfer properties of molecules, which are relevant for understanding material characteristics, are often described solely based on computations. However, in
716 K. H. Fischer et al.
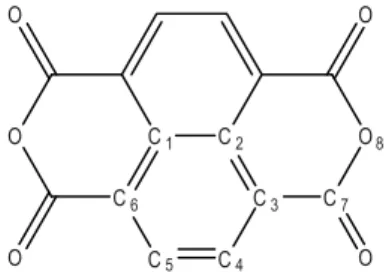
Fig. 1. The structure of NTCDA. The numbering of the atoms is chosen to facilitate the comparison with calculations and does not follow IUPAC conventions.
order to benchmark such calculation methods, they need to be compared with experi-mental results on isolated molecules. Despite the interest in NTCDA, to the best of our knowledge no gas phase data are available and even the ionization energy of the isolated molecule is not known. This is most likely due to the difficulty to generate a sufficient vapor pressure for gas phase experiments. It is thus the aim of the present study to measure a reliable IE of isolated NTCDA.
Synchrotron radiation provides broadly tunable light and has shown to be well suited to investigate molecular photoionization in the gas phase, in particular when no previous information is available and a large energy region has to be explored. In the past we have reported ionization and appearance energies of reactive intermediates, like radicals and carbenes [9–11]. Other groups investigated the photoionization of clus-ters [12] and biological molecules [13–15] also using synchrotron radiation.
2. Experimental
The experiments were carried out at the VUV beamline of the Swiss Light Source [16] at the Paul Scherrer Institut (PSI) in Villigen, Switzerland. The X04DB bending mag-net provides synchrotron radiation, which is collimated and sent to a plane grating monochromator with a 600 grooves mm−1grating. The monochromator has a resolving power of ideally 104. A rare gas filter operated with a mixture of 60% Ne, 30% Ar and
10% Kr at a pressure of 10 mbar suppresses the higher harmonic radiation above the Kr ionization edge. The photon energy was calibrated using the well known 11–13 s’ res-onance lines of argon in the first and second order. A flux of 1011photons/s has been
reported for this beamline.
Experiments were performed in a differentially pumped vacuum chamber em-ploying a supersonic molecular beam apparatus [17,18]. The iPEPICO (imaging photoelectron/photoion coincidence) technique was employed to study the photoion-ization of NTCDA. The technique enables the mass selective detection of threshold photoelectrons by detecting them in coincidence with ions. The spectrometer com-bines a Wiley-McLaren time-of-flight (TOF) mass spectrometer [17] and a velocity map imaging photoelectron spectrometer. The latter is equipped with a position sen-sitive detector with a delay line anode (Roentdek DLD40). Threshold electron energy resolution can be better than 1 meV, but in order to maximize signal-to-noise, electrons
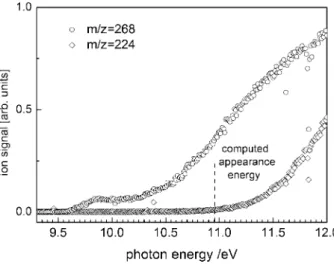
Fig. 2. Ion yield spectrum of NTCDA. The molecular ion signal (open circles) increases above 9.6 eV. A fragment signal (m/z = 224, open diamonds) originating from dissociative photoionization appears above 11 eV.
were selected with an energy resolution of 5 meV. The contribution of hot background electrons was subtracted following the method outlined by Szt´aray and Baer [19].
A flange with a molecular beam source was attached to the vacuum chamber. Around 40 mbar of argon was flowing through an oven and expanded through a 0.1 mm pinhole mounted at the end. NTCDA was commercially obtained from Sigma Aldrich and used without further purification. The sample was placed in the oven and heated to 280◦C to obtain a sufficiently high vapor pressure. We assume that the degree of cool-ing in the expansion is small due to the low backcool-ing pressure. The photon energy was scanned in steps of 10 meV and data were averaged for 90 s per data point. Although the photon energy resolution in the measurement energy range was 5 meV, the step size determines the experimental resolution.
3. Results and discussion
Mass spectra reveal an intense peak at m/z = 268 corresponding to NTCDA. When the total ion signal is collected as a function of photon energy one obtains the curve given by the open circles in Fig.2. As seen in the figure, ionization sets in above 9.6 eV. Around 10.5 eV the signal exhibit another rise that may be due to an excited electronic state of the cation. In addition dissociative photoionization of NTCDA is also detected above 11 eV. The observation of a signal at m/z = 224 (open diamonds in Fig.2) in-dicates that dissociative ionization corresponds to the loss of CO2. In addition a peak
at m/z = 167 appears in the mass spectrum that is most likely due to an unidentified contamination of the sample.
The threshold photoelectron spectrum can be used to further improve the accuracy of the ionization energy. Fig.3shows a spectrum in which only threshold electrons
de-718 K. H. Fischer et al.
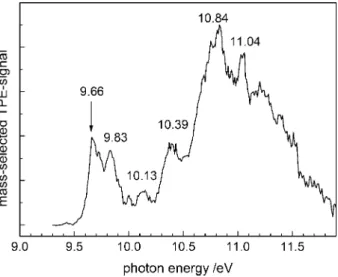
Fig. 3. Threshold photoelectron/photoion coincidence (TPEPICO) spectrum of NTCDA, smoothed by five-point averaging. Only electrons in coincidence with m/z = 268 were selected. Several bands can be tenta-tively assigned to electronic states of the cation.
tected in coincidence with m/z = 268 cations were collected. Thus it can confidently be assigned to NTCDA. As visible the first peak appears at 9.66 eV. Strictly speak-ing it corresponds to the vertical IE. However, the signal rises quickly and no peak at lower energies is visible. Therefore we conclude that the adiabatic IE is either iden-tical or very similar to the veriden-tical one. From the rise of the signal we estimate the adiabatic IE to lie within 30 meV of the peak maximum at 9.66 eV. A second peak in this band is visible at around 9.83 eV. The energy difference of 0.17 eV corres-ponds to a wavenumber of around 1370 cm−1, a value that is quite typical for a C−C vibrational mode. Aromatic molecules often show a ring expansion upon photoex-citation or ionization that is associated with the appearance of C−C stretch or ring breathing modes. However, there is no obvious higher member of a progression and computations suggest an alternative explanation, as explained below. At higher energies a number of bands are identified that can be assigned to excited electronic states of the NTCDA cation. A weak band lies at 10.13 eV, while more pronounced ones appear at 10.39, 10.84 and 11.04 eV. Above 11 eV the dissociative photoionization of NTCDA sets in.
To aid in the data interpretation electronic structure calculations were carried out using density functional theory as implemented in the Gaussian program package [20]. The 6-311++G** basis set and the B3LYP functional were employed for all calcu-lations. D2h symmetry was employed for both neutral and cation. The geometries of
the neutral and the cationic ground state were optimized and the energy difference was taken as the adiabatic ionization energy IEad. The energy difference between the
neutral and cationic ground state at the neutral ground state equilibrium geometry con-stitutes the vertical ionization energy IEvert. To compute excited electronic states of the
elec-aExcited state ionization energies are based on TD-DFT computations at the
optimized neutral geometry.
tronic states of the cation were computed at the equilibrium geometry of the neutral ground state. Vertical ionization energies for the excited state were then obtained by adding the calculated excitation energies to the calculated vertical ionization energy. The computational results are summarized in Table1.
An adiabatic IE of 9.51 eV is computed, neglecting contributions from the zero point energy. No significant geometry change upon ionization is evident from the com-putations. Consequently the calculated vertical IE lies at 9.60 eV, only slightly higher than IEad. Both values are in good agreement with the experimental IE of 9.66 eV. The
small geometry change upon ionization confirms the assumption that IEadand IEvertare
very similar. The C4−C5bond (see Fig.1for numbering of atoms) shortens by around
2 pm from 1.41 to 1.39 Å, while the C3−C4 and C5−C6 bonds increase from 1.38 to
1.41 Å. The C7−O8bond, as well as the carbonyl bonds, shortens by less than 1 pm.
In addition to the ground state a number of low-lying excited electronic states in the cation were calculated. Since these states are close in energy, a conclusive assignment is difficult. However, the computed values match the experimentally observed band pos-itions surprisingly well. A low-lying 2
B3u state has been calculated to be only 0.46 eV
higher in energy. This state constitutes an alternative assignment for the band at 9.83 eV. We consider this assignment to the 2
B3u state to be more likely than an assignment
to a cationic vibrational mode, because of the absence of higher members of the pro-gression and because we do not expect significant vibrational activity in the cationic ground state from the comparably small computed geometry change. In addition the ab-sence of hot bands in the spectrum despite the fairly high temperature indicates small Franck–Condon factors for non-diagonal transitions. For most other bands there is an electronically excited state computed within 0.1 eV of an experimentally determined band position. Only the D2Austate computed at 10.65 eV cannot readily be assigned.
However, the intense band at 10.84 eV shows a shoulder at lower energies that might correspond to this state. Although a good agreement between experimental and theor-etical values has been achieved, it should be kept in mind that the energetic order of some of the excited states might be reversed when more sophisticated computational methods are applied. The accuracy of TD-DFT calculations is estimated to be within 0.5 eV and will deteriorate with increasing excitation. Therefore the assignments should be considered with care. In addition we computed the appearance energy for the dis-sociative photoionization of NTCDA, corresponding to the loss of CO2. We obtained
a value of 10.90 eV, indicated in Fig.3. One would expect the fragment ion signal to rise at lower photon energies due to contributions from vibrationally excited molecules.
720 K. H. Fischer et al. However, the experimental fragment ion signal might experience a significant kinetic shift due to the size of the molecule.
4. Conclusion
Threshold photoelectron spectra of NTCDA in the gas phase have been recorded. A band at 9.66 eV is assigned to the adiabatic ionization energy. DFT computations yield a value of 9.51 eV, a reasonably good agreement. To the best of our knowledge no IE of isolated NTCDA has yet been reported. Only an IE of NTCDA deposited as a film on a gold surface is available. Chan et al. reported a value of 8 eV [8], signifi-cantly lower than the 9.66 eV found in our experiments. This difference shows that it is difficult to draw conclusions on the isolated molecule from surface data.
Several electronically excited states of the cation have been computed as well. The calculated energies correspond surprisingly well to bands in the photoelectron spectrum.
Acknowledgement
The experimental work reported here was carried out at the VUV Beamline of the Swiss Light Source at the Paul Scherrer Institute. Financial support by the Deutsche Forschungsgemeinschaft (DFG) in the framework of the research training school 1221 and contract FI 575/7-2 is gratefully acknowledged. A travel subsidy for K.H.F. was provided by the European Commission program “Transnational access to research in-frastructures”. The work was also funded by the Swiss Federal Office of Energy (BFE Contract Number 101969/152433). We would like to thank C. Schon, M. Schneider, and P. Hemberger for their contributions to the experiments and V. Settels for his help with the computations.
References
1. C. Falkenberg, C. Uhrich, S. Olthof, B. Maennig, M. K. Riede, and K. Leo, J. Appl. Phys. 104 (2008) 034506.
2. S. Tanida, K. Noda, H. Kawabata, and K. Matsushige, Thin Solid Films 518 (2009) 571. 3. L. Torsi, A. Dodabalapur, N. Cioffi, L. Sabbatini, and P. G. Zambonin, Sens. Actuators B 77
(2001) 7.
4. C. Stadler, S. Hansen, A. Schöll, T. L. Lee, J. Zegenhagen, C. Kumpf, and E. Umbach, New. J. Phys. 9 (2007) 50.
5. A. Bendounan, F. Forster, A. Schöll, D. Batchelor, J. Ziroff, E. Umbach, and F. Reinert, Surf. Sci. 601 (2007) 4013.
6. A. Schöll, Y. Zou, L. Kilian, D. Hubner, D. Gador, C. Jung, S. G. Urquhart, T. Schmidt, R. Fink, and E. Umbach, Phys. Rev. Lett. 93 (2004) 146406.
7. A. Schöll, Y. Zou, T. Schmidt, R. Fink, and E. Umbach, J. Phys. Chem. B 108 (2004) 14741. 8. C. K. Chan, E. G. Kim, J. L. Bredas, and A. Kahn, Adv. Funct. Mater. 16 (2006) 831. 9. T. Schüßler, H.-J. Deyerl, S. Dümmler, I. Fischer, C. Alcaraz, and M. Elhanine, J. Chem. Phys.
118 (2003) 9077.
10. P. Hemberger, B. Noller, M. Steinbauer, I. Fischer, C. Alcaraz, B. K. Cunha de Miranda, G. A. Garcia, and H. Soldi-Lose, J. Phys. Chem. A 114 (2010) 11269.
17. A. Bodi, M. Johnson, T. Gerber, Z. Gengeliczki, B. Szt´aray, and T. Baer, Rev. Sci. Instrum. 80 (2009) 034101.
18. A. Bodi, B. Szt´aray, T. Baer, M. Johnson, and T. Gerber, Rev. Sci. Instrum. 78 (2007) 084102. 19. B. Szt´aray and T. Baer, Rev. Sci. Instrum. 74 (2003) 3763.
20. M. J. Frisch, G. W. Trucks, H. B. Schlegel, G. E. Scuseria, M. A. Robb, J. R. Cheeseman, J. A. Montgomery Jr., T. Vreven, K. N. Kudin, J. C. Burant, J. M. Millam, S. S. Iyengar, J. Tomasi, V. Barone, B. Mennucci, M. Cossi, G. Scalmani, N. Rega, G. A. Petersson, H. Nakatsuji, M. Hada, M. Ehara, K. Toyota, R. Fukuda, J. Hasegawa, M. Ishida, T. Naka-jima, Y. Honda, O. Kitao, H. Nakai, M. Klene, X. Li, J. E. Knox, H. P. Hratchian, J. B. Cross, V. Bakken, C. Adamo, J. Jaramillo, R. Gomperts, R. E. Stratmann, O. Yazyev, A. J. Austin, R. Cammi, C. Pomelli, J. W. Ochterski, P. Y. Ayala, K. Morokuma, G. A. Voth, P. Salvador, J. J. Dannenberg, V. G. Zakrzewski, S. Dapprich, A. D. Daniels, M. C. Strain, O. Farkas, D. K. Malick, A. D. Rabuck, K. Raghavachari, J. B. Foresman, J. V. Ortiz, Q. Cui, A. G. Ba-boul, S. Clifford, J. Cioslowski, B. B. Stefanov, G. Liu, A. Liashenko, P. Piskorz, I. Komaromi, R. L. Martin, D. J. Fox, T. Keith, M. A. Al-Laham, C. Y. Peng, A. Nanayakkara, M. Chal-lacombe, P. M. W. Gill, B. Johnson, W. Chen, M. W. Wong, C. Gonzalez, and J. A. Pople, Gaussian 03, Revision D.01, 2004.