REVIEW
Minimally Invasive Pharmacokinetic and Pharmacodynamic
Technologies in Hypothesis-Testing Clinical Trials of
Innovative Therapies
Paul Workman , Eric O. Aboagye , Yuen-Li Chung , John R. Griffi ths , Rachel Hart ,
Martin O. Leach , Ross J. Maxwell , Paul M. J. McSheehy , Pat M. Price , Jamal Zweit
For the Cancer Research UK Pharmacodynamic/Pharmacokinetic Technologies
Advisory Committee
Clinical trials of new cancer drugs should ideally include mea-surements of parameters such as molecular target expression, pharmacokinetic (PK) behavior, and pharmacodynamic (PD) endpoints that can be linked to measures of clinical effect. Appropriate PK/PD biomarkers facilitate proof- of-concept demonstrations for target modulation; enhance the rational selection of an optimal drug dose and schedule; aid decision-making, such as whether to continue or close a drug develop-ment project; and may explain or predict clinical outcomes. In addition, measurement of PK/PD biomarkers can minimize uncertainty associated with predicting drug safety and effi -cacy, reduce the high levels of drug attrition during develop-ment, accelerate drug approval, and decrease the overall costs of drug development. However, there are many challenges in the development and implementation of biomarkers that probably explain their disappointingly low implementation in
phase I trials. The Pharmacodynamic/Pharmacokinetic Tech-nologies Advisory committee of Cancer Research UK has found that submissions for phase I trials of new cancer drugs in the United Kingdom often lack detailed information about PK and/or PD endpoints, which leads to suboptimal informa-tion being obtained in those trials or to delays in starting the trials while PK/PD methods are developed and validated. Minimally invasive PK/PD techno logies have logistic and ethical advantages over more invasive technologies. Here we review these technologies, emphasizing magnetic resonance spectroscopy and positron emission tomography, which pro-vide detailed functional and metabolic information. Assays that measure effects of drugs on important biologic pathways and processes are likely to be more cost-effective than those that measure specifi c molecular targets. Development, valida-tion, and implementation of minimally invasive PK/PD meth-ods are encouraged. [J Natl Cancer Inst 2006;98:580 – 98]
Anticancer drug discovery and development are undergoing a period of rapid and unprecedented change ( 1 , 2 ) . Molecular biol-ogy and genomic approaches have led to an increasingly detailed understanding of the genetic abnormalities that drive the malig-nant phenotype ( 3 ) . The identifi cation of cancer-causing genes and the cellular pathways that their encoded proteins control pro-vides a wide range of new targets for oncology drug discovery and development ( 1 , 2 , 4 ) . At the same time, the pace of drug
dis-covery and development is being accelerated by numerous inno-vative technologies, particularly high-throughput methodologies for genomics, screening, structural biology, pharmacokinetics, and combinatorial chemistry ( 1 , 5 ) .
The nature of the drugs emerging from these new approaches is also changing dramatically. The previous generation of anti-cancer agents was dominated by cytotoxic drugs, whose precise molecular mechanisms of action were often not clear during their preclinical and early clinical development. The new generation of molecular therapeutics include mechanism-based modulators of proliferative signal transduction and cell cycle transit, telo-mere regulation, apoptosis/survival, invasion, angiogenesis, and metastasis ( 1 – 4 ) . Clinical development of such agents is still in the early stages, but the promise of this approach has already been shown through the regulatory approval of trastuzumab, a humanized monoclonal antibody for ErbB2-positive breast cancer ( 6 ) ; imatinib mesylate, a Bcr-Abl and c-Kit inhibitor in chronic myelocytic leukemia ( 7 ) and gastrointestinal stromal tumors ( 8 ) ; and the epidermal growth factor receptor tyrosine kinase inhibitors gefi nitib and erlotinib, which show preferential activity in non – small-cell lung cancers that harbor activating kinase mutations ( 9 , 10 ) . Other recently approved molecular thera-peutic agents include the monoclonal antibody cetuximab for colorectal cancers that overexpress the epidermal growth factor
Affi liations of authors: Cancer Research UK Centre for Cancer Therapeutics, The Institute of Cancer Research, Sutton, Surrey, U.K. (PW); Imperial College London, Faculty of Medicine, London, U.K. (EOA); Cancer Research UK Bio-medical Magnetic Resonance Research Group, St. George’s Hospital Medical School, London, U.K. (YLC, JRG); Cancer Research UK Drug Development Offi ce, London, U.K. (RH); Cancer Research UK Clinical Magnetic Resonance Research Group, The Institute of Cancer Research and Royal Marsden NHS Foundation Trust, Sutton, Surrey, U.K. (MOL); Gray Cancer Institute, Mount Vernon Hospital, Middlesex, U.K. (RJM); Novartis Institute for Biomedical Re-search, Basel, Switzerland (PMJM); Cancer Research UK PET Oncology Group, Molecular Imaging Centre, Manchester, U.K. (PMP); Cancer Research UK/ University of Manchester Radiochemical Targeting & Imaging Group, Paterson Institute of Cancer Research, Manchester, U.K. (JZ).
Correspondence to: Paul Workman, PhD, Cancer Research UK Centre for
Cancer Therapeutics, The Institute of Cancer Research, Haddow Laboratories, 15 Cotswold Road, Belmont, Sutton, Surrey, SM2 5NG, United Kingdom (e-mail: paul. workman@icr.ac.uk ).
See “ Notes ” following “ References. ” DOI: 10.1093/jnci/djj162
© The Author 2006. Published by Oxford University Press. All rights reserved. For Permissions, please e-mail: journals.permissions@oxfordjournals.org.
receptor ( 11 ) and the monoclonal antibody bevacizumab, which acts on the vascular endothelial growth factor receptor ligand, VEGF-A ( 12 ) . Many other innovative drugs that interfere with the molecular pathology of human cancers are now undergoing preclinical and clinical development ( 13 ) . However, based on past experience, the vast majority of these drugs will not make it through to marketing approval .
The new molecular therapeutics pose a considerable challenge for oncology drug development [reviewed in ( 14 ) ]. For preclini-cal and clinipreclini-cal development, it is essential to know 1) whether adequate or optimal exposures are being achieved in the tissues of interest in the experimental organism or patient, 2) whether the molecular target is being appropriately modulated, and 3) whether the desired biologic effect is being obtained ( Fig. 1 ). The ability to make these types of measurements as part of phase I/II clinical trials is particularly important. For example, in phase I trials, it is no longer suffi cient only to defi ne the nature of the dose-limiting toxicity, the maximum tolerated dose, and the recommended dose for a phase II trial. Phase I trials are increasingly extensions of the preclinical mechanistic drug development process and, as such, represent the fi rst clinical test of the hypothesis. The devel-opment of techniques to measure pharmacokinetic (PK) and pharmacodynamic (PD) endpoints is essential for both the pre-clinical and pre-clinical development of the new oncology drugs ( 15 , 16 ) . Here we use the term PK to denote what the body does to the drug in terms of its absorption, distribution, metabolism, and excretion, including the concentration – time relationship and its dependence on dose; the term PD is used to denote what the drug does to the body. PK/PD relationships refl ect the connection between the two. Linkage of information on the status of the mo-lecular target, PK, and PD to measures of biologic and clinical effects constitutes a pharmacologic “ audit trail ” ( 17 ) .
Throughout the process of preclinical and clinical drug devel-opment, measurement of appropriate biomarkers is invaluable to aid the selection of the most appropriate clinical candidate, to provide demonstration of proof of concept for molecular and bio-logic mechanisms, to help the interpretation of clinical trial data, to inform the identifi cation of the optimal dose and schedule, and to support regulatory submissions ( 18 , 19 ) . PK/PD biomarkers should help to minimize risks associated with studies of drug
safety and effi cacy and reduce the levels of drug attrition in pre-clinical and pre-clinical phases, which are unacceptably high. Hence, the cost of pharmaceutical development should be decreased.
Developing and implementing PK/PD biomarker methods can be challenging because they need to be sensitive and specifi c and may be very complex. There are also issues concerning the inva-siveness of these technologies and their logistic impact on the conduct of early clinical trials. Although PK/PD endpoints clearly add value to preclinical drug development and early clinical tri-als, it is important that the introduction and implementation of PK/PD methodologies should not delay such trials. These chal-lenges may explain results of a recent survey showing that the use of molecular and functional imaging endpoints within phase I trials of molecular therapeutics was disappointingly low ( 20 ) .
The Pharmacodynamic/Pharmacokinetic Technologies Advi-sory Committee (PTAC) was established under the auspices of the Phase I/II Clinical Trial Committee and the New Agents Committee of Cancer Research UK. The latter committee is re-sponsible for reviewing and auditing applications for phase I and II trials of new agents in the United Kingdom ( 21 ) . While re-viewing new drug applications, PTAC members recognized that there was a need for 1) greater awareness of PK/PD endpoints in the oncology drug development community, 2) more extensive implementation of PK/PD endpoints in preclinical and clinical anticancer drug development, and 3) more research to bring for-ward improved PK/PD technologies for the future. In particular, the sponsoring Cancer Research UK committees have noted that submissions of new agents frequently lacked information on PK/ PD endpoints in the clinical trial. Such omissions could lead to suboptimal information being obtained in the trials that are ap-proved or to delays in implementing the trials while appropriate PK/PD endpoints are developed. Discussions with other drug development organizations, such as the European Organization for Research and Treatment of Cancer (EORTC) and the U.S. National Cancer Institute indicate that the lack of or use of weak PK/PD endpoints is common. PTAC appears to be the only ad-visory body worldwide to provide comprehensive multidisci-plinary advice in this area.
PTAC members are experts who have experience with the key PK/PD methodologies and consult with other specialists when appropriate. Our goal with this review is to publish the Commit-tee’s emerging experience and recommendations so that they can be of more general benefi t beyond the Cancer Research UK orga-nization . The Committee welcomes feedback from other orga-nizations and investigators with regard to their experience of PK/PD issues in phase I and II trials. The development and shar-ing of broad guidelines for PK/PD endpoints seem particularly appropriate given the changing nature of early clinical trials, the uncertainty and risk associated with the new range of molecular therapeutics, and the need for extensive cooperation between ac-ademia and the pharmaceutical and biotechnology sectors ( 19 ) .
A wide range of invasive and minimally-invasive techniques are available to determine PK and PD endpoints. Judicious use of biopsy or other invasive surrogate-based assays to measure PK and PD, including target modulation, remains very important in early clinical trials. However, because of the logistic and ethical issues associated with invasive measurements, there is an in-creasing requirement for minimally invasive assays ( 22 ) . Here we review the various imaging-based minimally invasive meth-odologies available for assessing PK/PD endpoints and discuss their strengths and weaknesses ( Table 1 ). We emphasize magnetic Fig. 1. Stages in preclinical and clinical therapeutic development showing paired
objectives and examples of measurable endpoints.
Objectives Measurable endpoints
Patient selection Expression of molecular target (e.g.,
erbB2), physiologic state (e.g., hypoxia) Achievement of the necessary
concentrations for activity at the site of action
Pharmacokinetic properties in plasma and/or tissue
Specific action on the molecular target or pathway
Target inhibition in tumors and/or surrogate normal tissue
Induction of the desired biologic effect Inhibition of proliferation, cell cycle
transit, invasion, angiogenesis, metastasis or telomere erosion; or induction of apoptosis, differentiation or senescence
Resulting clinical response Tumor regression, cytostasis
Patient outcome Disease-free survival, performance status,
T
able 1.
Summary of strengths, weaknesses, and opportunities for using minimally invasive technologies in pharmacokinetic and pha
rmacodynamic studies
*
Technology and applications (possible
tracer/marker) Strengths W eaknesses Opportunities Robustness †
Positron emission tomography (PET)
3
1. General characteristics for imaging
Sensitivity; speci
fi
city; kinetic resolution;
low dose administered
Lack of chemical resolution; methodology developments
required
Molecular imaging possible; proof of principle and new pharmacokinetic/ pharmacodynamic studies possible
1. Imaging glucose utilization (
18 F-FDG)
For grading and response assessment
In
fl
ammation can give false-positives
Utility increasing; availability of standards for lar
ge trials 1 2. PK of labeled drugs/molecules (5- 18 F-fl uorouracil)
PK obtained for tumor and normal tissues
Lack of chemical resolution
New labeling strategies; improved data
analysis
2/3
3. Imaging cell proliferation (
11 C-thymidine)
Direct and rapid assessment
Thymidine metabolism can complicate data analysis
Nonmetabolized thymidine analogs
2/3
4.
Blood
fl
ow and blood volume imaging
(
15 O
H 2
O/CO)
Endpoint for antivascular therapy; index for drug uptake and clearance
Poor signal-to-noise ratio in some tumors
Improved sensitivity of scanners
2/3
5. Measurement of tissue pH (
11 C-bicarbonate)
T
issue pH measured
Does not dif
ferentiate pHi from pHe
Understanding drug ef
fects
2/3
6.
Drug mechanism of action studies ( 11
C-temozolomide)
Provides proof of principle in patients
Not applicable to all drugs
Evidence of activity in vivo
3
7.
Protein synthesis measurements ( 11
C-methionine)
Endpoint for certain drugs
T
racer metabolism can complicate data analysis
Improved data analysis
3
8.
Thymidylate synthase inhibition ( 11
C-thymidine)
Endpoint for certain drugs
Application is limited to initial drug ef
fect
Several compounds can be evaluated
3
9.
Imaging multidrug resistance phenotype ( 11
C-daunorubicin)
Patient selection for reversal of phenotype
Methodology developments required
Improved synthesis; new tracers
2/3/4
10. Hypoxia imaging (
18 F-FMISO)
Patient selection for several therapeutic agents
Current tracers have high nonspeci
fi
c signal
New tracers
2/3/4
11.
Cell surface and nuclear receptor imaging (
18 F-FES)
For grading and response assessment
Requires extensive validation
Direct clinical assessment
3/4
12. Imaging gene expression (
124
I-FIAU)
Monitoring gene therapy; studying transcription
Methodology developments required
More sensitive animal scanners; molecular imaging of tumor
bearing/transgenic mice 3/4 13. Angiogenesis imaging ( 124 I-VEGF) Response assessment Not veri fi ed in humans
Understanding tumor biology
4/5 14. Apoptosis imaging ( 124 I-annexin) Response assessment Dif fi culty to dif ferentiate necrosis
Evaluating several therapies; dose optimization in radiotherapy
4/5
15. Imaging protein
– protein interactions
Endpoint for certain drugs
Methodology developments required
Patient selection
6
Magnetic resonance imaging (MRI)/magnetic resonance
spectroscopy
(MRS)
1.
V
olumetric imaging
High soft-tissue contrast and resolution; rapid
Limited utility in bone and lung; CT
also has
improved cost and availability
Recent advances in lung cancer imaging
;
availability
increasing
1
2. Contrast enhanced imaging
Re
fl
ects permeable vasculature, increased
blood volume, and perfusion
Not applicable to all tissues; timing crucial; limited standardization; expensive; other techniques also re
fl
ect tumor activity
albeit with reduced resolution
New (lar
ger) contrast agents; improved
computing power and processing
1
3. Permeability imaging
Based on application 2 above, but images can be quantitative; obtained simultaneously with imaging Requires specialized sequences; other radiolabeled methods available albeit with poorer resolution Functional information related to
vasculature
1
4. Perfusion/blood volume imaging
Based on application 2 above or uses intrinsic contrast mechanism, still developing; simultaneous with imaging Requires specialized sequences; usually only provides relative changes
Functional information on drug delivery
2
5. PK in situ (5FU)
Drug and metabolites in tar
get tissue
High doses required (
≥ 0.5 g/m 2 ); currently 19 F and 31 P only; applies to ~ 10% of all drugs
13 C-labeling permits detection of all drugs; hyperpolarization may increase sensitivity
2
6. PK in vitro (5FU, ifosfamide)
Drug and metabolites in plasma, urine,
etc.
Indirect; tar
get tissue not sampled; less sensitive
than HPLC, mass spectrometry
, etc.
Improved sensitivity; all nuclei applicable
2
7.
Assessment of PME metabolism using
31 P
Changes in PME as a marker for proliferation Poor resolution in vivo of the complex PME signal; PME changes are not quantitative
Higher
-fi
eld magnetic resonance
for improved resolution
3
8.
Assessment of PME and PDE as markers of pathway inhibition Changes in PMEs and/or PDEs with inhibition of speci
fi c
pathways
Dif
ferent pathways may cause similar
PME
changes
Higher
fi
eld may improve sensitivity
3/4
(T
Technology and applications (possible tracer/marker) Strengths W eaknesses Opportunities Robustness † 9.
Assessment of total choline using
1 H
Changes in total choline may be marker of grade and proliferation; higher sensitivity; better spatial resolution; hardware less complex
Cannot distinguish dif
ferent
choline-containing metabolites in vivo thus
con
fl
icting changes may be hidden
Possible to measure much wider range of disease; may inhibit speci
fi c pathways 3 10. Measurement of hypoxia (SR-4554) T ri fl
uoro group provides high sensitivity
Exogenous probe administered at 1 g/m
2 ,
nonquantitative measurement of pO
2
Detection of clinically relevant hypoxia
3/4
11. Measurement of oxygenation (PFCs)
T1 provides sensitive and quantitative measure of pO
2
Low solubility of PFCs; artefacts, e.g., macrophage uptake of PFCs
Intratumoral injection for regional pO
2
4
12. Measurement of lactate
T
umor grade and metastatic marker; glycolysis endpoint Lipid suppression or complex measurement techniques required; currently only applicable for brain in clinic
Developments in data acquisition
3/4
13. Measurement of pH
pHi and pHe measured simultaneously
Exogenous probe required for pHe; not relevant for all drugs Cell uptake of weak electrolytes is pH-dependent
4
14. Glucose utilization
Changes in rates of glycolysis using 19
F- or
13 C-labeling
Low sensitivity; high doses may alter tumor
physiology/biochemistry
Improved modeling of glycolytic enzyme
activity
5
15.
Assessment of fructose-1,6 bisphosphate using
31 P
Changes in fructose-1,6 bisphosphate as a marker for apoptosis
Poor resolution in vivo, not veri
fi ed
in
animals in vivo; low sensitivity compared to other in vitro methods
Identi fi cation of chronology of apoptosis events 6 Computed tomography (CT) 1. V olumetric imaging
Excellent cross-sectional anatomy; good soft-tissue contrast; good visualization of
bone
Soft-tissue contrast often less good than MRI; limited to direct transaxial views; other views can be reconstructed but may suf
fer resolution loss
Spiral CT
aids volume rendition
1
2. Contrast enhanced imaging
Uptake depends on perfusion and permeability; standard technique provides good
contrast
Limited range of agents; some side ef
fects,
high radiation dose limits repeat studies and duration, including pediatric application Enables wider application than magnetic
resonance
1
3. Permeability imaging
Based on application 2 above images can be quantitative Requires special software; not widely used. Limited range of agents; some side ef
fects,
high radiation dose limits repeat studies and duration, including pediatric application
Can be included in wider range of studies
3
Ultrasound 1. Sectional imaging
High resolution cross-sectional images; new developments leading to 3-dimensional acquisitions; real-time imaging method; can characterize tissues based on a range of properties, such as scatter and speed of sound Soft-tissue contrast can be limited by noise; images dependent on optical window into region; images are operator dependent; conventional imaging not registered to an orthogonal coordinate grid, limiting reproducibility; normally does not provide contiguous volume coverage; no documented record of entire volume, meaning audit trail more dif
fi cult
than
that for CT
or MRI
Useful for size measurements
1
2. Flow measurements
Can measure
fl
ow directly by Doppler shift;
good for lar
ge vessels; good time resolution;
can measure tissue perfusion
Hard to make truly quantitative
Can assess potential for drug delivery
1
3. Contrast agents
New ultrasound contrast agents provide potential for functional measurements; microbubbles can be used for perfusion measurements; microbubbles are intravascular; can use with Doppler perfusion methods
Cannot measure vascular permeability
Can measure vascular input functions; potential for agents tar
geted at vascular
endothelial surface receptors
2 * FDG = fl uorodeoxyglucose; FMISO = fl uoromisonidazole; FES = 16- α-18-fl uoro-17-β-estradiol; FESP = fl uoroethylspiperone; FIAU = 2 ′ -fl uoro-5-iodo-1- β - d -arabinofuranosyluracil; VEGF = vascular endothelial
growth factor; PK = pharmacokinetics; 5FU =
5-fl
uorouracil; HPLC = high-pressure liquid chromatography; PME = phosphomonoester; PDE = phosphodiester; PFC = per
fl uorocarbon;
pO
2
= partial pressure of oxygen;
pHi = intracellular pH; pHe = extracellular pH. † The level of robustness of pharmacokinetic/pharmacodynamic techniques was evaluated according to the following criteria
in descending order of proven robustness: 1 = in routine clinical use; 2 = evaluated in three
or more clinical centers; 3 = in early clinical development; 4 = evaluated in three or more animal models; 5 = evaluation in pr
ogress in animal models; 6 = evaluated in extracts from cell/tissue culture models.
T
able 1
resonance imaging (MRI), magnetic resonance spectroscopy (MRS), and positron emission tomography (PET) because they provide the greatest level of functional and metabolic informa-tion. We also highlight the current limitations in PK/PD technol-ogies, particularly in terms of their ability to measure effects on specifi c molecular targets or biologic functions. Finally, we iden-tify areas of current need and make recommendations for further research.
C
OMPUTEDT
OMOGRAPHICS
CANNINGX-ray computed tomography (CT) scanning, the most widely employed method of transaxial imaging, is used in the diagnosis and staging of most soft-tissue and bone cancers and in the assessment of response ( 23 ) . CT scanning provides excellent soft-tissue contrast, allowing visualization of disease in three dimensions. Although CT has been the benchmark method of im-aging soft-tissue disease for many years, its use for some applica-tions is now being eclipsed by MRI ( 24 ) . In PD studies, CT is used mainly to measure changes in the volume of disease with treatment ( 25 ) . CT measurement of changes in disease volume is usually performed to support bidimensional assessments of re-sponse as recommended by the Union Internationale Contre le Cancer (UICC) ( 26 ) or unidimensional assessment of response, as recommended by Response Evaluation Criteria in Solid Tu-mors (RECIST) ( 27 ) , although its multislice capability also al-lows accurate assessment of tumor volume. CT can also be used with X-ray – dense contrast agents, such as iodinated materials, to assess some of the functional properties of tumors. Contrast agents have also been used to assess tumor perfusion ( 28 ) and are routinely used to defi ne perfused areas of tissue and areas of blood – brain barrier breakdown. CT can also be helpful in deter-mining the boundaries of the tumor and the extent of its invasion into adjacent tissues and can identify involvement of lymph nodes, particularly when such involvement has caused an in-crease in lymph node size or an abnormal lymph node appear-ance ( 23 ) . In clinical trials of innovative therapies, CT is most commonly used to assess the size of the primary tumor and the extent of metastatic disease.
U
LTRASOUNDS
CANNINGUltrasound is a relatively inexpensive means to obtain sec-tional images of tissue ( 29 ) . High-frequency sound is transmitted from a transducer that is placed in contact with the skin surface . Refl ected or scattered sound is received back at the transducer, allowing images of scatter intensity to be reconstructed so that tissues are visualized in real time. Ultrasound is not readily trans-mitted through bone and is refl ected strongly at air – tissue inter-faces. Thus, this technique is limited to tissues that are not overlaid by bone or that are accessible through an ultrasound window. In addition to depicting tumor by contrast to other soft tissues, ultrasound scanning can distinguish tumor from fl uid-fi lled compartments, such as cysts. Doppler ultrasound techniques have a high sensitivity for measuring blood fl ow. Current devel-opments in ultrasound technologies include three-dimensional ultrasound imaging techniques ( 30 ) and the use of ultrasound contrast agents, which show promise in assessing vascular deliv-ery of agents. Although ultrasound is of considerable assistance in diagnosis, its use for morphologic assessment in serial studies
is limited because the technique is operator dependent, which makes it diffi cult to reproduce imaging planes. Color Doppler ultrasound measurements ( 31 ) have been used to assess tumor response to conventional therapies; as with other modalities, con-trast agents may also prove helpful ( 32 ) . The major application of ultrasound in therapeutic trials is to assess changes in tumor size. Ultrasound scanning using microbubble contrast agents has potential value in the measurement of perfusion in response to antivascular and antiangiogenic agents ( 33 , 34 ) .
M
AGNETICR
ESONANCET
ECHNIQUESMRI and, to a lesser extent, MRS are beginning to have im-portant roles in anticancer drug trials. MRI is routinely used in the initial evaluation of tumor size, shape, and anatomic appear-ance, and changes in these parameters during therapy can be used to assess and quantify the PD effects of a drug. In addition, dy-namic contrast-enhanced MRI (DCE-MRI) is proving increas-ingly valuable for assessing PD endpoints ( 35 ) . Other MRI approaches, as well as MRS, also have PD applications, and in some cases MRS can even be used for minimally invasive moni-toring of anticancer drug uptake and metabolism. Almost all major hospitals in the developed world have access to MRI in-struments for routine use, and such inin-struments are already widely used in drug trials for morphologic estimation of tumor size. Because MRI (including DCE-MRI and diffusion-weighted MRI) uses the isotope 1 H, most MRI instruments with a fi eld strength of 1.5 – 3 T currently in clinical service can easily be adapted to perform 1 H MRS. By contrast, MRS studies with the natural isotopes 31 P or 19 F require broad-band systems, which are currently available only at research centers.
The high concentration of 1 H present in tissue water (80 – 90 M) enables magnetic resonance images to be obtained. MRI is now the method of choice for diagnostic imaging of tumors in many areas of the body. Although MRI does not directly show bone, it can, unlike CT, be used to obtain images directly in arbi-trary orientations or in three dimensions, without being limited by radiation dose. MRI also often provides better soft-tissue contrast than other methods because the measurements can be manipulated to provide a wide range of contrasts for given tissues. Centers with MRS facilities routinely use both MRS and MRI in combination in the clinic and increasingly in the laboratory to defi ne a volume from which chemical information is then obtained.
Magnetic Resonance Imaging
MRI provides excellent information on morphology and is useful for defi ning tumor location, for detecting and measuring the extent of local invasion, and for detecting more distant dis-semination. Increasingly, MRI also provides a range of functional measures of physiology and the local tissue matrix ( 36 ) .
MRI contrast agents, which have magnetic properties that change the image signal intensity, provide an important means of obtaining functional information and facilitate the morphologic evaluation of tumors. Contrast agents constitute a rapidly devel-oping fi eld in MRI ( 36 – 38 ) , which we will not review here in detail; instead, we focus on methods used in drug trials. At pres-ent, the main contrast agents licensed for use in patients are gadolinium-based (e.g., gadolinium diethyltriaminepentaacetic acid [Gd-DTPA]). Gd-DTPA is a low-molecular-weight contrast
agent in routine clinical use for enhancing the visibility of lesions in magnetic resonance images. Its effects are particularly clear for brain lesions because, although the agent does not cross the normal blood – brain barrier, it can leak out of abnormal vessels present in tumors ( 39 , 40 ) . Judgments about the nature and size of a lesion are based on a qualitative assessment of altered contrast agent uptake compared with the surrounding normal tissue. These MRI examinations have evolved from simple comparisons of im-ages taken before and after injection of a contrast agent to evalu-ations of sets of images obtained every few seconds following injection (DCE-MRI). These serial evaluations have led in turn to a variety of quantitative methods for assessing the kinetics of the contrast agent in the tumor that are already being widely ap-plied in drug trials ( Fig. 2, A and B ). The kinetic parameters de-rived from such measurements depend on tumor perfusion and on the permeability – surface area (PS) product of the tumor blood vessels for the contrast agent ( 41 , 42 ) ; when tumor perfusion is very high and the PS product is low, the parameter K trans (volume transfer constant between blood plasma and extravascular extra-cellular space) is similar to the PS product, and when tumor per-fusion is low and the PS product is high, the behavior of K trans is dominated by fl ow. Tumors typically show high inter- and intra-variability with respect to whether K trans is dominated by fl ow or perfusion. These properties may be analyzed on the basis of mean changes within a defi ned region of interest or by using pixel- by-pixel mapping of properties throughout the tumor ( 43 , 44 ) . By examining changes during the fi rst pass of the agent through the vascular bed, it is possible to obtain information on relative blood volume and perfusion ( 45 , 46 ) .
Despite uncertainties about the precise physiologic interpreta-tion of parameters derived from DCE-MRI, its wide availability for both clinical and preclinical research has led to considerable interest in its use for the evaluation of tumor vasculature before and after treatment. Recommendations for the use of DCE-MRI in the evaluation of novel antiangiogenic and antivascular therapeu-tics have recently been published ( 47 , 48 ) . Large-molecular-weight contrast agents (often used as “ blood-pool ” agents), such as ferric oxide particles coated in dextran ( 49 ) and Gd-based cores linked to dendrimers to increase the hydrodynamic radius ( 50 ) , are being introduced. The clinical use of these agents has been driven by the needs of diagnostic radiology (for example, as a way to visualize lymph node involvement and to enhance magnetic resonance an-giography), but quantitative approaches yield important parame-ters such as vascular volume and the permeability of tumor vessels to such large particles ( 51 , 52 ) . These agents have not yet been li-censed for clinical blood pool or permeability studies. In parallel with the introduction of these macromolecular agents for clinical use, preclinical studies have used gadolinium-labeled albumin to provide similar kinds of information ( 53 ) . Although quantitative MRI assessments of tumor vasculature with blood pool agents are in their infancy, the parameters they provide may have a less ambiguous physiologic interpretation than those obtained from Gd-DTPA uptake kinetics. Overall, DCE-MRI provides a range of powerful techniques to detect PD changes in treated tumors, especially changes related to the vasculature.
Studies of dynamic contrast agents that assess vascular per-meability and/or blood fl ow are rapidly developing as important methods of assessing PD endpoints in, for example, patients with bladder, bone, or soft-tissue cancers ( 54 – 58 ) . DCE-MRI has been incorporated into phase I clinical trials of the antivascular agents 5,6-dimethylxanthenone-4-acetic acid ( 59 ) ,
combretastatin-A4-phosphate ( 60 ) , and ZD6126 ( 61 ) . In these trials, a decrease in the kinetics of contrast agent uptake in patients who received relatively high doses of drugs was interpreted as a reduction in blood fl ow. DCE-MRI has also been shown to provide a good measure of response in patients receiving androgen-inhibiting treatment for prostate cancer ( 62 ) , and it has been used to assess responses to primary medical therapy in breast cancer ( 63 ) . Vascular permeability, an important parameter monitored by DCE-MRI, is a characteristic of angiogenesis because the VEGF-dependent neovasculature is characteristically leaky. The marked reduction in kinetics of contrast agent uptake observed in pros-tate cancer is believed to result from inhibition of VEGF Fig. 2. Measuring angiogenic and vascular change. Magnetic resonance images of a grade 2 infi ltrating lobular breast cancer in a 49-year-old patient before ( A ) and after ( B ) treatment with cyclophosphamide and doxorubicin. Left panels : images of K trans scaled to a maximum of 1 min − 1 where K trans is displayed using a
color scale in which low values are dark blue and high values are yellow (absence of color indicates no value fi tted); right panels : two-dimensional gradient echo subtraction images showing areas of contrast enhancement in white. Courtesy of Dr. A. Padhani, The Institute of Cancer Research and Royal Marsden Hospital. C ) Coronal sections showing the distribution of 124 I-labeled anti-vascular
endothelial growth factor (VEGF) receptor antibody (low uptake, dark red ; high uptake, white ) given concurrently with the phase I treatment in a patient with metastatic colorectal cancer (imaging at 24 hours after treatment). Reproduced by permission of Oxford University Press from Jayson et al. (134) .
by androgen blockade. DCE-MRI techniques have also been employed in several hypothesis-driven phase I clinical trials of new antivascular and antiangiogenic therapeutics ( 59 – 61 , 64 ) . A strength of DCE-MRI is that it allows the whole tumor, or a sec-tion through it, to be characterized either on a pixel-by-pixel ba-sis or by evaluation of the mean parametric change for a defi ned region of interest. Histogram analysis of the pixel-by-pixel data has proven helpful for analyzing responses in heterogenous tu-mors, although more sophisticated analytic approaches are being developed. It is likely that assessment of perfusion will also be helpful for some tumors, particularly those in the brain, where changes that precede the blood – brain barrier breakdown or that follow its repair may be informative. DCE-MRI techniques may be particularly useful in assessing the likelihood of a therapeutic agent reaching tumor cells.
One new MRI approach that is being used to assess tumors in vivo involves the attachment of functional contrast agents to spe-cifi c ligands or targeting moieties ( 65 ) . An alternative approach uses contrast agents designed so that they act as a substrate for an existing cellular process or can be activated in situ, for example, by being designed as a substrate for a specifi c enzyme ( 66 – 69 ) . This promising area of research may yield new PK endpoints, although currently developments are at the early preclinical stage. MRI would benefi t from the availability of more specifi c agents that target identifi ed cellular processes .
Diffusion-weighted MRI does not involve administration of a contrast agent but can be used to measure parameters associated with the rate and distance of water molecule diffusion ( 70 ) that may refl ect drug access ( 71 ) . Both diffusion-weighted MRI and DCE-MRI may indicate changes in tumor anatomy and physiol-ogy during therapy.
Magnetic Resonance Spectroscopy
MRS is the only noninvasive in vivo method for chemically distinguishing between, and measuring the concentrations of, bio-chemical compounds (or drugs and their metabolites), and it is beginning to have applications in drug trials. Instead of providing an anatomic image, MRS data are usually visualized in the form of a spectrum, in which the peaks correspond to different chemi-cals ( 72 ) , although low-resolution spatial images corresponding to different chemical concentrations can also be produced. Thus, MRI techniques can be used to defi ne a volume in a tumor (or in normal tissue) and MRS can then be used to measure the concen-tration of endogenous biochemical compounds (or drugs) in that volume in real time. Most of the early work on human tumors other than brain or prostate tumors ( 73 ) was performed using 31 P-MRS. However, in recent years there has been much interest in the use of 1 H-MRS for breast ( 74 ) , cervical ( 75 ) , and other tumors because of its better sensitivity and, consequently, spatial resolution compared with 31 P-MRS ( 72 ) .
PD studies can use MRS to measure the concentration of endogenous metabolites, such as adenosine triphosphate (ATP), phosphomonoesters (e.g., phosphocholine), or inorganic phos-phate ( Table 1 ); intracellular pH (with the use of 31 P-MRS); or the concentrations of lactate, choline compounds, inositol com-pounds, creatine comcom-pounds, and glutamine/glutamate (with the use of 1 H-MRS). Many PD studies have been performed using animal tumor models, usually with the use of 31 P-MRS. Animal tumor models often display large changes in energy metabolism during therapy, something that is rarely seen in tumors in
pa-tients. However, clinical 31 P-MRS studies in many tumor types, notably non-Hodgkin lymphoma ( 76 ) and breast cancer ( 77 , 78 ) , have shown that changes in the phosphomonoester peak are as-sociated with response to treatment and that these changes may be a marker for changes in proliferation ( Fig. 3, A and B ). Other studies in cultured cells and animal models have shown that tu-mor cells display marked changes in the MRS spectrum as they undergo apoptosis ( Fig. 4, A and B ) ( 79 – 81 ) . Additional studies have investigated the effectiveness of 1 H-MRS in assessing re-sponse. For example, two studies ( 82 , 83 ) found that a decrease in total choline (a composite signal derived predominantly from choline-containing compounds) was associated with response to chemotherapy in glioma — specifi cally, with changes in perme-ability and size ( Fig. 3, C and D ). In another study, a decrease in total choline was associated with response to chemotherapy in lymphoma and germ cell tumors ( 84 ) .
Other in vivo PD magnetic resonance methods are used to measure hypoxia, oxygenation, and glucose utilization. Hypoxia can be measured by using a fl uorinated hypoxia-imaging agent, such as SR-4554, which has low toxicity and is currently under-going clinical trials ( Fig. 5, A ) ( 85 – 87 ) . Oxygenation can be measured by using organofl uorine compounds that have a high affi nity for oxygen, such as perfl uorocarbons; however, several problems (including nonuniform delivery and distribution within tumors) currently preclude their clinical use. Tumors are highly glycolytic, and this property has permitted their detection and staging by using PET images of 18 F-fl uorodeoxyglucose ( 18 FDG). Changes in 18 FDG metabolism can be an early indicator of tumor response. MRS of 19 FDG ( 88 ) and 13 C-glucose ( 89 ) has also been used in research settings to detect various aspects of glucose uptake and metabolism.
For PK studies, it is possible, in principle, to monitor drug con-centrations in the tumor, liver, kidney, and other major organs where the drug may accumulate ( Fig. 6, A – D ) ( 90 – 92 ) . Thus, drug retention, metabolism, and elimination can be studied in the target tissue by using MRI techniques to defi ne a volume within a tumor (or in normal tissue), followed by MRS to measure the concentra-tion of the drug and its metabolites in real time. The advantage of this approach is that nothing (other than the drug) is administered, no samples are taken, and no ionizing radiation is used.
The molecular structures of certain agents (e.g., the presence of a nucleus with an easily detected MRS signal) enable PK stud-ies of parent drugs and metabolites using direct detection by MRS. For example, the fl uorine atom has very high magnetic resonance sensitivity (83% that of the most sensitive stable nucleus, 1 H), and there is no background fl uorine signal in living tissue. Fluorine-containing drugs such as 5-fl uorouracil (5FU), one of the most widely used anticancer agents, are thus particularly well suited to MRS studies, many of which have been performed in animals and patients. So far, studies in patients have been restricted to 5FU, its prodrug, capecitabine, and the difl uorinated drug gemcitabine using 19 F-MRS ( 93 – 95 ) , and to ifosfamide and cyclophosphamide using 31 P-MRS ( 96 ) . The elimination rate of 5FU from tumors in patients is associated with response, allowing an early prediction of the likely success or failure of a treatment regimen ( 93 ) . It has recently become possible to routinely detect fl uoronucleotides, the active species of 5FU that are formed in the tumor cell, in 1.5-T 19 F spectra ( 97 ) .
MRS can also be used to detect endpoints in antibody-directed, protein-antibody-directed, and gene-directed enzyme prodrug therapy. For example, MRS using the 19 F-containing drugs
5-fl uorocytosine and gemcitabine can be used to determine the success or failure of gene or protein delivery ( 98 ) .
Other nuclei that will be useful in the study of anticancer drug PK are 1 H [which has thus far only been used to detect iproplatin in mice ( 99 ) ] and 13 C ( 100 ) . The latter nucleus differs from previ-ously mentioned nuclei in that it is present only in very small amounts (i.e., 1.1%) in natural carbon; thus, it is necessary to synthesize a 13 C-labeled sample of the drug (note that 13 C is not radioactive). In this respect, this particular MRS approach resem-bles PET, in which synthesis of drug analogs containing radio-nuclides is required (see next section).
MRS has two advantages compared with imaging methods that use radiolabels. First, with MRS, it is often possible to dis-tinguish between the substances that give rise to the signals, which permits minimally invasive monitoring of drug metabo-lism in the tumor. In principle, this MRS method can allow for
more complete PK modeling, for example, by identifying routes of excretion ( 101 ) . Thus, novel anticancer drugs can fi rst be as-sessed in preclinical experiments, in which drug metabolites can be identifi ed and assigned, modeling applied, mechanisms of action clarifi ed, and suitable clinical protocols designed. By con-trast, with fl uorine- or phosphorus-containing agents the native drug is used for MRS and hence synthesis of a labeled analog is not required. In principle, it should be possible to detect almost any drug if it is labeled with 13 C; however, because 13 C-labeled precursors are expensive, and every molecule of the drug must contain the label, the routine use of tracer doses is not feasible. Thus far, the only study of a 13 C-labeled drug has been of temo-zolomide in mice ( 100 ) .
The major limitation of MRS for PK is its lack of sensiti-vity ( Table 1 ); in general, only drugs given in quantities of approximately 0.5 g/m 2 can be detected. Thus, PK studies, even Fig. 3. Assessing response via metabolic change. A ) Localization image for 31 P
magnetic resonance spectroscopy showing a single voxel positioned over a breast tumor. B ) 31 P magnetic resonance spectra obtained from the region defi ned in
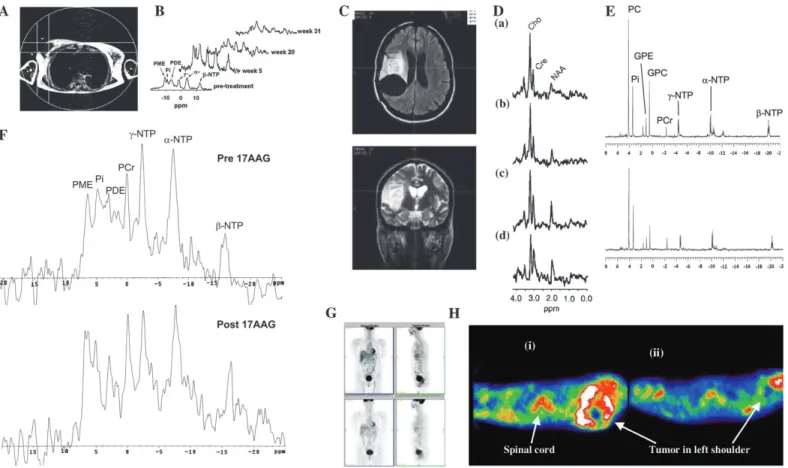
A before (pretreatment), during (week 5 and week 20), and after (week 31) a course of chemotherapy, showing an initial increase in all metabolites (week 3) followed by a marked reduction in metabolite signals with treatment (weeks 20 and 31). Reproduced with permission from Leach et al. ( 77 ) , copyright John Wiley and Sons Limited. C ) Pretreatment fl uid-attenuated inversion recovery ( top ) and T2-weighted fast spin-echo ( bottom ) images from a patient with low-grade glioma receiving treatment for recurrent disease, showing the position of voxels selected for spectroscopy. D ) Serial 1 H spectroscopy measurements
from the same patient showing long echo time (TE =135 ms) stimulated-echo
acquisition mode spectra obtained before ( a ) and at ( b ) 3 months, ( c ) 6 months, and ( d ) 9 months after initiation of temozolomide treatment. Within both series, a progressive decrease in the choline/creatine (Cho/Cre) ratio was observed, suggesting reduced membrane metabolism and diminishing cellular density. Also note the increasing conspicuity of the N-acetylaspartate (NAA) peak, a specifi c neuronal marker whose level may refl ect the regression of tumoral tissue and repopulation of normal brain matter. First published in Murphy et al. ( 83 ) . E ) In vitro 31 P magnetic resonance spectra of cell extracts obtained from
human colon adenocarcinoma HT29 cells treated with the Hsp90 molecular chaperone inhibitor 17-allylamino,17-demethoxygeldanamycin (17AAG) ( top ) or with vehicle ( bottom ). F ) In vivo 31 P magnetic resonance spectra of a
HT29 tumor xenograft before ( top ) and after ( bottom ) 17AAG treatment. Reproduced by permission of Oxford University Press from Chung et al. ( 106 ) . G ) Fluorodeoxyglucose positron emission tomography (FDG PET) images of a patient before ( top panels ) and 8 hours after ( bottom panels ) imatinib treatment ( left panels: coronal view; right panels: sagittal view) showing two rectal gastrointestinal stromal tumors behind the bladder and a liver metastasis. All tumors showed reduced uptake of tracer at 8 hours. Courtesy of Dr. H. Minn, University of Turku, Finland; reproduced by permission of Taylor & Francis Ltd. (http://www.tandf.co.uk/journals) from Joensuu et al. ( 123 ) . H ) [ 11 C]Thymidine
scans of a patient with Ewing’s sarcoma ( i ) before and ( ii ) after combination chemotherapy. The white areas indicate regions of highest tracer uptake. Combination chemotherapy resulted in decreased uptake of radiolabel. Resection revealed almost complete histologic response. Redrawn from Gupta et al. ( 111 ) , reprinted with permission from Elsevier. GPC = glycerophosphocholine; GPE = glycerophosphoethanolamine; PC = phosphocholine; PCr = phosphocreatine; PME = phosphomonoester; Pi = inorganic phosphate; ppm = chemical shift in parts per million; NTP = nucleoside triphosphate.
those in animals, can extend over a concentration range of only approximately 1 order of magnitude. Nevertheless, if a fl uorine- or phosphorus-containing drug is in clinical trials, consideration should be given to including MRS studies in the trial. The sensi-tivity of MRS is not a serious limitation for PD studies that involve the detection of endogenous metabolites present in mil-limolar concentrations, such as lactate, ATP, phosphomonoesters, or phosphodiester compounds. Recent developments in
hyperpo-larization ( 102 ) show considerable potential for increasing the sensitivity of MRS PK studies.
Table 1 summarizes methods currently available in magnetic resonance that could be applied in the development of a new drug. As an example of this approach, it is possible to hypothe-size that applications 1, 4, 5, 6, and 9 could be used together to provide surrogate markers for use in clinical trials of a novel fl uorinated antimetabolite drug active at high doses ( ≥ 0.5 g/m 2 ) Fig. 4. Detecting apoptosis and cell death. A ) 31 P magnetic resonance spectra of
extracts from ( a ) control untreated murine lymphocytic leukemia L1210 cells and ( b ) L1210 cells after 3 hours of treatment with 50 µM alkylating nitrogen mustard mechlorethamine (HN2), showing early metabolic effects of apoptotic cell death. Spectra are the result of 10 000 scans plotted with a line broadening of 0.5 Hz. First published in Ronen et al. ( 79 ) . DHAP = dihydroxyacetone phosphate; GP = glycerol-3-phosphate; fructose 1,6bisP = fructose 1,6-bisphosphate; ref = reference line (methylenediphosphonic acid); PE = phosphoethanolamine; PC = phosphocholine; Pi = inorganic phosphate; NTPs = nucleotide triphosphates (including nucleotide di-phosphates); NAD = nicotinamide-adenine dinucleotide. B ) In vivo stimulated-echo acquisition mode ( a and b ) and localization by adiabatic selective refocusing ( c and d ) spectra from rat brain BT4C gliomas. These water-suppressed 1 H nuclear magnetic resonance spectra were obtained from a tumor
volume preselected from T2-weighted magnetic resonance images (not shown). Cr = creatine; Glx = glutamate and glutamine; Gly = glycine; Lac = lactate; mI = myo-inositol; Tau = taurine; ppm – chemical shift in parts per million. In c , lipid
peaks are assigned according the chemical groups giving rise to the resonance. In b and d , the spectra are referenced to a fi xed height of the choline (CHO)-containing metabolite peak. Day 0, Day 2, etc., refer to days 0 (pretreatment) through 8 of ganciclovir treatment. Reproduced with permission from Lehtimaki et al. ( 81 ) . C ) 124 I-Annexin V distribution in vivo. Positron emission tomography
images ( left ) and corresponding liver high-pressure liquid chromatography traces ( right ) of an untreated mouse ( top panels ), an anti-Fas-treated mouse ( middle
panels ) both 2 hours after intravenous injection with 5 MBq 124 I-annexin V and
(at bottom) an treated anti-Fas-treated mouse 2 hours after intravenous injection with 5 MBq 124 I-ovalbumin. Mice injected with 124 I-annexin V were given
potassium iodide intraperitoneally 2 hours before radioligand injection. The mouse injected with 124 I-ovalbumin received oral potassium iodide for 4 days before
radioligand injection. Anesthesia was maintained with halothane (3% – 3.5%, 2 L/min) and image data were acquired for approximately 1 hour. Reprinted from Keen et al. ( 140 ), with permission from Elsevier .
Fig. 5. Monitoring hypoxia. A ) Measurements of the hypoxia marker SR-4554. i ) Magnetic resonance image of a patient showing a leiomyosarcoma of the left thigh (T2-weighted image). ii – iv ) 19 F magnetic resonance spectra (MRS) of the
tumor acquired from the same patient at ( ii ) 2.18 hours, ( iii ) 7.98 hours, and ( iv ) 27.50 hours after the start of SR-4554 infusion (1600 mg/m 2 ). Unlocalized
spectra were acquired using a 10-cm surface coil and a 1.5-T magnetic resonance system (2048 transients acquired over 34 minutes, repetition time 1 second). v ) Quantifi cation of the 19 F signal detected from the tumor at time points after
the start of the intravenous infusion at a dose of 1600 mg/m 2 with an infusion
time of 63 minutes. The graph compares concentrations of SR-4554 detected by
19 F MRS in the tumor, in which a fraction may be bound in hypoxic tissues and
thus not be cleared as rapidly as in plasma, and the concentrations of the parent SR-4554 in plasma detected by ultraviolet high-pressure liquid chromatography (HPLC). Reproduced from Seddon et al. ( 87 ) . B ) [ 18 F]Fluoroetanidazole –
positron emission tomography images of HT1080 human fi brosarcoma
tumor-bearing mice acquired on the small-animal quad-HiDAC scanner (cubic voxels of side: 0.5 mm). a ) Three-dimensional (volume-rendered) image of an HT1080/ 1-3C tumor-bearing mouse (showing data acquired over the period 30 – 60 minute postinjection) showing a dorsal view of the mouse. Here, pixel values are defi ned by the maximum voxel value in corresponding lines in the z-axis. Arrows point to tumor (Tm), kidneys (Ki), small intestine (In), and urinary bladder (Bl). b ) Sagittal (0.5 mm) slice of data acquired over the period 30 – 60 minutes postinjection from the same mouse as in ( a ) at the midplane level, showing low radiotracer uptake in brain (Br) and spinal cord (Co), as well as high accumulation in urinary bladder. c ) Transverse (0.5 mm) slice of data acquired over the period 30 – 60 minutes postinjection from the same HT1080/1-3C tumor-bearing mouse as in ( a ) at the level of the maximal tumor diameter. d ) Corresponding transverse slice from an HT1080/26.6 tumor-bearing mouse, exhibiting lower tumor radiotracer uptake. The scale to the right shows uptake in arbitrary units. First published in Barthel et al. ( 138 ) .
that inhibits cell proliferation and the growth of solid tumors. MRS methods for PK can be used at a late preclinical stage and in phase I and II trials, either in situ for liver and tumor or ex vivo for analysis of body fl uids and tumor biopsies. These studies could establish whether minimal effi cacious doses actually reach the tumor and, if appropriate, whether the drug is metabolized to cytotoxic species. In clinical trials, MRI-based PD methods could determine whether the drug had a measurable effect on tumor size, functional volume, permeability, or perfusion. However, these MRI studies could be preceded by 1 H- and/or 31 P-MRS to measure changes in energy metabolism, pH, and choline metabo-lism before effects on tumor size become apparent. These PD MRS techniques could also eventually be used routinely in the clinic to permit early detection of nonresponding tumors. For responding tumors, these PD MRS techniques could be used in conjunction with PK assays to optimize treatment (e.g., dose scheduling). MRS can also provide measures of specifi c molecu-lar processes in vivo. For example, an increase in fructose-1,6-bisphosphate concentration is a sensitive measure of apoptosis in some in vitro cell systems. It is apparent early in the apoptotic process and is believed to refl ect poly(adenosine diphosphate-ribose) polymerase activation ( Fig. 4, A ) ( 103 ) . Ras activation can lead to increased levels of phosphocholine ( 104 ) . Pharmaco-logic blockade of Ras signaling with prototype mitogen-activated
protein kinase kinase 1/2 (MEK1/2) inhibitors leads to a decrease in the phosphocholine signal that is associated with inhibition of extracellular signal-regulated kinase 1/2 (ERK1/2) phosphorylation ( 105 ) . The heat shock protein inhibitor 17-allylamino,17-deme-thoxygeldanamycin (17AAG) increases levels of phosphomonoes-ters and phosphodiesphosphomonoes-ters in cancer cells and in human tumor xenografts ( Fig. 3, E – F ) ( 106 ) . These markers are currently being evaluated in phase I and II clinical trials of 17AAG.
Increases in the magnetic fi eld (and thus sensitivity) of MRS instruments are addressing the method’s sensitivity problem. Use of the higher fi eld MRS systems (2.0 – 8.0 T) now available for clinical research will substantially improve the sensitivity limits of MRS. Preclinical studies are typically performed at 4.7 – 11.8 T. MRS scans of brain tumors with the current generation of 1.5-T instruments can be carried out during routine MRI examinations and take only about 20 minutes. Studies on anticancer drugs usu-ally take longer; a typical scan lasts approximately 30 minutes, and longer scans may be necessary to obtain useful PK param-eters. Recommendations for standardization of clinical MRS measurements, based on an international workshop, have been published ( 107 ) .
MRI already plays an important role in conventional assess-ments of response to therapy. The ability to complement highly detailed morphologic information with information on function
and metabolism provides a powerful tool for assessing novel mechanism-based therapeutics in both the preclinical and clin-ical settings. Although magnetic resonance has limited sensi-tivity for direct PK assessments (see Table 1 ), its chemical specifi city allows drugs and metabolites to be identifi ed, so
that in the future, it may be possible to radically improve sen-sitivity by using hyperpolarization techniques ( 108 ) . The spec-ifi city of MRI techniques in PD assessment is also likely to grow as new families of biologically targeted contrast agents are developed ( 109 ) .
Fig. 6. Complementary modalities used to observe drug pharmacokinetics and metabolism in patients. A ) Time course of uptake of the antimetabolite 5-fl uorouracil (5FU) in the liver and metastases of a 73-year-old male with colorectal cancer showing conversion of 5FU to fl uoro- β -alanine (FBAL). Courtesy of Professor J. Griffi ths, St. Georges Hospital Medical School. B ) Summed time course data from ( A ) showing the anabolite fl uoronucleotides (FNuct) as well as 5FU and FBAL. C ) Two-dimensional magnetic resonance spectroscopic map of the liver super-imposed on a proton image showing drug metabolite signal localized to the gallbladder. Reproduced with permission from Dzik-Jurasz et al. ( 101 ) . D ) Che-mical specifi city of the localized metabolite signals from ( C ): i ) unlocalized signal from whole liver, ii ) spectrum from a voxel positioned in liver, iii ) spectrum
from a voxel localized in the gallbladder, showing a shift in the resonant frequency of the FBAL in the gallbladder ( left-hand arrow ) due to conjugation with bile acid compared with unconjugated FBAL in the liver ( right-hand arrow ). Reproduced with permission from Dzik-Jurasz et al. ( 101 ) . E ) Positron emission tomography images of 18 F-labeled 5FU at two time points after administration
to ( i ) eniluracil-naive patients and ( ii ) eniluracil-treated patients. Eniluracil de-creases catabolic breakdown of 5FU, reducing clearance of drug in the liver with metabolism predominantly via the anabolic pathway. High levels of drug are shown as white , low levels are dark red . Modifi ed from Saleem et al. ( 113 ) , reprinted with permission from Elsevier.
P
OSITRONE
MISSIONT
OMOGRAPHYPET allows dynamic, noninvasive measures of the three-dimensional distribution of a positron-labeled compound within the living body. After injection of a labeled compound, the radio-isotope decays and emits a positron that travels a short distance and is annihilated by colliding with an electron. The annihilation produces two 511-keV photons, which propagate at an approxi-mate 180° angle away from each other and can be detected within a short time (typically 19 nanoseconds). The summation of many such events provide the distribution of the radiotracer. Both tu-mor and normal tissues (including liver, brain, heart, vertebrae, spleen, kidney, and muscle) in the fi eld of view can be evaluated ( 110 ) . Over the past few years, there has been a major increase in the use of PET in oncology ( 111 ) . There are now several exam-ples in which the capabilities of this technology in anticancer drug development have been demonstrated in terms of PK and PD ( Table 1 ).
PET can be used to evaluate intratumoral and normal tissue PK in patients prior to phase I studies (pre-phase I) or as part of phase I and II studies ( Fig. 6 E ) ( 112 ) . This objective can be achieved by labeling the drugs of interest with positron-emitting isotopes such as 11 C, 18 F, 124 I, or 13 N. The chemical identities and, hence, the physicochemical properties of drugs are retained following radio-labeling. Typical examples of drugs that have been evaluated by PET in patients include 18 F-5FU ( 113 ) , 11 C-temozolomide ( 114 ) , 13 N-cisplatin ( 115 ) , 11 C-1,3-bis(2-chloroethyl)-1-nitrosourea ( 11 C-BCNU) ( 116 ) , 18 F-tamoxifen ( 117 ) , and 11 C-N-[2-(dimethyl-amino)ethyl]acridine-4-carboxamide ( 11 C-DACA) ( 118 ) . In the case of temozolomide, the proposed mechanism of action of the drug, involving DNA methylation, was evaluated in patients by using 11 C-temozolomide tracers labeled at the methyl and car-bonyl positions ( 119 ) . That study demonstrated that temozolo-mide undergoes tissue-specifi c ring-opening in humans, although this conformational change was not tumor-specifi c. Preclinical labeling and PET imaging of macromolecules such as 18 F-labeled antisense oligonucleotides is currently being pursued ( 120 ) .
Despite the increasing number of potential radiotracers in on-cology (see Table 1 ), PET is still generally synonymous with 18 FDG imaging because most centers worldwide employ this ra-diotracer for diagnostic imaging. However, changes in 18 FDG uptake refl ect infl ammatory responses as well as tumor response but make 18 FDG imaging less specifi c for general use. Changes in 18 FDG uptake can occur within hours after treatment or can take several days to weeks, as a result of cell death. For example, in patients with gastrointestinal stromal tumors who are treated with imatinib ( 121 ) , early changes in 18 FDG presumably refl ect the direct effect of imatinib on glucose metabolism ( Fig. 3, G ) ( 122 , 123 ) .
PD studies that can be performed by PET can be grouped into those that employ generic versus specifi c biologic endpoints. In the case of studies that employ generic endpoints, opportunities exist for monitoring changes in cellular proliferation with 11 C-thymidine ( Fig. 3, H ) ( 111 , 124 ) , glucose utilization with 18 FDG ( 125 ) , tissue perfusion with 15 O-H
2 O ( 126 ) , and blood volume with 15 O-CO ( 127 ) . A less readily metabolized analog of 11 C-thymidine, 18 fl uorothymidine, can be used to monitor DNA syn-thesis and cellular proliferation ( 128 ) . Other generic endpoints that have been monitored by PET include amino acid metabolism with 11 C-methionine ( 129 ) or methyl-fl uoro-dopa ( 130 ) and tricarboxylic acid cycle activity with 11 C-acetate ( 131 ) . We
envisage that evaluation of these generic endpoints will be used increasingly to assess the effects of novel therapeutics in the future.
Specifi c biologic endpoints are undergoing preclinical and clinical validation to provide proof of principle for the proposed mechanism of action of existing and novel therapies. Examples of such endpoints include detection of thymidylate synthase in-hibition with 11 C-thymidine ( 132 ) ; detection of VEGF or VEGF receptor expression with 124 I-labeled antibodies and peptides ( Fig. 2, C ) ( 133 , 134 ) ; detection of overexpression of ErbB2 receptors with 68 Ga-labeled anti-ErbB2 antibody ( 135 ) ; evalua-tion of estrogen receptor status with 16- α - 18 fl uoro-17- β -estradiol ( 136 ) ; detection of hypoxia with 18 fl uoromisonidazole ( 137 ) , other 18 F-labeled 2-nitroimidazoles ( Fig. 5, B ) ( 138 ) , and 60 Cu-based probes ( 139 ) ; imaging of apoptosis with 124 I-annexin V by PET ( Fig. 4, C ( 140 ) and 99m Tc-hydrazinonicotinyl ( 99m Tc-HYNIC) annexin V single-photon emission computed tomogra-phy (SPECT) ( 141 – 144 ) ; and imaging of alpha-V-beta-3 integrin receptor expression with 18 F- and 64 Cu-arginine-glycine-aspartate (RGD)-based peptides ( 145 , 146 ) . With the advent of several gene therapy approaches, PET methods are also being developed to monitor gene expression in vivo. Most of those methods employ a marker gene, such as those encoding the Herpes simplex virus 1-thymidine kinase, the dopamine D2 receptor, or the sodium iodide symporter, and a marker substrate, such as 124 I-2 ′ -fl uoro-5-iodo-1- β - d -arabinofuranosyluracil (FIAU), 3-(2 ′ - 18 fl uoroethyl)spiperone, or Na 124 I, respectively ( 147 – 150 ) . In this way, proof that these reporter – substrate pairs detect gene expression has been demonstrated in human tumor xenograft models ( 147 – 150 ) and in patients with recurrent glioblastomas ( 151 ) . In addition, PET methods are currently being developed for monitoring drug resistance. For instance, 11 C-daunorubicin – and 11 C-verapamil – PET have been employed to monitor the P-glycoprotein – mediated multidrug resistance phenotype in rodent tumors ( 152 ) .
Although PET imaging has many advantages for use in drug development, it is important to be aware of its limitations ( Table 1 ). Not all compounds (i.e., drugs or biochemical probes) can be radiolabeled. Each compound must be considered on an individual basis as a candidate for labeling. Small molecules, proteins, and antibodies can be selectively radiolabeled if suit-able functional groups are present. Labeling can be performed to obtain a chemically identical compound that contains 11 C or 18 F, if fl uorine is present in the original molecule (e.g., 5FU and gefi -tinib). Compounds with N-, S-, or O-methyl or ethyl groups, as well as proteins and antibodies, can be labeled fairly easily. How-ever, not all drugs can be labeled, for the following reasons: 1) in some cases, the multistep chemistry required for labeling pre-cludes radiolabeling and purifi cation of molecules rapidly enough to avoid substantial decay of radioactivity; 2) suitable precursors for radiolabeling a number of compounds (especially natural products) may not be available, a problem that may be alleviated by including precursor strategies into development programs; and/or 3) the position of the label may not be robust to metabolic degradation. However, this latter issue can occasionally be turned into an advantage for studying the mechanism of drug action as, for example, in the case of demonstrating the mechanism of action of temozolomide in patients ( 119 ) .
Regarding imaging data, PET images have low anatomic resolution; hence, it is common practice to align PET data with data from MRI and CT. The development of integrated PET – CT