Milk flow-controlled changes of pulsation ratio and pulsation rate
affect milking characteristics in dairy cows
Sarah Ambord and Rupert M Bruckmaier*
Veterinary Physiology, Vetsuisse Faculty, University of Bern, 3001 Bern, Switzerland
Received 24 September 2008; accepted for publication 12 January 2009; first published online 2 March 2009
To test a system with milk flow-controlled pulsation, milk flow was recorded in 29 Holstein cows during machine milking. The three different treatments were routine milking (including a pre-stimulation of 50–70 s), milking with a minimum of teat preparation and milking with milk flow-controlled b-phase, i.e. with a gradually elongated b-phase of the pulsation cycle with in-creasing milk flow rate and shortening again during dein-creasing milk flow. For data evaluation the herd was divided into three groups based on the peak flow rate at routine milking (group 1: < 3.2 kg/min; group 2: 3.2–4.5 kg/min; group 3: > 4.5 kg/min). Compared with routine milking, milking with milk flow-controlled b-phase caused a significant elevation of the peak flow rate and the duration of incline lasted longer especially in cows with a peak flow rate of > 3.2 kg/min in routine milking. In milking with a minimum of teat preparation the duration of incline lasted longer compared with the two other treatments. Bimodality of milk flow, i.e. delayed milk ejection at the start of milking, was most frequent at milking with a minimum of teat preparation. No significant differences between routine milking and milking with milk flow-controlled b-phase were detected for all other milking characteristics. In summary, milking with milk flow-controlled b-phase changes the course of milk removal, however mainly in cows with high peak flow rates.
Keywords : Flow-controlled pulsation, peak flow rate, b-phase.
In dairy cows only about 20% of the milk is stored in the cisternal cavity and is directly available before milk ejec-tion (Bruckmaier et al. 1994b ; Pfeilsticker et al. 1996; Ayadi et al. 2003, 2004). The main portion of the milk is located in the alveoli and small milk ducts and can be extracted only after milk ejection has shifted it into the cistern. The induction of milk ejection requires tactile stimulation of the teats and/or the udder which causes the release of oxytocin and hence myoepithelial contraction and alveolar milk ejection (Bruckmaier & Blum, 1996; Bruckmaier, 2005). Pre-stimulation induces the milk ejec-tion already before the start of milking, whereas milking without pre-stimulation leads to a transient reduction (bimodality) of milk flow after removal of the cisternal milk and before the availability of alveolar milk which is ejec-ted in response to the stimulation by the teat cup liner during the normal milking procedure (Schams et al. 1984; Bruckmaier & Blum, 1996; Weiss et al. 2003; Sandrucci et al. 2007). Milk ejection continues throughout the whole milking (Bruckmaier et al. 1994a; Weiss et al. 2003) and, towards the end of milking, the transfer of milk into the
cistern can be a limiting factor for the milk flow rate (Pfeilsticker et al. 1995).
Peak milk flow rate (PFR) can be modified by changes of the pulsation ratio (Pfeilsticker et al. 1995; Hamann & Mein, 1996). The same is true to a limited extent for the average milk flow (AMF) and consequently for the total milking time. While a higher PFR does not necessarily mean a faster udder emptying throughout the milking process, a higher AMF leads to a shorter total milking time at a given amount of milk stored in the udder (Smith & Petersen, 1946; Thomas et al. 1991; Pfeilsticker et al. 1995 ; Gleeson et al. 2004).
The objective of this present study was to test the hy-pothesis that milking with milk flow-controlled changes of the b-phase of the pulsation lead to a faster milk removal than standard pulsation which remains unchanged through-out milking.
Materials and Methods Animals and housing
Twenty-nine Holstein cows in early (7), mid (14) and late (8) lactation from a private farm in Switzerland were used
*For correspondence; e-mail : rupert.bruckmaier@physio. unibe.ch
(early: 1–100 d post partum (p.p.), mid: 101–200 d p.p., late lactation: 200–370 d p.p.). During the experiment the cows were in their first (9), second (2), third (9), fourth (7), sixth (1) and seventh (1) lactations.
Mean 305-d milk-production was 8945 kg and ranged from 5095 kg to 10 968 kg in the preceding lactation of the 20 multiparous cows. The animals were kept in a loose housing stall on cleft floor and fed with 40% maize silage, 10% sugar beet silage, 35% green silage, 8% hay and concentrate (approximately 7% soy pellets and a cereal mix), according to their individual production levels. Milking and milk-flow recording
Cows were milked in a low-level 1r6 side-by-side-milking parlour with a Lemmer-Fullwood SBS Arizona Group MM95 CE (6344 Meierskappel, Switzerland) at a vacuum level of 40.5 kPa and with a 4r1 pulsation. Times of milking were in the morning from 5.45 (i.e. 13 h after previous milking) and in the evening from 16.45 (i.e. 11 h after previous milking). All milkings were performed by the same person. The liner used was a Lemmer-Fullwood CTF 720138 (6344 Meierskappel, Switzerland).
The experiment included 18 milkings (9 d) and milk flow curves of all milkings were recorded with mobile milk-flow recording units (LactoCorderÕ
, WMB AG, 9436 Balgach, Switzerland).
Udder preparation, pre-stimulation and milking routine
(PS+) : The milker wore Nitril gloves during milking.
After entering the parlour teats of all cows were foamed with Dermaline (5–20% anionic surfactant, 1–5 % glycerol, 1–5% anionic tenside, perfume and triclosan ; CID LINES NV/SA, 8900 Ieper, Belgium) and thereafter dried with a single-use paper. Subsequently the clusters were attached without pre-stripping. The process of this routine was al-ways similar and lasted 50–70 s from the first touch of the udder until cluster attachment. After cluster attachment a 35-s high-frequency pre-stimulation was applied (pul-sation rate: 250 cycles/min; pul(pul-sation ratio: 25 : 75). As soon as the metering box was not completely filled with-in 35 s (i.e. < 200 g milk withwith-in 35 s) the clusters were re-moved automatically with a delay of about 1 s.
Milk flow controlled b-phase (MB+) : The milking
ma-chine used was equipped with a special option to adjust the b-phase of the pulsation on the basis of the current milk flow rate as shown in Table 1. This adjustment caused changes of pulsation ratio and pulsation rate. Overall the adjustments cause longer liner-open periods during phases with high milk flow. A-, c- and d-phases of the pulsation curve remained unchanged.
Treatments
PS+/MB– : In this treatment the pulsation ratio was
60 : 40 and the pulsation rate was 55 cycles/min which
remained unchanged throughout the entire milking. Cows were milked with the usual milking routine and without milk flow-controlled b-phase on days 2, 6 and 9 of the study.
PS+/MB+ : The routine udder preparation was performed
and the cows were milked with milk flow-controlled b-phase on days 3, 5 and 8.
PS– /MB – : This treatment included a minimum of teat
cleaning. First the teats of all 6 cows in the parlour were foamed, then one cow after the other was cleaned within some seconds with a single-use paper and the cluster was attached immediately. Milking was performed without milk flow-controlled b-phase. The clusters were removed automatically. This treatment was used on days 1, 4 and 7 of the study.
Milking characteristics
During all experimental milkings the milking character-istics as calculated by the LactoPro Software (Version 5.2.0 Beta 49 software; WMB AG, 9436 Balgach, Switzerland, 2007) were used for evaluation of milk flow curves. The parameters used were total milk yield (TMY), main milking time 1 (MMT1, time from milk flow > 0.5 kg/min at the start
of milking until < 0.2 kg/min at the end of milking), peak flow rate (PFR, highest milk flow, which is maintained for at least 22 s), time until peak flow rate (tPFR), average milk flow during MMT1 (AMF), duration of incline (dI, duration from a milk flow of 0.5 kg/min at the start of milking until milk flow reached a plateau, i.e. the slope of the increas-ing milk flow reached a threshold of < 0.8 kg/min2),
dur-ation of plateau (dP, after incline until milk flow dropped to a slope of > 0.8 kg/min2) and duration of decline (dD, after plateau until 0.2 kg/min) and the occurrence of bi-modal milk flow (BIMO, milk flow > 0.5 kg/min, a decline of > 0.2 kg/min and an increase of > 0.5 kg/min within 38 s after the decline).
An additional parameter not included in the LactoPro
software was introduced. Main milking time 2 (MMT2,
time recorded from > 0.5 kg/min until < 0.5 kg/min) was
Table 1. The milking machine settings and their changes when milked with milk flow-controlled b-phase
Milk flow rate, Pulsation Pulsation rate, a-+b-phase,
kg/min ratio cycles/min ms
0–2.0 60/40 55 655 2.0–2.5 63/37 53 713 2.5–3.0 65/35 51 765 3.0–3.5 68/32 48 850 3.5–4.0 70/30 45 933 4.0–4.5 73/27 43 1019 4.5–5.0 74/26 42 1057 5.0+ 75/25 42 1071
used to detect a potential treatment effect on milking time if the cluster would be removed at a higher milk flow level. MMT2 was calculated manually from the milk flow
curves.
Mathematical and statistical evaluations
The herd was subdivided into three groups based on the individual peak flow rate in the treatment PS+/MB – . In group 1 the PFR was < 3.2 kg/min, in group 2 between 3.2 and 4.5 kg/min, and in group 3 > 4.5 kg/min.
All data are presented as means and SEM for the herd,
for each group separately and for the different treatments. For the statistical evaluation a Mixed Procedure of SAS (Release 8.02) was used. The model contained the treat-ment, time of milking, stage of lactation, animal group and the individual cow as the repeated subject. None of the interactions included in the model (treatmentranimal group, treatmentrmilking time and treatmentrstage of lactation) were significant. They were therefore excluded from the model. Differences of least squares means were localized by t test and considered significant if P < 0.05. Treatment differences with respect to the frequency of oc-currence of bimodalities were tested for significance (P< 0.05) by using a Multtest Procedure of SAS.
Results
TMY did not differ significantly between treatments (Tables 2, 3). In group 1 TMY was lower than in group 2 and than in group 3, and the value in early lactation was higher than mid and late lactation, and mid was higher than late lactation (P< 0.05). At morning milking TMY was significantly higher than at evening milking at a herd level and in all groups. In group 1 TMY was significantly lower in early and late compared with mid lactation. In group 2 TMY was higher in early than in mid and late lactation (P< 0.05). If all experimental animals were considered, AMF was significantly lower in PS – /MB – than in PS+/ MB – and PS+/MB+. PS+/MB+ had the highest values. In group 1 AMF was significantly lower than in groups 2 and 3, in group 2 AMF was lower than in group 3. At a herd level, AMF was higher in early lactation than in mid and late lactation, and in mid lactation AMF was higher than in late lactation (P< 0.05). Within groups 2 and 3 AMF was higher (P < 0.05) in PS+/MB+ than in PS – /MB – . In group 1 no significant difference could be observed. Although dif-ferences were often non-significant, highest values of AMF were observed in all animal groups (groups 1, 2, 3 and the herd) in treatment PS+/MB+, followed by PS+/MB– and PS – /MB – (Tables 2, 3). AMF was significantly lower in early and late compared with mid lactation in group 1 (P< 0.05). In group 2 AMF was lower in early than in mid and late lactation, and in group 3 AMF was highest for early compared with mid and finally late lactation (P < 0.05). At morning milking AMF was significantly higher at a herd level and in all groups.
PFR was significantly higher (Fig. 1) in treatment PS+/ MB+ than in the other treatments in groups 2 and 3. PFR in treatments PS+/MB – and PS – /MB– did not differ significantly. Only in group 1, the cows with the lowest PFR ( < 3.2 kg/min), PFR did not significantly differ between any treatments (Tables 2, 3). PFR was lower in group 1 than in group 2 and group 3, respectively. PFR was higher at morning than at evening milkings and higher in early and mid compared with late lactation (P< 0.05). In group 2 PFR was significantly lower in early than in mid and late lactation and PFR was significantly higher in early compared with mid and compared with late lac-tation.
tPFR was significantly longer in group 2 in PS – /MB – compared with the other treatments (Table 3). tPFR was longer in group 1 compared with groups 2 and 3 and in group 2 compared with group 3 (P < 0.05). tPFR was higher in early and mid lactation than in late lactation (P< 0.05). tPFR was significantly shorter in early than in mid and late lactation in group 1. In group 3 tPFR was significantly higher in early and mid lactation compared with late lac-tation.
Duration of incline over the whole herd was signifi-cantly different between all treatments. dI was longer in group 2 compared with groups 1 and 3 and it was shorter during evening than morning milkings (P< 0.05). A sig-nificant difference was seen in groups 1 and 2 between PS – /MB– and PS+/MB – and in group 3 in PS+/MB – compared with PS – /MB – and PS+/MB+. In all groups and consequently over the whole herd, dI was shortest in PS+/ MB – , followed by PS+/MB+ and PS – /MB – (Tables 2, 3). In group 1 dI was longer for early and late lactation com-pared with mid lactation, whereas in group 2 dI was higher at evening than morning milkings (P< 0.05). dI was shorter in early and mid lactation than in late lactation in group 2 and in group 3 it was longer for early and mid compared with late lactation (P < 0.05).
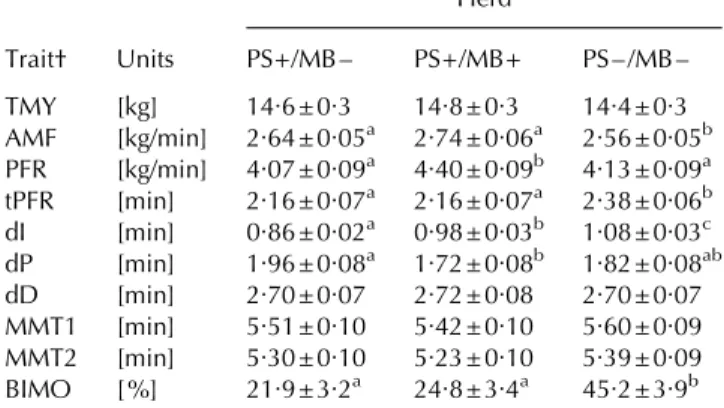
Table 2. Milk flow traits of different treatments in the herd
Trait† Units Herd PS+/MB – PS+/MB+ PS – /MB – TMY [kg] 14.6 ± 0.3 14.8 ± 0.3 14.4 ± 0.3 AMF [kg/min] 2.64 ± 0.05a 2.74 ± 0.06a 2.56 ± 0.05b PFR [kg/min] 4.07 ± 0.09a 4.40 ± 0.09b 4.13 ± 0.09a tPFR [min] 2.16 ± 0.07a 2.16 ± 0.07a 2.38 ± 0.06b dI [min] 0.86 ± 0.02a 0.98 ± 0.03b 1.08 ± 0.03c dP [min] 1.96 ± 0.08a 1.72 ± 0.08b 1.82 ± 0.08ab dD [min] 2.70 ± 0.07 2.72 ± 0.08 2.70 ± 0.07 MMT1 [min] 5.51 ± 0.10 5.42 ± 0.10 5.60 ± 0.09 MMT2 [min] 5.30 ± 0.10 5.23 ± 0.10 5.39 ± 0.09 BIMO [%] 21.9 ± 3.2a 24.8 ± 3.4a 45.2 ± 3.9b abcValues in the same row without common superscript are significantly different (P < 0.05)
Both duration of plateau (dP) and duration of decline (dD) did not significantly differ among the treatments. Except for the herd, dP was significantly longer for PS+/ MB+ than PS+/MB – . dP was longer in group 1 than in group 2 and than in group 3 (P< 0.05). dD was shorter in group 1 than in group 2 and for early lactation dP was higher than mid and late lactation, and mid was higher than late lactation (P< 0.05). At evening milkings dP was always significantly shorter for all animals and for all groups. In group 1 dP was significantly longer in early than late lactation, in group 2 it was significantly shorter in early than in mid and late lactation, and in group 3 it was significantly longer in early compared with mid and at the end late lactation. dD was shorter in early and mid lactation compared with late lactation for group 1, while in group 2 dD was higher in early compared with mid and late lactation and in group 3 it was shorter for early and late lactation as compared with mid lactation (P < 0.05).
MMT1 and MMT2 were not significantly different
be-tween the different treatments (Fig. 1). In all groups (except for MMT2in group 2) and over the whole herd both
par-ameters were numerically shortest in PS+/MB+, followed by PS+/MB – and then PS – /MB – (Tables 2, 3). MMT1and
MMT2were longer in group 1 compared with group 2 and
at the end group 3, and in early lactation they were longer than in mid and late lactation and mid were longer than late lactation (P < 0.05). MMT1 and MMT2 were
signifi-cantly shorter during evening than during morning milk-ings at a herd level and all groups except for MMT1 in
group 2. In group 2 MMT1 and MMT2 were longer for
early compared with mid and late lactation and in group 3 they were longer for early and mid compared with late lactation (P< 0.05).
Bimodality was most frequent in PS – /MB – followed by PS+/MB+ (except group 1) and PS+/MB – (Fig. 1). In group 1 the frequency of bimodality was significantly higher in PS – /MB – than in PS+/MB– and PS+/MB+. In group 2 and over the whole herd it was higher in PS – /MB – than in
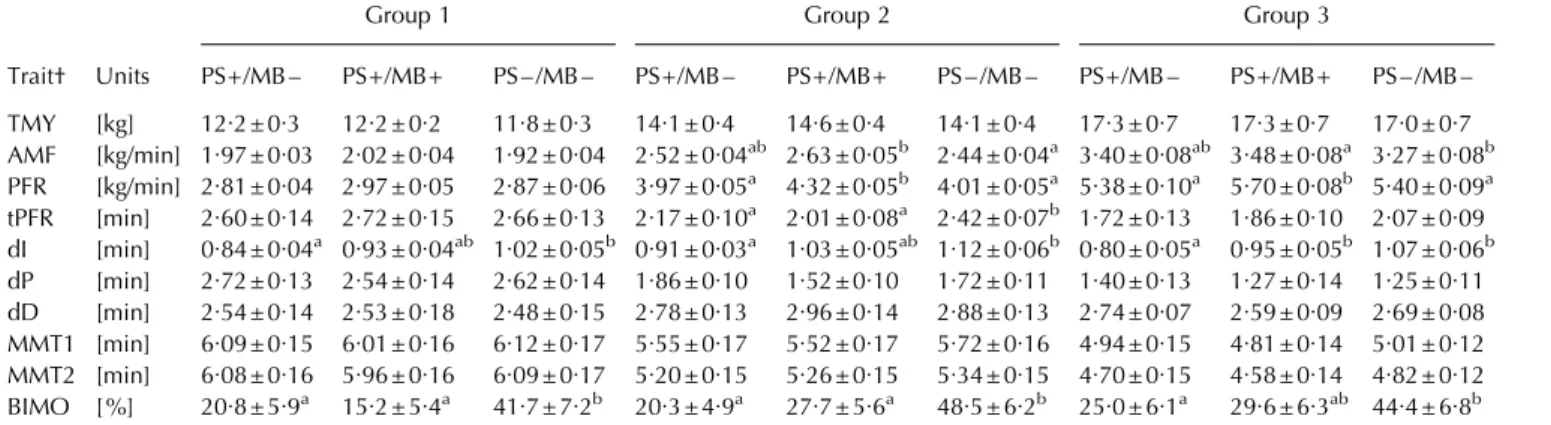
Table 3. Milk flow traits of different treatments in different groups
Trait† Units
Group 1 Group 2 Group 3
PS+/MB – PS+/MB+ PS – /MB – PS+/MB – PS+/MB+ PS – /MB – PS+/MB – PS+/MB+ PS – /MB – TMY [kg] 12.2 ± 0.3 12.2 ± 0.2 11.8 ± 0.3 14.1 ± 0.4 14.6 ± 0.4 14.1 ± 0.4 17.3 ± 0.7 17.3 ± 0.7 17.0 ± 0.7 AMF [kg/min] 1.97 ± 0.03 2.02 ± 0.04 1.92 ± 0.04 2.52 ± 0.04ab 2.63 ± 0.05b 2.44 ± 0.04a 3.40 ± 0.08ab 3.48 ± 0.08a 3.27 ± 0.08b PFR [kg/min] 2.81 ± 0.04 2.97 ± 0.05 2.87 ± 0.06 3.97 ± 0.05a 4.32 ± 0.05b 4.01 ± 0.05a 5.38 ± 0.10a 5.70 ± 0.08b 5.40 ± 0.09a tPFR [min] 2.60 ± 0.14 2.72 ± 0.15 2.66 ± 0.13 2.17 ± 0.10a 2.01 ± 0.08a 2.42 ± 0.07b 1.72 ± 0.13 1.86 ± 0.10 2.07 ± 0.09 dI [min] 0.84 ± 0.04a 0.93 ± 0.04ab 1.02 ± 0.05b 0.91 ± 0.03a 1.03 ± 0.05ab 1.12 ± 0.06b 0.80 ± 0.05a 0.95 ± 0.05b 1.07 ± 0.06b dP [min] 2.72 ± 0.13 2.54 ± 0.14 2.62 ± 0.14 1.86 ± 0.10 1.52 ± 0.10 1.72 ± 0.11 1.40 ± 0.13 1.27 ± 0.14 1.25 ± 0.11 dD [min] 2.54 ± 0.14 2.53 ± 0.18 2.48 ± 0.15 2.78 ± 0.13 2.96 ± 0.14 2.88 ± 0.13 2.74 ± 0.07 2.59 ± 0.09 2.69 ± 0.08 MMT1 [min] 6.09 ± 0.15 6.01 ± 0.16 6.12 ± 0.17 5.55 ± 0.17 5.52 ± 0.17 5.72 ± 0.16 4.94 ± 0.15 4.81 ± 0.14 5.01 ± 0.12 MMT2 [min] 6.08 ± 0.16 5.96 ± 0.16 6.09 ± 0.17 5.20 ± 0.15 5.26 ± 0.15 5.34 ± 0.15 4.70 ± 0.15 4.58 ± 0.14 4.82 ± 0.12 BIMO [%] 20.8 ± 5.9a 15.2 ± 5.4a 41.7 ± 7.2b 20.3 ± 4.9a 27.7 ± 5.6a 48.5 ± 6.2b 25.0 ± 6.1a 29.6 ± 6.3ab 44.4 ± 6.8b abValues in the same group without common superscript are significantly different (P < 0.05)
† See text for definitions of abbreviations
(a) min 0 2 4 6 8 min 0 2 4 6 8 min 0 2 4 6 8 kg/min 0 1 2 3 4 (b) kg/min 0 1 2 3 4 5 6 (c) kg/min 0 1 2 3 4 5 6
Fig. 1. Milk flow curves of a cow of group 1 = PFR < 3.2 kg/min (a), of group 2 = PFR 3.2–4.5 kg/min (b) and of group 3 = PFR> 4.5 kg/min (c) with the different treatments (PS+/MB – : ; PS+/MB+ : —; PS – /MB – : – –). PS: pre-stimulation ; MB: milk flow-controlled b-phase.
PS+/MB+ and PS+/MB – (P < 0.05). In group 3 it was sig-nificantly more frequent in PS – /MB – than in PS+/MB – .
Discussion
TMY did not change throughout the experiment. This in-dicates complete emptying of the mammary gland in every treatment and for every group.
AMF did not differ between treatments in all groups (except in group 2 between PS+/MB+ and PS – /MB – ). Thus, even if there was a higher PFR in all observed groups and all over the groups (herd) AMF and TMY remained unchanged. This is in contrast to the report by Spencer et al. (2007), where AMF augmented with elevating ratio. Obviously, the milk ejection rate, i.e. the rate of milk transferred from the alveolar tissue into the cisternal cavi-ties, is a limiting factor for the milk flow rate (Pfeilsticker et al. 1995). At the start of milking the cistern is well filled with milk and the milk ejection rate is high owing to well-filled alveoli. Therefore, the milk flow rate during this period is mainly determined by the teat anatomy and specifications of liner, pulsation, and vacuum (Thomas et al. 1991; Pfeilsticker et al. 1995; Hamann & Mein, 1996; Weiss et al. 2004 ; Spencer et al. 2007). In contrast, towards the end of milking, the delivery of milk from the secretory tissue in the cistern is slowing down owing to the gradual emptying of the alveoli, i.e. the milk ejection rate is decreasing. This process cannot be influenced by ad-justments of the milking machine and the milk ejection rate can be a major limiting factor for the milk flow towards the end of milking, and a flat decline of milk flow in each quarter probably represents the decline of milk ejection (Pfeilsticker et al. 1995). In PS+/MB+ peak flow rates were higher than in PS – /MB – or in PS+/MB – . If milking was performed with milk flow-controlled b-phase (PS+/MB+) the pulsation ratio increased and the pulsation rate declined, causing an overall elongated liner-open time if ample milk was present in the cisternal cavities. As long as this situation was maintained, the milk flow rate could be increased in response to a longer liner-open phase. Potentially it is possible that the increase in milk flow could prevent the liner from closing and could cause oedema. But high milk flow lasts only about 2–3 min and then the machine is already changing the pulsation ratio and rate, and therefore there would be minimal oedema. Milking with milk flow-controlled b-phase is even more gentle on the teat because of the changing pulsation ratio and rate. Owing to the increase of the pulsation ratio, PFR soars as long as a buffer of milk is available in the cistern (Pfeilsticker et al. 1995 ; Hamann & Mein, 1996; Spencer et al. 2007). tPFR occurred later (except for group 2) and dI was longer than can be explained by a higher level of PFR which needed to be reached stepwise in the treatment with gradually elongated b-phase. Because TMY and AMF did not change a lot between the different treatments, MMT1 remained unchanged (MMT1lasted until 0.2 kg/min). If the
milk ejection rate becomes limiting for milk flow towards the end of milking, it seems possible that the final period of milking at very low milk flow rates < 0.5 kg/min has a great effect on the remaining milking time. Therefore a difference between treatments seemed possible if the clusters would be removed already at 0.5 kg/min (MMT2).
However, also at this higher level of potential cluster re-moval no treatment differences were observed. Bimodality of milk flow was most frequent in PS – /MB – . This is allegedly due to a delayed occurrence of milk ejection while the cisternal milk is close to being completely re-moved. As repeatedly shown (Mayer et al. 1984; Bruckmaier & Blum, 1996; Weiss et al. 2003) a not-fully pre-stimulated cow shows a transient reduction of milk flow (bimodality), after the cisternal part is milked out and before the milk ejection occurs.
Effects on PFR and dI were more distinct in the two groups with higher PFR (groups 2 and 3) than in the group with the lowest PFR (group 1).
In conclusion, adaptation of the b-phase on the milk flow (PS+/MB+) causes an increased milk flow rate most pronounced in animals that already show high milk flow rate under standard conditions. This effect is, however, only present as long as milk is available in the cisternal cavities. In particular, towards the end of milking the rate of milk ejection can become a limiting factor for milk flow. During this period, an adaptation of the b-phase on the milk flow (PS+/MB+) has no effect. Therefore, the performed adaptations (PS+/MB+) have mainly an effect on PFR and not on AMF and total milking time.
Bimodality was most frequently seen in milking with a minimum of teat cleaning and without milk flow con-trolled b-phase (PS – /MB – ).
References
Ayadi M, Caja G, Such X & Knight CH 2003 Use of ultrasonography to estimate cistern size and milk storage at different milking intervals in the udder of diary cows. Journal of Dairy Research 70 1–7
Ayadi M, Caja G, Such X, Rovai M & Albanell E 2004 Effect of different milking intervals on the composition of cisternal and alveolar milk in dairy cows. Journal of Dairy Research 71 304–310
Bruckmaier RM, Schams D & Blum JW 1994a Continuously elevated concentrations of oxytocin during milking are necessary for complete milk removal in dairy cows. Journal of Dairy Research 61 323–334 Bruckmaier RM, Rothenanger E & Blum JW 1994b Measurements of
mammary gland cistern size and determination of the cisternal milk fraction in dairy cows. Milchwissenschaft 49 543–546
Bruckmaier RM & Blum JW 1996 Simultaneous recording of oxytocin release, milk ejection and milk flow during milking of dairy cows with and without prestimulation. Journal of Dairy Research 63 201–208
Bruckmaier RM 2005 Normal and disturbed milk ejection in dairy cows. Domestic Animal Endocrinology 29 268–273
Gleeson DE, O’Callaghan EJ & Rath MV 2004 Effect of liner design, pul-sator setting, and vacuum level on bovine teat tissue changes and milking characteristics as measured by ultrasonography. Irish Veterinary Journal 57 289–296
Hamann J & Mein GA 1996 Teat thickness changes provide biological test for effective pulsation. Journal of Dairy Research 63 179–189
Mayer H, Schams D, Worstorff H & Prokopp A 1984 Secretion of oxytocin and milk removal as affected by milking cows with and without manual stimulation. Journal of Endocrinology 103 355–361 Pfeilsticker HU, Bruckmaier RM & Blum JW 1995 Interruption of
machine milking in dairy cows : effects on intramammary pressure and milking characteristics. Journal of Dairy Research 62 559–566 Pfeilsticker HU, Bruckmaier RM & Blum JW 1996 Cisternal milk in dairy
cow during lactation and after preceding teat stimulation. Journal of Dairy Research 63 509–515
Sandrucci A, Tamburini A, Bava L & Zucali M 2007 Factors affecting milk flow traits in dairy cows: Results of a field study. Journal of Dairy Science 90 1159–1167
Schams D, Mayer H, Prokopp A & Worstorff H 1984 Oxytocin secretion during milking in dairy cows with regard to the variation and import-ance of a threshold level for milk removal. Journal of Endocrinology 102 337–343
Smith VR & Petersen WE 1946 The effect of increasing the negative pressure and widening of the vacuum-release ratio on the rate of re-moval of milk from the udder. Journal of Dairy Science 29 45–53 Spencer SB, Shin JW, Rogers GW & Cooper JB 2007 Short
Communication : Effect of vacuum and ratio on the performance of a monoblock silicone milking liner. Journal of Dairy Science 90 1725–1728
Thomas CV, Force DK, Bremel DH & Strasser S 1991 Effects of pulsation ratio, pulsation rate, and teatcup liner design on milking rate and milk production. Journal of Dairy Science 74 1243–1249
Weiss D, Dzidic A & Bruckmaier RM 2003 Effect of stimulation intensity on oxytocin release before, during and after machine milking. Journal of Dairy Research 70 349–354
Weiss D, Weinfurtner M & Bruckmaier RM 2004 Teat anatomy and its relationship with quarter and udder milk flow characteristics in dairy cows. Journal of Dairy Science 87 3280–3289