Range perception through apparent image speed
in freely flying honeybees
M.V. SRINIVASAN,
1M. LEHRER,
2W.H. KIRCHNER,
3AND S.W. ZHANG
4'Centre for Visual Sciences, Research School of Biological Sciences, Australian National University, Canberra, Australia 2Abtl. Neurobiologie, Zoologisches Institut der Universitaet Zuerich, Winterthurerstrasse - 190,
CH-8057 Zurich, Switzerland 3
Zoologisches Institut der Universitaet, Lehrstuhl fuer Tierphysiologie, D-8700 Wuerzburg, Germany "•institute of Biophysics, Academia Sinica, Beijing, Peoples Republic of China
(RECEIVED November 1, 1990; ACCEPTED January 9, 1991)
Abstract
When negotiating a narrow gap, honeybees tend to fly through the middle of the gap, balancing the distances to the boundary on either side. To investigate the basis of this "centering response," bees were trained to fly through a tunnel on their way to a feeding site and back, while their flight trajectories were filmed from above. The wall on either side carried a visual pattern. When the patterns were stationary vertical gratings, bees tended to fly through the middle of the tunnel, i.e. along its longitudinal axis. However, when one of the gratings was in motion, bees flying in the same direction as the moving grating tended to fly closer to it, while bees flying in the opposite direction tended to fly closer to the stationary grating. This demonstrates, directly and unequivocally, that flying bees estimate the distances of surfaces in terms of the apparent motion of their images. A series of further experiments revealed that the distance to the gratings is gauged in terms of their apparent angular speeds, and that the visual system of the bee is capable of measuring angular speed largely independently of the spatial period, intensity profile, or contrast of the grating. Thus, the motion-sensitive mechanisms mediating range perception appear to be qualitatively different from those that mediate the well-known optomotor response in insects, or those involved in motion detection and ocular tracking in man.
Keywords: Distance, Depth, Optical flow, Apparent motion, Vision, Insect flight
Introduction
The eyes of most insects are comparatively close together, and lack focusing mechanisms, so that they must use cues other than stereopsis or accommodation to gauge the distances of objects in the environment. It has been suggested that moving insects perceive the distance of objects in terms of the speeds of their images on the retina, a higher image speed being associated with a smaller range (Wallace, 1959; Collett, 1978; Eriksson, 1980; Goulet et al., 1981; Collett & Harkness, 1982; Horridge, 1986; Cheng et al., 1987; Collett, 1988; Lehrer et al., 1988; Sriniva-san et al., 1989). Recently, Sobel (1990a, 19906) confirmed Wallace's (1959) original finding that locusts use a peering mo-tion of the head to infer object range.
We recently demonstrated that honeybees flying along a tun-nel tend to fly through the middle by balancing the apparent motions of the images of the walls on the two sides (Kirchner & Srinivasan, 1989). The present study explores this "centering response" quantitatively, in an attempt to discover the param-eters of image motion that are used to extract range
informa-Reprint requests to: M.V. Srinivasan, Centre for Visual Sciences, Re-search School of Biological Sciences, Australian National University, P.O. Box 475, Canberra, A.C.T. 2601, Australia.
tion, and to probe the mechanisms by which these parameters are measured. In particular, we compare the roles played by two parameters: (1) contrast frequency and (2) apparent image speed.
The well-studied optomotor response in insects is mediated by a motion-detecting mechanism that is sensitive to contrast frequency (review by Reichardt, 1987). Such a system is, how-ever, incapable of measuring image speed unambiguously, and independently of the structure of the image (review by Borst & Egelhaaf, 1989). On the other hand, a system that measures the apparent speed of an image independently of its structure would be capable of providing a reliable estimate of range.
In the present study, we examine how range estimation is in-fluenced by apparent image speed and contrast frequency, by presenting freely flying bees with a variety of situations in which these two parameters are placed in competition.
Methods
Experimental technique
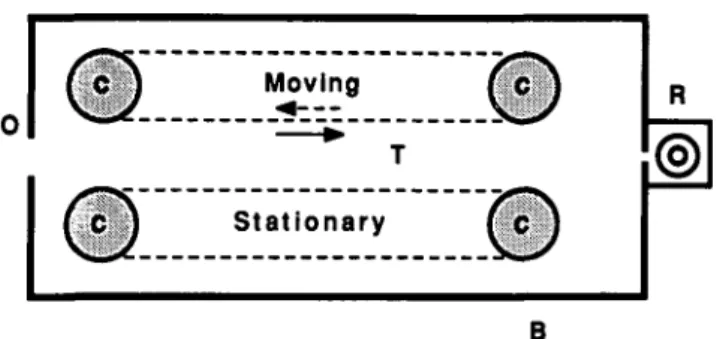
The experimental apparatus was a tunnel formed by two walls 40 cm long, 20 cm high, and 12 cm apart (Fig. 1). Each wall consisted of a sheet of rubber stretched around a pair of drums.
520
M. V. Shnivasan et al.
B
Fig. 1. Schematic, overhead view of experimental apparatus (not to scale). Bees are trained to enter the perspex box B through the opening O and to fly along tunnel T to receive a reward of sugar water in the box R. Each side wall of the tunnel consists of a sheet of rubber stretched around a pair of drums (C). Gratings or other patterns are af-fixed to the sheets. A motor coupled to one of the drums enables the pattern on one of the walls to be moved in either direction (arrows) at any desired speed.
Gratings or other patterns (described below) were affixed to the
sheets. A d.c. motor coupled to one of the drums enabled the
pattern on one of the walls to be moved in either direction
(ar-rows, Fig. 1) at any desired speed.
Groups of 4-6 freely flying honeybees (Apis mellifera) were
marked and trained to enter the apparatus, fly along the
tun-nel, and receive a reward of sugar solution in a box at the end
of the tunnel (Fig. 1). After the bees had received ca. 60
re-wards, their flight trajectories were video-filmed from above as
they flew along the tunnel in either direction (i.e. toward the
re-ward, or homeward after having been rewarded). Depending
upon the experiment, both walls were stationary or one of them
was in motion (Fig. 1). In some experiments, sheets of
transpar-ent perspex were placed in front of the walls to prevtranspar-ent the
flight trajectories from being influenced by air currents
gener-ated by the moving patterns. However, since experiments
con-ducted without these sheets revealed no obvious differences,
data from both kinds of experiments were pooled.
The patterns on the walls usually consisted of a vertically
ori-ented, one-dimensional, black-and-white grating with an
inten-sity profile that was square-wave, random, sinusoidal, or
sawtooth-shaped. In some experiments, one of the walls carried
a sheet of white (photocopying) paper, or gray paper of the
same mean luminance and spectral composition as the gratings.
The square-wave and random gratings, of contrast 0.85,
were constructed by glueing strips of black paper onto a
back-ground consisting of white (photocopying) paper. The
square-wave gratings had periods of 2.5 cm, 3.5 cm, 7 cm, and 10 cm.
The random grating was constructed similarly, except that the
widths of successive black bars and intervening white spaces
were random, integral multiples of 0.4 cm, determined by the
random-number generator on a computer. The sinusoidal and
sawtooth-profile gratings were created using a computer-driven
laser printer, capable of generating 64 gray levels in square
pix-els of size 0.7 mm. These patterns were carefully screened for
defects arising from toner deficiencies in the laser printer.
Screening was done by visual inspection, as well as through
in-tensity-profile measurements made using a video camera
cou-pled to a computer-driven frame grabber. The sinusoidal
gratings had periods of 1.5 cm, 3 cm, or 6 cm. The Michelson
contrasts used [(/
max- /
min)/(/
max + 4in)]. as derived from
the measured intensity profiles] were 0.60, 0.15, or lower than
0.05 (nominally, homogeneous gray). The sawtooth-profile
grat-ings had a period of 3.0 cm, and a contrast of 0.75.
The (angular) spatial frequencies of the gratings, as seen by
a bee flying along the axis of the tunnel, ranged from 0.01-0.04
cycle/deg for the square-wave gratings, 0.017-0.07 cycle/deg
for the sinusoidal gratings, and 0.035 cycle/deg for the
saw-tooth-profile gratings. The random grating possessed a
spec-trum of spatial frequencies distributed over the range 0-0.13
cycle/deg. Our prior knowledge of the spatial acuity of the
hon-eybee's visual system (e.g. Srinivasan & Lehrer, 1988) indicates
that all of the gratings used in these experiments should have
been clearly resolvable.
Analysis of flight paths
Flight trajectories, recorded at 25 frames/s by the camera and
video recorder, were subsequently analyzed frame-by-frame to
measure average positions along the width of the tunnel,
aver-age flight velocities, etc. This was done either manually-by
plotting successive positions of bees on a sheet of transparent
acetate paper affixed to the screen of the video monitor-or by
superimposing the video image onto a digitizing tablet using a
half-reflecting mirror. Detailed histograms of bee positions, as
shown in Figs. 2 and 3, were obtained by analyzing the digitized
data on a computer to determine the relative frequency with
which bees were found in each cell of an array of 20 x 10 cells.
(This array represented a total area of 26 x 12 cm
2). These
rel-ative frequencies are depicted as an array of squares, the linear
dimension of each square being proportional to frequency.
In other instances (as in the data presented in Figs. 4-7, and
Fig. 11), each trajectory was assigned a single mean position
along the width of the tunnel, by averaging the y coordinates
of bee positions digitized along a central 26-cm segment of the
trajectory. In some instances (Figs. 4 and 11), the mean
posi-tions of several trajectories were then averaged to obtain a mean
trajectory position and a standard deviation about this mean.
Velocities of bees, and of pattern movement, were obtained by
measuring the distance travelled over a known number of
frames. Knowing these and the position of the trajectory along
the tunnel width, the apparent angular speeds of the patterns
on the eyes of the flying bee could be calculated using the
for-mulae shown in Fig. 5.
Results
When the two walls of the tunnel are stationary and carry
iden-tical gratings, bees tend to fly through the middle of the tunnel
(on average), as shown in Fig. 2a. The mean position of the
flight trajectories along the width of the tunnel is not
signifi-cantly displaced from the axis of the tunnel (?-test, P > 0.30).
How were the bees gauging and balancing the distances to the
gratings on the two sides? One possibility is that they were
bal-ancing the speeds of the retinal images of the gratings on the
two eyes. To test this possibility, we examined flight
trajecto-ries when one of the gratings was in motion. When this grating
moved at a constant speed in the direction of the bees' flight —
thereby reducing the velocity of retinal image motion on that
eye relative to the other eye —the bees' trajectories shifted
to-ward the side of the moving grating (Fig. 2b). However, when
the grating moved in a direction opposite to that of the bees'
flight-thereby increasing the speed of retinal image motion on
n •= 64 • • • • • • n = 37 • - • • • . » • » . . -. -. • n = 56 n = 58 53
Fig. 2. The centering response: Experient demonstrating that flying bees use apparent image motion to estimate range. Bees were trained to fly along a tunnel, in which the side walls carried vertically oriented square-wave gratings of period 3.5 cm. Flights were filmed from above at 25 frames/s with (a) stationary gratings on either side, (b) one grating moving at a speed of 20 cm/s in the direction of the bees' flight, (c) this grating moving at 20 cm/s in a direction opposite to that of the bees' flight, and (d,e) the moving grating replaced by a homogeneously grey sheet. The left-hand column shows two typical trajectories (depicted by the two different bee-symbols) in each case. The right-hand column shows the spatial distributions of the bees' positions, ob-tained by analyzing a number of trajectories in each case, as described in Methods. Flights in both directions were analyzed in (a), (d), and (e), while flights in the directions of the large arrows were analyzed in (b) and (c). The histograms on the extreme right depict the distribution of the bees' trajectories along the width of the tunnel, averaged over the central, 26-cm segments that were analyzed (see Methods). The arrowhead next to each histogram depicts the mean value of the distribution, n = number of trajectories analyzed in each case.
that eye relative to the other eye —the trajectories shifted away from the side of the moving grating (Fig. 2c). Finally, when one of the gratings was replaced by a homogeneously gray sheet of paper and the other grating was stationary, the trajectories shifted toward the homogeneous side (Fig. 2d,e). There is a sig-nificant difference between the average locations of the flight trajectories, measured along the width of the tunnel, between
the experimental conditions corresponding to Figs. 2a,b; 2a,c; 2b,c; 2a,d; 2a,e; and 2d,e (Mest, P < 0.001 for all cases).
These findings suggest that when the walls are stationary, the bees maintain equidistance by balancing the apparent speeds of the retinal images in the two eyes. A slower motion on one eye is evidently taken to imply that the grating on that side is fur-ther away, causing the bee to fly along a trajectory closer to it;
522 M. V. Srinivasan el al.
Horizontal g r a t i n g
n=23
• • •xwxxxx
Vertical grating n=17 • • • • • • xXXXxxXxXN<1
n=24I •
• • •xxxxxx]
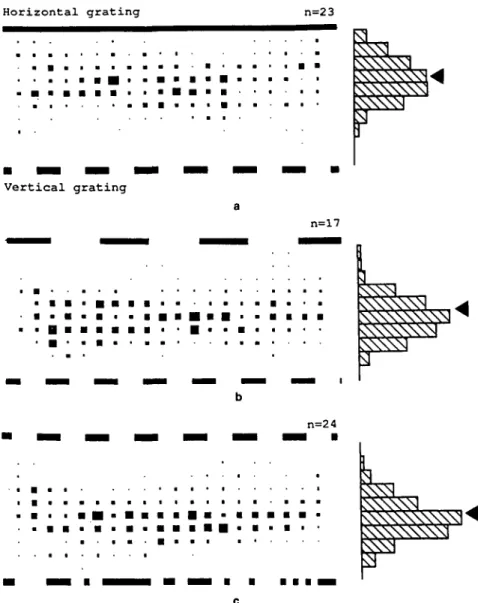
vXXXXXXXXVsi •I H • MMMi • • • • • • • • • ^ CFig. 3. Distribution of bees' positions in the tunnel when the two walls carry different, stationary patterns. Flights in both direc-tions were analyzed. In all three cases, the pattern on one wall is a vertically oriented square-wave grating of period 3.5 cm. In (a), the pattern on the other wall is a horizontally oriented square-wave grating of the same period. In (b), it is a vertically oriented square-wave grating of period 7.0 cm. In (c), it is a spatially random grating with characteristics as described in Methods. In (b) and (c), the mean position of the bees' trajectories (arrowhead) is not displaced significantly from the tunnel axis, whilst in (a), bees fly significantly closer to the wall carrying the horizontal grating. Histograms have the same meaning as in Fig. 2. Comments in text, n = number of trajectories analyzed in each case.
a faster motion of the image, on the other hand, has the oppo-site effect. When one eye sees homogeneous grey, it receives no movement stimulus and the bees consequently fly closer to that side.
What parameters of image motion mediate the centering response?
The most likely interpretation of the results described so far is that the flying bees are trying to balance the apparent angular speeds, in the horizontal plane, of the images on the two eyes as they fly along the tunnel. There is, however, another possi-bility, namely, that they infer the distances to the two walls by moving alternately toward one wall and then the other (i.e. zig-zagging along the tunnel) and comparing the looming (rate of
expansion) of the patterns on the two walls. Although this seems unlikely (from the relatively straight profiles of the flight trajectories), we tested for it by analyzing the flight trajectories of bees flying through the tunnel when both walls were station-ary, with one wall carrying a horizontal grating, and the other wall a vertical one. Although looming cues can be obtained from the horizontal grating as well as the vertical grating, hor-izontal motion cues would be provided only by the vertical grat-ing. Therefore, we would expect bees to fly close to the axis of the tunnel if they use looming-motion cues, but close to the hor-izontal grating if they use horhor-izontal-motion cues. The results (Fig. 3a) show that the bees fly distinctly closer to the horizon-tal grating: the mean position of the trajectories deviates signif-icantly from the tunnel axis (P < 0.0005). Thus, the importance of looming cues seems negligible. This conclusion is supported
X = 5 cm X z 5 c
4-
-i-53 34 35 58 20 28 46 14 10 58 17 a X=5 X = 2.5 b X=2.5 X = 5 c = 2.5 d = 2.5
+•
i
84 63 so 85 35 f 22 54 16= 10
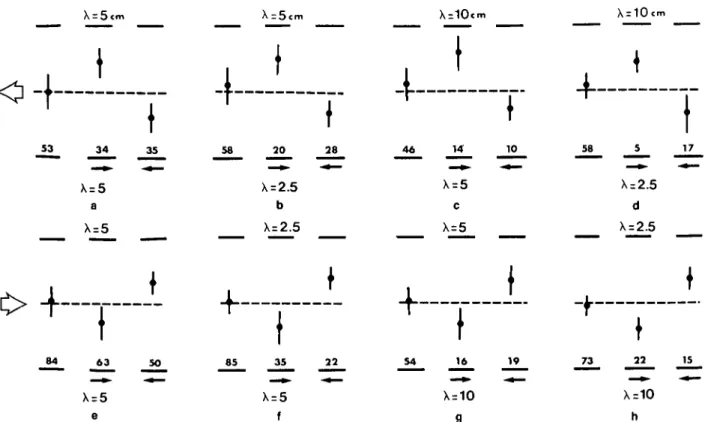
g 19 73 22 X=10 h 15Fig. 4. Contrast-frequency invariance of the centering response: Analysis of flight trajectories for a number of different com-binations (a-h) of vertically oriented square-wave gratings on the two walls. Each of the eight panels shows the mean and the standard deviation of the positions of the flight trajectories for a particular combination of gratings, of period X, when both gratings are stationary (left-hand side of each panel), or when one of the gratings moves at a constant speed of 27.5 cm/s to-ward the reto-ward box (center), or the exit (right), as shown by the small arrows. The panels (a-d) represent flights toto-ward the exit, whilst the panels (e-h) represent flights toward the reward box (as shown by the large arrows). In all cases, the mean po-sition of the trajectories does not deviate significantly from the tunnel axis when both gratings are stationary, but does so in the appropriate direction (as in Fig. 2) when one of the gratings is in motion. The numbers represent the number of flights an-alyzed in each case.
by the finding that the position of the flight trajectories is
strongly affected by horizontal motion of a vertical grating
(Figs. 2b,c). If the centering response were mediated primarily
by looming-motion cues, one would not expect the response to
be affected by the superposition of a horizontal component of
motion, as this would not affect the looming component.
Dependence of the centering response on contrast frequency
The experiments described so far leave open the possibility that
the bees were comparing the temporal frequencies of the
inten-sity fluctuations ("contrast frequencies") produced by the
suc-cessive dark and light bars of the gratings, as seen by the
individual photoreceptors of the two eyes, rather than the
ap-parent angular velocities of the patterns on the two walls. It is
important to consider this possibility because it is now
well-es-tablished that optomotor behavior —the best known
motion-driven response in insects —is a response that depends upon
contrast frequency, rather than angular speed (reviews by
Reichardt, 1987; Borst & Egelhaaf, 1989).
To test the importance of contrast frequency in the
center-ing response, we analyzed the trajectories of bees flycenter-ing along
the tunnel when the two walls carried stationary gratings, but
with the grating on one side having a spatial frequency twice
that on the other (Fig. 3b). Despite the fact that this
configu-ration produced twice the contrast frequency on one eye as on
the other, the mean position of the bees' trajectories did not
de-viate significantly from the axis of the tunnel (Fig. 3b; P > 0.4),
indicating that contrast frequency is not an important
param-eter in the centering response. In a further experiment, again
performed with stationary patterns on the two walls, one wall
carried a periodic grating whilst the other carried a grating that
was spatially random, comprising a broad range of spatial
fre-quencies (details in Methods). Here again, the bees' trajectories
were located close to the tunnel axis (Fig. 3c; P > 0.05),
indi-cating that, as far as the centering response is concerned, the
temporal pattern of stimulation of individual photoreceptors is
not crucial to the measurement of apparent motion.
The role of contrast frequency in the measurement of
appar-ent motion was examined more extensively in a series of
exper-iments using a number of different combinations of spatial
frequencies for the gratings on the two walls. The results,
shown in Fig. 4, indicate that, as long as both gratings are
sta-tionary and resolvable by the eye, the bees' trajectories are
cen-tered on the axis of the tunnel regardless of the spatial
frequencies of the gratings on the two sides. The insensitivity
of the centering response to spatial frequency (and therefore
contrast frequency) is evident even when the spatial frequencies
524 M. V. Srinivasan et al.
For equal apparent angular speeds, and VO > V 1 :
di VO d2 di + d2 VO -di V1
vo
2V0 -V1 V1 d2 VO di V1 n V0<V1
vo
2V0 < 0 - V1 - V1 V1 D = < VO< V1 -V1 0 VO D = V0> VO 2V0 0 V1 - V1 0.0 -100 100 VO = V1 - - 38crtVsecBee velocity, VO (cm/sec)
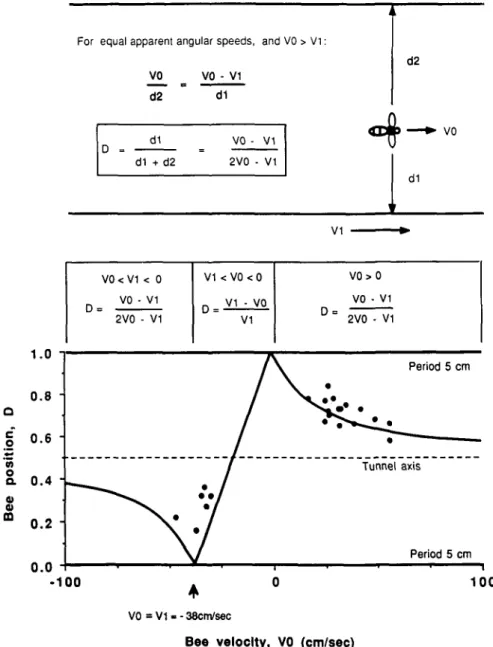
Fig. 5. Dependence of the centering response on apparent angular velocity: Experiment testing the hypothesis that bees balance the apparent angular speeds of the images on the two eyes as they fly through a tunnel in which one wall carries a stationary grating, and the other a moving one. If the hypothesis is true, then for any bee velocity KO and grating velocity V\ (=—38 cm/s in this particular case), it should be possible to predict the position of the trajectory along the width of the tunnel, as explained in the text and specified in the upper panel. The lower panel compares the theoretically predicted positions (continuous curve) with those experimentally observed (dots). Each wall carries a vertically oriented square-wave grating of period 5 cm.
of the gratings on the two sides differ by a factor of as much as four [Fig. 4, see left-hand segments of panels (d) and (h)]. However, when one of the gratings is in motion (Fig. 4, see cen-ter and right-hand segments of each panel), the bees' flight tra-jectories are clearly displaced from the tunnel axis (P < 0.0025 in all cases). The direction of displacement then depends con-sistently upon whether the grating moves with or against the di-rection of the bees' flight. The measurements with the moving gratings constitute an important control, because they demon-strate (1) that the bees are indeed attending to the apparent mo-tion of the gratings on the two sides as they fly along the tunnel; and (2) when the gratings on the two sides are stationary, the resulting centering response is not simply a consequence of
sat-uration of the responses of the movement-sensitive mechanisms in the two eyes.
In summary, the results of the above experiments suggest that contrast frequency is not an important parameter in the measurement of the apparent motion of the patterns. It is there-fore very likely that apparent angular speed is, by default, the relevant parameter.
Dependence of the centering response on apparent angular speed
It is possible to test more directly whether the bees are indeed measuring angular speed, as follows. If the flying bees are
try-1.0
0.0
-100 J 0 100
VO = V1 = -26 cm/sec
Bee velocity, VO (cm/sec)
Fig. 6. Experiment similar to that shown in Fig. 5, but with gratings of different periods on the two walls. In this case, the 5-cm grating is stationary while a 10-cm grating moves at a constant velocity of 26 cm/s. Symbols are as in Fig. 5.
Apparent angular speeds
Apparent angular speeds
700"
600-
500-<
400-oo
u
| 200 i
6
100"
0
• Front-to-back motion O Back-to-front motionOo
0 100 200 300 400 500 600 700 800Grating 1 (deg/sec)
1000' 800" u oo1
a
600-400" 200-• Front-to-back motion O Back-to-front motion • • 200 400 600Grating 1 (deg/sec)
b 800 1000Fig. 7. Comparison of apparent angular velocities experienced by the two eyes: Panel a shows a comparison of the apparent angular speeds experienced by the bees' eyes for each of the flights analyzed in Fig. 5. The filled circles represent flights in a direction opposite to that in which the grating moves, while the open circles represent flights in the same direction, but at a lower speed, so that one grating appears to move in the back-to-front direction on the eye. Panel b shows a similar comparison for the flights analyzed in Fig. 6.
ing to balance the apparent angular speeds of the patterns as seen by the two eyes, then when one of the patterns is in mo-tion and we know its linear speed as well as that of the bee, we should be able to predict where, along the width of the tunnel, the bee's trajectory should be located so that the apparent an-gular velocities of the two patterns are equal. With reference to Fig. 5, we see that, for a bee flying at a speed V0, and a
pat-tern moving in the same direction with a linear speed VI, equal-ity of apparent angular speeds requires that
V0/d2 = (VI - VQ)/d\, when V0 < V\
V0/d2= (V0- V\)d\, whenK0>Kl
526 M. V. Srinivasan et al.
and that V0/d2 = (KO + V\)/d\ when the bee flies in a direc-tion opposite to that in which the pattern moves.
The above expressions can be rewritten to evaluate the quan-tity d\/(d\ + d2), which is the theoretically expected distance of the trajectory from the wall carrying the moving pattern, ex-pressed as a fraction of the width of the tunnel. Denoting this quantity by D, we obtain
D= (Kl - KO)/K1, when K 0 < Kl
= ( K O - K l ) / ( 2 K 0 - K l ) , w h e n K 0 > K l
and
D= (V0 + K l ) / ( 2 K 0 + K l ) ,
when KO is oppositely directed to K l .
The results of an experiment designed to test these predic-tions are shown in Fig. 5. Here each wall carries a square-wave grating of period 5 cm. The grating on one wall is stationary, whilst that on the other wall (the lower wall in the figure) moves at a constant velocity V\ = —38 cm/s. (The negative sign de-notes motion towards the entrance.) The continuous curve shows the theoretically expected relationship between bee speed (KO, abscissa) and bee distance (D, ordinate), for bees flying with or against the direction of motion of the moving grating. The dots depict the experimentally measured relationship be-tween the same two variables. Each dot represents one trajec-tory, where KO was measured as the average velocity of the bee (in cm/s), and D was measured as the mean distance of the tra-jectory from the moving pattern, expressed as a fraction of the tunnel width. It is evident that the measurements fit the theory quite well, especially in the case of bees flying in the direction opposite to that of grating motion (KO > 0).
The point D = 0 on the theoretical curve corresponds to a situation in which the bee and the pattern are moving in the same direction at the same speed. In this situation, the moving grating does not move relative to the bee's eye. To the bee, therefore, this grating would be indistinguishable from a grat-ing that is stationary and infinitely far away. One would thus expect that bees flying at the same speed and in the same direc-tion as the moving grating would fly very close to it; the results (Fig. 5) show that this is indeed the case.
Consider now a bee flying at different speeds along the axis of the tunnel, while one of the gratings is in motion. As the speed of the bee decreases toward zero, the eye viewing the sta-tionary grating would experience a progressively lower angular speed, and this would be a progressively smaller fraction of the angular speed experienced by the other eye. This is true irrespec-tive of whether the bee flies with or against the moving grating. Therefore, with decreasing flight speed (| K0| -+ 0), we would expect the position of the trajectory to shift progressively closer to the stationary grating (D-> 1.0). The data (Fig. 5) show that this is indeed what occurs. On the other hand, as the speed of a bee flying along the tunnel axis increases (| K0| -+ infinity), the ratio of angular speeds seen by the two eyes would approach unity, irrespective of the bee's direction of flight. Therefore, with increasing flight speed we would expect the position of the
trajectory to approach the axis of the tunnel asymptotically (£>-<• 0.5). The data show that this is indeed what occurs in the case of bees flying opposite to the direction of motion of the grating. Corresponding data for bees flying in the same direc-tion as the grating are not available, as very few bees are found to fly at the requisite speeds.
The results of an experiment similar to that described above (see Fig. 5), but using gratings of different spatial frequencies on the two walls, are shown in Fig. 6. Here one wall carried a stationary grating of period 5 cm, while the other carried a grat-ing of period 10 cm movgrat-ing at a speed of 26 cm/s. Again, it is evident that the data agrees reasonably well with the theoreti-cally expected relationship between D and K0, calculated on the assumption that the flying bee balances the apparent angular speeds of the gratings on the two eyes, irrespective of their spa-tial structure.
A comparison of the apparent angular speeds seen by the two eyes, for each of the sets of flights analyzed in Figs. 5 and 6, is shown in Fig. 7a and 7b, respectively. For flights in which both gratings appear to move in the front-to-back direction over the eyes (filled circles, Fig. 7a and 7b), the apparent angular speeds range from ca. 200 deg/s to ca. 800 deg/s, depending upon the bee's flight speed and position along the width of the tunnel. It is evident that, in these flights, the bees tend to bal-ance the apparent angular speeds on the two eyes, rarely allow-ing them to differ by more than 50%.
Until now we have only considered situations in which each grating appears to move in the front-to-back direction over the corresponding eye. Let us now consider the case in which one grating appears to move in the front-to-back direction, whilst the other appears to move in the back-to-front direction. This situation —which would rarely be encountered during transla-tory flight in the real world —occurs when a bee flies in the same direction as the moving grating, but at a lower speed. In Figs. 5 and 6, this corresponds to the domain of bee velocities for which K1 < K0 < 0 (see the center panel above the graph in Fig. 5). Not many data points are available in this domain of bee velocities, because bees moving in the same direction as the grating tend to "catch up" with it, as indicated by the cluster-ing of data points near K0 = Kl in Figs. 5 and 6 (see arrow on the abscissa). Nevertheless, there are several data points, per-taining to this condition, that are in good agreement with the theoretical prediction (continuous curve) based on the assump-tion of equal apparent angular speeds on the two eyes. The ap-parent angular speeds experienced by the two eyes under these conditions are depicted by the open circles in Fig. 7a and 7b. Some but not all of the points fall close to the 45-deg line, con-firming that there is a tendency to balance apparent angular speeds even under these unnatural conditions. The departure of some of the data points from the 45-deg line (see Fig. 7) may well be due to geometrical constraints imposed by the tunnel. For example, considering the data of Figs. 5 and 7a, a bee fly-ing in the same direction as the movfly-ing gratfly-ing and at the same speed (38 cm/s) would experience zero angular speed on the eye viewing that grating, but it cannot experience an angular speed of less than 180 deg/s on the eye viewing the other (stationary) grating, owing to the finite width of the tunnel (12 cm).
In summary, the above findings indicate that bees flying through the tunnel tend to balance apparent image speeds even when the motions are oppositely directed on the two eyes. In other words, it is possible that the underlying motion-detecting
mechanism is insensitive to the direction of movement (see also Discussion).
What region of the eye is involved in measuring apparent angular speed?
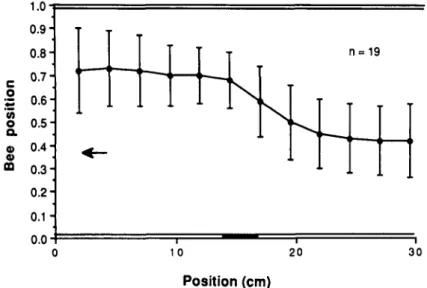
In calculating the theoretical curves for Figs. 5 and 6, we have assumed that the bee compares the apparent angular speeds in the lateral regions of the two eyes, i.e. along directions at right angles to the tunnel axis, where the velocity is a maximum. Is this really the case, or do the bees compare average velocities measured over a substantial fraction of the visual field of each eye? To investigate this question, we analyzed flight trajectories of bees when one wall was uniformly white, while the other wall carried a single, dark vertical stripe placed halfway along its length (Methods). The results show that the bees deflect sharply away from the stripe, but only when it approaches the lateral direction of view of the eye (Fig. 8). Many flights, not included in the analysis shown, actually involve more extreme deflec-tions, ending in crashes against the blank wall and termination of flight. It is clear that the response induced by the stripe is not one of fixation, but, rather, avoidance. The shape of the tra-jectories suggest that angular speed is monitored chiefly by the lateral fields of view of the eyes, along directions approximately at right angles to that of flight. This concurs with Lehrer's (1990) recent observation that the lateral eye regions are the ones most sensitive to drift of the retinal image. An alternative interpretation of these trajectories would be that the centering response is associated with a fairly high threshold of apparent angular speed, which is exceeded only in the lateral fields of view. This possibility, however, is unlikely since the response is driven by apparent angular speeds that span a factor of ten (Fig. 7), and is detectable even in walking bees, where these speeds can be as low as 40 deg/s (data not shown).
Operating range of the centering response in terms of flight speeds, contrast frequencies, and apparent angular speeds
Histograms of the bees' flight speeds through the tunnel under various stimulus conditions are given in Figs. 9 and 10. When both gratings are stationary, flight speeds range from 10-70 cm/s (Fig. 9). Depending on the spatial periods of the gratings on the walls, these speeds produce contrast frequencies ranging from 1-28 Hz, and the contrast frequencies experienced by the two eyes in a given flight can differ by a factor as high as four. Assuming that the bees fly close to the tunnel axis (on average, as shown by the data in Fig. 4), the resulting apparent angular speeds experienced by the lateral eye regions range from ca. 90-650 deg/s (Fig. 9).
Flight speeds are distributed somewhat differently when one of the gratings is in motion, as shown in Fig. 10. Here one wall carries a stationary grating of period 10 cm, while the other car-ries a grating of period 2.5 cm moving at 27.5 cm/s. We already know that this stimulus elicits a clear centering response: these data were obtained from the same group of flights that was an-alyzed to obtain the results shown in Fig. 4 [panels (d) and (h)]. Bees flying in a direction opposite to that of the moving grat-ing exhibit speeds ranggrat-ing from 10-60 cm/s, experiencgrat-ing con-trast frequencies of 1-6 Hz from the stationary grating and 15-35 Hz from the moving grating (Fig. 10, left panel). Assum-ing that their flight trajectories are displaced from the tunnel axis such that the average value of the ratio [d\/(d\ + d2)] is 0.71 (as indicated by the data in panels (d) and (h) of Fig. 4), these bees would experience apparent angular speeds of ca. 160 deg/s to ca. 960 deg/s from the stationary grating and ca. 250 deg/s to ca. 575 deg/s from the moving grating (Fig. 10, left panel). It is clear that the bees are able to balance approximately the apparent angular speeds on the two eyes even under condi-tions in which the contrast frequencies experienced by the two eyes differ by a factor of as much as ten. Bees flying in the same
1.0 o '35 o a. o> o GO 0.9" 0.8" 0.7 0.6-0.5 0.4- 0.3-0.2 0.1 0.0 ' '• 1 ,
N
N
1 = 19 10 20 30 Position (cm)Fig. 8. Experiment designed to explore the region of the visual field that is involved in monitoring apparent angular speed. The figure shows the trajectory (depicted as the mean and standard deviation of 19 flights) when one wall is white and featureless, while the other carries a single, vertical dark stripe halfway along the tunnel, as shown. There is a sharp kink in the trajectory as the stripe passes the lateral field of view of the eye, suggesting that angular speed is monitored in a direction approximately at right angles to that of flight.
o g> "o CD C M ' E Be e speed s (cm/sec ) Contras t frequencie s (Hz ) Apparen t angula r speed s (deg/sec ) n=10 0
II
i
o ' o • o T C M C O O in o to o o CO o CM O COI
n = 10 0i
o ' o • - C M o o ' o C O ^ W o o O o CO o CM O _ o CO o o . - C M n=10 0I
o o C O T T Gratin g 1 stationary ) Gratin g 2 (stationary ) Gratin g 1 an d Gratin g 2 iod: C D 0 . •b o CD 0. O O E u iq c\i o ,_ o rr o CO O) o o »~ CM *~ CO TT 1^ CO *- CO en o CM CO CM MC CO O CO CM oo o CO ^. CO CO CM CO 1^ CO o co CM o "" • in •" • o C M 16- CO •<» • co CO o in CO in CM 20-o CO in i^ CD o CO CO CO CM 24-co in CO o CO in o co CM CO 28-i^ CO in CO riod: C D 0 . od: Peri o in C3 in cvi o CM O o CJ) o CM CO cn o CM CO CM OC o 00 CM 1^ oo o CO CO CO CO CM co o CO C M o o CO o CM 16-C D C O CO o in CM o CM 20-o CD in r-~ CO o CO •1 4 C M C O C M C M CO in CO o C O tn o CD CM CO 28-•«» • C O m C O •b p .9 o CD O Q.T -E E o o CM O CO O) O o *~ CM *- CM ^1 00 *- CO cn o CM CO CM CO •> » o CO CM 1^ CO o CO CO CO CO CO CO o CO CM o •* in o CO CO CO l-» CO o in CO in CM 10-o <10-o in CO o CO CO •» • C M CO m CO o C O m o CO "" CO 14-t ^i^ i^ CO m CO Fig . 9 . Rang e o f contras t frequencie s an d apparen t angula r velocities : Histogram s o f fligh t speed s o f bee s flyin g throug h th e tunne l whe n th e tw o wall s carr y stationar y square-wav e grating s o f differen t periods , a s indicated . Th e tabl e belo w eac h histogra m give s th e contras t frequencie s a s wel l a s th e apparen t angula r speed s experience d b y th e tw o eyes . Comment s i n text , n = numbe r o f flight s analyze d fo r eac h histogram .I
C D Z3 i t Be e speed s (cm/sec ) Contras t frequencie s (Hz ) *~ Flight s i n opposit e directio n t o movin g gratin g
I
A n = 1 8 •V '/V
V
/ V
/ X V
/
V
/
/ / / V / / V
/
V
/
/ / V
V
O
l/ v1
Flight s i n sam e directio n a s movin g gratin gi
n=3 55-
3
a-
a
'
3 o
5'
a S' a-i
o -1t
Gratin g 1 Period=1 0 c m (Stationary ) Gratin g 2 Period=2. 5 c m o I » - o o -15 (speed=27. 5 cm/sec)' " Gratin g 1 Gratin g 2 o CO CM CO o CM O -- CM 5-19 " -,_ CO CO ^~ CM CO CO CM O CO O CM CO CM 3-23 C O C M CO l^_ ^ « C O C M »— CO o o CO CO 3-27 C M CO CO C O 00 •«» • C O CO o in o in 7-31 C M in CO CO CO en o in CO o CD O in to m -35 CO to in o CO in in o m o r> o CO to -39 C O C O C M *— to to CD ,_ CO m r^ in 1 o C O o CO cr CO t^ 00 CO CM * o CO Gratin g 1 Period-1 0 c m (stationary ) Gratin g 2 Period=2. 5 c m (speed=27. 5 cm/sec ) Gratin g 1 Gratin g 2 o »- o t o ^~ CO in in o o CM o »- CM CO 1^ CO o CO o> o in m CM o 1 C O o CM CO C M ,_ CO C O oCM CO O> O o CO •«» • C O in T _ in C M C O o CM CM CO CO CO o in o in en CO CO in .r- CM CO CM CO CM 00 1 o C O o in CO in CO o> CM CO CO CO CO CM CO o o CO CO CO o CO CM c» CO •* 1 o 0 0 o f*" 00 OJ in o 00 CO CO a> CO Apparen t angula r speed s (deg/sec ) Fig . 10 . Sam e a s i n Fig . 9 , bu t i n a differen t stimulu s situation . On e wal l carrie s a stationar y square-wav e gratin g o f perio d 1 0 cm , whil e th e othe r carrie s a gratin g o f perio d 2. 5 c m movin g a t 27. 5 cm/s , a s shown . Th e tw o histogram s pertai n t o flight s agains t an d wit h th e movin g grating , respectively , n = numbe r o f flight s analyze d fo r eac h histogram .530
M. V. Srinivasan et al.
direction as the moving grating exhibit speeds ranging from
20-50 cm/s, experiencing contrast frequencies of 2-5 Hz from the
stationary grating and 0-9 Hz from the moving grating (Fig. 10,
right panel). Assuming that their flight trajectories are displaced
from the tunnel axis such that the average value of the ratio
[dl/(d\ + d2)] is 0.68 (as indicated by the data in panels (d)
and (h) of Fig. 4), these bees would experience apparent
angu-lar speeds ranging from 135-340 deg/s in the front-to-back
di-rection from the stationary grating, and apparent angular
speeds ranging from ca. 105 deg/s in the back-to-front
direc-tion to 325 deg/s in the front-to-back direcdirec-tion from the
mov-ing gratmov-ing (Fig. 10, right panel). It is evident that the movmov-ing
grating influences the speed with which bees fly through the
tunnel, causing them to fly slower when going in the opposite
direction, and to avoid low speeds when flying in the same
di-rection. At moderate grating speeds, bees going in the same
direction as the moving grating seldom fly slower than the
grat-ing (Fig. 10, right panel), presumably to avoid the rather
unnat-ural condition of apparent back-to-front motion on the eye
during straight-ahead flight.
Dependence of the centering response
on the intensity profile of the pattern
All of the patterns used in the experiments described so far
con-sisted of black and white stripes. These patterns are
character-ized by regions of uniform intensity, "black" or "white,"
separated by boundaries where the intensity changes abruptly
from one level to the other. Since it is the boundaries and not
the regions of uniform intensity that provide information on
movement, it is of interest to ask whether the two types of
boundary, light-to-dark and dark-to-light, are used equally
ef-fectively by the bee's visual system to measure apparent
angu-lar speed. To examine this question, we used gratings whose
spatial intensity profile was an asymmetrical sawtooth, as
illus-trated in Fig. lla. With identical, stationary sawtooth gratings
on the two walls, we find that bees always fly close to the axis
of the tunnel, regardless of whether the gratings are oriented
such that they offer sharp dark-to-light boundaries to both eyes
of the flying bee (left panel, Fig. lla), or sharp light-to-dark
boundaries on one eye and sharp dark-to-light boundaries on
the other (center and right panels, Fig. lla). This finding
indi-cates that sharp boundaries of a single polarity (either one) are
sufficient to provide velocity information. However, it does not
reveal whether bees are also capable of extracting this
informa-tion from areas of the pattern where the intensity varies
grad-ually, as in the ramp regions of the sawtooth profiles.
To investigate the latter question, we analyzed the
trajecto-ries of bees flying along the tunnel when both walls were lined
with sinusoidal gratings (Fig. 1 lb). Again, we find that bees fly
close to the axis of the tunnel, even when the spatial periods of
the gratings on the two walls are unequal. It is only when the
period of one of the gratings is reduced to 1.5 cm
(correspond-ing to an angular period of 14 deg for a bee fly(correspond-ing along the
axis) that there is a slight but statistically significant tendency
for the bees to fly closer to that grating (P < 0.0005). In each
of the cases shown in Fig. 11, motion of a grating causes the
bees' flight trajectories to be displaced either toward or away
from that grating, depending upon the direction of its motion
in relation to that of the bee, as in the other experiments (data
not shown). This set of results indicates that the bee's visual
sys-tem can compute the apparent angular speed of a pattern
accu-rately even when there are no sharp boundaries, and irrespective
of the slopes of the intensity gradients in the pattern (see also
Discussion).
Dependence of the centering response
on the contrast of the pattern
The dependence of motion perception on pattern contrast was
investigated by analyzing the trajectories of bees flying through
the tunnel while one wall carried a stationary sinusoidal
grat-ing of a fixed, relatively high contrast, whilst the other carried
a stationary sinusoidal grating of the same period, but whose
contrast was varied from one experiment to the other. The
re-sults of experiments using two different combinations of
con-trasts are shown in Fig. lie. The bees tend to fly close to the
axis of the tunnel even when the contrasts of the gratings on the
two walls are as disparate as 0.60 and 0.15 (Fig. 1 lc). It is only
when the contrast of the pattern on one of the walls is very low
(<0.05) that the bees' trajectories begin to depart significantly
from the axis of the tunnel. In fact, in conducting experiments
in which one wall carries a high-contrast pattern and the other
a zero-contrast pattern (i.e. a uniformly gray sheet), we find
that considerable care has to be taken in producing and
select-ing the zero-contrast pattern because even small flaws,
originat-ing from spurious residual contrasts, are evidently sufficient to
cause the flight trajectories to be located close to the tunnel axis.
These findings indicate that the bee's perception of apparent
an-gular speed is accurate even at very low contrast, and that the
visual system is able to extract the apparent angular speed of a
pattern largely independently of its contrast.
Discussion
This study, investigating the tendency of freely flying honeybees
to fly along the axis of a tunnel, has demonstrated that flying
honeybees balance the distances to the two walls by equalizing
the apparent angular speeds on the two eyes. Whether image
speed is translated into a true percept of range is a question that
is not answered by the present investigation. There is, however,
much circumstantial evidence to suggest that image speed is
per-ceptually linked to object range in bees and other insects.
Fly-ing bees do not go near rapidly movFly-ing objects (see Srinivasan
& Lehrer, 1984a, and also below), suggesting that rapid image
movement is interpreted as being caused by an object that is
dangerously close. It has been shown that freely flying bees can
be trained to distinguish between objects at different ranges,
and that this discrimination is most likely mediated by
monitor-ing image speed (Lehrer et al., 1988; Srinivasan et al., 1989).
Locusts peer before they jump on to a nearby object, and are
able to use the apparent motion of the object's image to
esti-mate the object's range and adjust the size of their jump
accord-ingly (Wallace, 1959; Sobel, 1990, 1991).
The centering response vs. the optomotor response
Several lines of evidence suggest that the centering response is
mediated by motion-detecting mechanisms that are distinct
from those that mediate the optomotor response in insects
(re-views by Reichardt, 1987; Borst & Egelhaaf, 1989):
N \ AA NK
CO en5
o oI
CO n o 23 n - 30 n - 30N \ KK AA
Period = 3 cm Period = 6 cm Period= 1.5cm Period = 6 cm
2 d
°> n
"to t5 !2 « o •!= (0 £= 3 O E O CO.4..
n = 61i
n = 504.
n - 50 n = 49 Period = 6 cm Period = 3 cm Period >b
6 cm Period=1.5cm
Contrast=0.60 Contrast=0.15 Contrast=0.60
Period = 6 cm Period = 6 cm Period - 3 cm Contrast = 0
CO _c (0 O) o (0 c
co
-I-n = 26 n = 24 Period = 6 cm Period = 6 cm Contrast=0.15 Contrast=0.60 c n o 26 Contrast = 0 n = 24 Period - 3 cm Contrast=0.60
Fig. 11. Positions of trajectories (mean and standard deviation) of bees flying through the tunnel when the two walls present stationary patterns carrying a variety of intensity profiles and contrasts, (a) Sawtooth-profile gratings, with the abrupt inten-sity edges facing the same or opposite directions on the two walls, (b) Sinusoidal gratings of different periods on the two walls, (c) Sinusoidal gratings of equal periods, but different contrasts on the two walls, n = number of flights, in the direction of the arrow, analyzed in each case.
1. The response is not one of yaw (i.e. rotation about a verti-cal axis); rather, it is one in which the flying insect shifts its position in the tunnel laterally. This is seen most clearly in the trajctories shown in Figs. 2d, 2e, and 8, where one of the walls carries no pattern. If these trajectories were governed by a classical yaw-controlling optomotor response, we would expect them to curve toward the wall carrying the pattern; what we find, instead, is that the trajectories are consistently
displaced away from that wall, von Buddenbrock & Moller-Racke (1952) investigated the behavior of flies walking to-ward a light source along a tunnel lined with gratings on the side walls. When one wall carried a vertical grating and the other wall was blank, the flies turned toward the patterned wall, exhibiting a distinctly optomotor-like behavior. This is in contradiction to our findings with flying honeybees. In-terestingly, however, we have observed that naive bees, just
532 M. V. Srinivasan el al.
learning to enter the tunnel and find the reward, occasion-ally show a tendency to turn towards the wall carrying the pattern. It is possible that these bees are exhibiting an opto-motor response, just like the flies, which is suppressed, as training proceeds, to reveal another visuomotor mechanism. 2. In many insects, including bees and flies, it is well-estab-lished that the optomotor response elicited by a moving grat-ing depends primarily on the contrast frequency induced by the grating, and not on its apparent angular speed (reviews by Reichardt, 1987; Borst & Egelhaaf, 1989). A contrast-fre-quency-dependent response has also been observed in studies of motion detection and ocular tracking in man (e.g. Kelly, 1979; Burr & Ross, 1982; Gellman et al., 1990). Behavioral measurements of the optomotor response of the bee (Kunze, 1961) and measurements of the response of large-field mo-tion-sensitive descending neurons in the bee (Ibbotson & Goodman, 1990) reveal a bell-shaped response curve with a peak at a relatively low contrast frequency of 10 Hz, and a half-width of approximately 10 Hz. If the centering response were driven by the same motion-sensitive mechanisms as the optomotor response, then the data of Kunze (1961) and of Ibbotson and Goodman (1990) would predict that, in the tunnel, stationary gratings inducing contrast frequencies of, say, 2 Hz on one eye and 8 Hz on the other would produce substantially different motion signals in the two eyes, im-pairing the operation of the centering response. Contrary to this expectation, we see that the centering response operates perfectly under these conditions (see Fig. 9, left panel) as well as with a variety of other combinations of contrast fre-quencies, demonstrating that the visual mechanisms medi-ating this response do not confound angular speed with contrast frequency. Our data indicate that the centering re-sponse is driven by the apparent angular speed of the mov-ing pattern, and is largely independent of the spatial structure of the pattern or the contrast frequencies that it in-duces, provided that the pattern carries a few vertically ori-ented features that can be used to measure angular speed in the horizontal plane. The visual mechanisms mediating the centering response must be capable of encoding unambigu-ously angular speeds ranging from 100-800 deg/s, even if the contrast frequencies on the two sides differ by a factor of 10 (see Figs. 9 and 10). This is true for a domain of contrast fre-quencies ranging from a fraction of a cycle per second to at least 30 Hz (see Figs. 9 and 10). David (1982) has encoun-tered mechanisms of movement perception that are qualita-tively similar. He finds that fruitflies flying in a wind tunnel regulate their ground speed according to the apparent angu-lar speed of the environment, which they are able to measure accurately irrespective of its spatial-frequency content. Land and Collett (1974) inferred the presence of neural mecha-nisms sensitive to angular velocity in their study of chasing behavior in flies.
3. Further evidence that contrast frequency does not play an important role in the centering response comes from the fol-lowing consideration. We have already seen that motion of the pattern on one of the walls causes the bees' trajectories to shift away from the axis of the tunnel (Figs. 2, 4, 5, and 6). This shift alters the apparent angular speeds on the two eyes, but not the contrast frequencies: the latter depend only upon the speeds of the bee and the pattern, and are
indepen-dent of the bee's position along the width of the tunnel. It therefore follows that the centering response cannot be me-diated by monitoring the contrast frequencies on the two eyes, because these do not change when the bee shifts its lat-eral position.
4. There is some evidence (as already described under Results) to suggest that the centering response is mediated by move-ment-responsive mechanisms that are insensitive to the direc-tion of apparent modirec-tion as seen by the eye. That is, apparent motion in the front-to-back direction is not distinguished from apparent motion in the back-to-front direction at the same angular speed. This is different from the optomotor re-sponse, which is clearly direction-sensitive, and which needs to be so if it is to fulfill its role of visual stabilization. This difference is, in itself, not compelling evidence against the participation of optomotor-like mechanisms in the centering response because a direction-insensitive response can readily be generated by summing the outputs of a pair of direction-ally sensitive movement detectors with opposite preferred di-rections. However, it is interesting in the light of recent findings with respect to range computation in the peering lo-cust, which suggest the participation of direction-insensitive motion-detecting mechanisms (Sobel, 1990a, 1990b). It may well be that direction-insensitive mechanisms of movement detection offer a simple, as yet undiscovered, means of mea-suring apparent angular speed independently of image struc-ture, which direction-sensitive mechanisms do not. We believe that the centering response reflects an innate be-havior that many locomoting insects use to maneuver through narrow gaps. To execute such maneuvers successfully, it would seem desirable to use a motion-perception system that is sensi-tive to angular speed, rather than contrast frequency or spatial structure: such a system would enable an insect to fly through the middle of a gap between two branches, for example, even if the textures of the bark on the two branches are substantially different.
Relationship of the centering response to the movement avoidance response
It is known that bees, trained to collect a reward at a grating, find it difficult to approach the grating when it is in motion (Srinivasan & Lehrer, 1984a). It has also been shown previ-ously that bees avoid movement, but not flicker (Srinivasan & Lehrer, 19846, 1985). Thus, the neural mechanisms underlying this "movement avoidance response" (MAR) must respond to true movement, and not to mere modulations of intensity in time. The MAR operates over a wide domain of contrast fre-quencies ranging from a few Hertz to 200 Hz (Srinivasan & Lehrer, 1984a). It is conceivable that the centering response of bees flying through the tunnel in the present experiments is a consequence of balanced, oppositely directed MARs elic-ited by gratings on the two sides. At high contrast frequen-cies (60-200 Hz), the MAR is dependent on contrast frequency rather than angular speed. At lower contrast frequencies (0-20 Hz), however, the MAR appears to depend on angular speed rather than contrast frequency (see Fig. 5, Srinivasan & Lehrer, 1984c), a property that meshes well with that of the centering response.
Neural mechanisms for the measurement of angular speed
We are yet to discover the neurons and processing mechanisms that are involved in the measurement of the apparent angular speed of the image. The so-called "optomotor" neurons are the most widely studied movement-sensitive neurons in the insect optic lobe (review by Hausen & Egelhaaf, 1989). The response of these neurons to the transient movement of spots or bars is approximately proportional to angular speed, and roughly in-dependent of the size or shape of the object (Collett & King, 1975; Olberg, 1981; but see Horridge & Marcelja, 1990). How-ever, the steady-state response to a moving, periodic grating de-pends strongly upon the spatial structure of the grating (e.g. spatial frequency and contrast) and the temporal frequency that it induces, rather than upon its angular velocity (Eckert, 1980; review by Borst & Egelhaaf, 1989; Horridge & Marcelja, 1990). What is needed are neurons, with input field sizes of around 10
deg, that measure local image speed independently of the struc-ture or contrast of the image, over an angular-speed range of 100-800 deg/s, and a contrast-frequency range of 1-30 Hz. As far as we know, to this date there are no published reports of neurons satisfying all of these requirements.
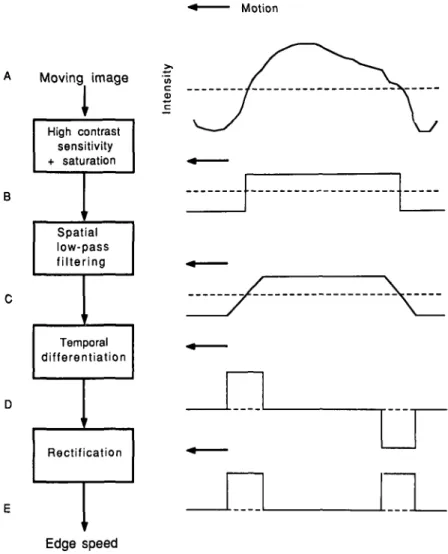
A simple neural scheme for the measurement of local image speed is suggested in Fig. 12. The moving image (level A) is first converted to a binary image composed of two levels ("black" and "white"), by an array of neurons that possess high sensitiv-ity to contrast and saturate at low contrasts. The binary neural image (level B), which moves at the same velocity as the origi-nal image, is then spatially low-pass-filtered by a subsequent ar-ray of neurons, resulting in a moving neural image (level C) in which the abrupt edges of the binary image have been converted to ramps of constant slope. The speed of the image can then be monitored by measuring the rate of change of response at the ramps. Accordingly, the neural image at this level is temporally differentiated by an array of phasically responding neurons,
Motion Moving image
I
High contrast sensitivity + saturation Spatial low-pass filtering p Temporal differentiation Rectification Inte n Edge speedFig. 12. A simple neural scheme proposed for measurement of the angular speed of an image, independently of its structure or contrast. The moving image (level A), whose spatial intensity profile at a given instant is as shown top right, is converted to a moving binary neural image (level B). The binary image is then spatially low-pass-filtered to yield a moving neural image in which the abrupt edges have been converted to ramps of constant spatial slope (level C). This neural image is then differen-tiated in time by an array of phasically responding neurons to yield a neural image composed of pulses (level D). The ampli-tudes of these pulses encode the local angular speed of the image. A subsequent stage of rectification ensures that angular speed is encoded independently of edge polarity or direction of motion.