HAL Id: halshs-00795316
https://halshs.archives-ouvertes.fr/halshs-00795316
Submitted on 27 Feb 2013
HAL is a multi-disciplinary open access
archive for the deposit and dissemination of sci-entific research documents, whether they are pub-lished or not. The documents may come from teaching and research institutions in France or abroad, or from public or private research centers.
L’archive ouverte pluridisciplinaire HAL, est destinée au dépôt et à la diffusion de documents scientifiques de niveau recherche, publiés ou non, émanant des établissements d’enseignement et de recherche français ou étrangers, des laboratoires publics ou privés.
Export performance and product market regulation
Bruno Amable, Ivan Ledezma
To cite this version:
Bruno Amable, Ivan Ledezma. Export performance and product market regulation. 2013. �halshs-00795316�
Documents de Travail du
Centre d’Economie de la Sorbonne
Export performance and product market regulation Bruno AMABLE, Ivan LEDEZMA
Export performance
and product market regulation
*Bruno Amable† and Ivan Ledezma‡
February, 2013 Abstract
This paper analyses the impact of product market regulation on the propensity to export at the industry level for 13 OECD countries and 13 industries over the 1977-2007 period. Recent economic policy and academic literature insists on the negative effects of product market regulation on productivity or innovation, and hence on “competitiveness", a term that we interpret as the ability to export. Similar to the conclusions of some contributions to a recent literature on competition and growth, the “common sense” is that product market regulation should be detrimental to competitiveness. Testing through a two-step estimation the impact of upstream pressures of product market regulation on productivity and the effect of the latter on the propensity to export, this paper shows that upstream regulatory pressures have a significantly positive impact on productivity and thereby on the capability of an industry to attract resources and to sell its production in international markets.
Keywords: exports, product market regulation, competitiveness
Performance à l’exportation et réglementation sur les marchés
de biens et services
Résumé
Cet article analyse l’impact de la réglementation sur les marchés de biens et services sur la propension à exporter au niveau sectoriel pour 13 pays de l’OCDE, 13 secteurs sur la période 1977-2007. La littérature académique récente comme celle portant sur la politique économique insiste sur les effets négatifs de la réglementation sur la productivité ou l’innovation et par conséquent sur la « compétitivité », que nous définissons ici comme la propension à exporter. Suivant les conclusions d’une certaine littérature sur la croissance et la concurrence, le « sens commun » est que la réglementation sur les marchés de biens et services nuit à la compétitivité. En testant en deux étapes les conséquences de la réglementation en amont sur la productivité et les effets de celle-ci sur la propension à exporter, ce papier montre que la réglementation a un effet significativement positif sur la productivité et par là-même sur la capacité d’un secteur à attirer des ressources et vendre sa production sur les marchés internationaux.
Mots-clés : exportations, réglementation sur les marchés de biens et services, compétitivité JEL: F14
*
The research leading to these results has received funding from the European Community’s Seventh Framework Programme (FP7/2007-2011) under grant agreement n°225349 (ICaTSEM project). †
Université Paris 1 Panthéon- Sorbonne, CEPREMAP & IUF. [email protected]
‡
1. Introduction
The issue of competitiveness has gone back to the forefront of policy debates on the importance of industry for Europe since the Great Depression (European Commission, 2010). A competitive manufacturing industry is seen as indispensable for a sustainable growth and the achievement of full employment. Facing ‘intensified global challenges’ such as the competition of new industrialised countries or the pressure on resources, European countries would need to put competitiveness and sustainability at the centre-stage of industrial policy. In this respect, competition policy would have to play a major role because functioning competitive markets would contribute to improve the international market position of European industries. Competition would be a driver of innovation and efficiency gains and create strong incentives for firms to increase productivity. Therefore the implementation of a competition-promoting legal environment would be a central element of an economic policy for the promotion of competitiveness.
The positive influence that product market competition would play on innovation, productivity, or growth has been a central theme of the recent literature on growth (Aghion et al. 2005) and the conclusion that less product market regulation (PMR) would imply more innovation/productivity/growth has been promoted as a central policy recommendation by the OECD.2 Although the link between PMR and export performance has received little attention in empirical academic research, there is now a quite substantial literature on the influence of product market regulation on innovation and technical progress. The mainstream view whereby higher levels of PMR should hinder innovation, slow down productivity gains and hamper macroeconomic growth have actually dominated a rapidly growing policy-oriented empirical research that links measures of product market regulation to measures of productivity at the industry level (Nicoletti and Scarpetta, 2003; Conway et al., 2006; Arnold et al., 2008; Bourlès et al., 2012). Particular attention in this literature has been paid to the extent to which the (usually expected) negative effect of PMR is especially pronounced at the leading edge in technology, the so called "world technology frontier". This is motivated, in fact, by a rough translation of the results in Aghion et al. (2005) who suggest that the relationship between product market competition (PMC) and innovation is hump-shaped and that the peak of this curve is ‘larger and occurs at a higher degree of competition in more neck & neck industries’3, that is to say in industries where firms compete at the same technological level. Some sort of conflation between product-market liberalisation and low profitability (and so competition), and between the "world technology frontier" (WTF) and "neck & neck industries" has implicitly been assumed to give a rationale and to structure the above mentioned empirical literature.4
Elsewhere (Amable, Demmou and Ledezma, 2010, 2013; Amable, Ledezma and Robin, 2011; Ledezma, 2013) we have critically examined this line of argument, both theoretically and empirically. Knowledge standardisation consequences of PMR (Ledezma, 2013) and leader R&D pre-emption in an otherwise standard step-by-step model without
2
See the various issues of the yearly publication of the OECD: Economic Policy Reforms: Going for Growth 3
Aghion et al, 2005; Proposition 5 4
We use the term conflation in light of a recent wave of innovation models that focus on endogenous entry (See Etro, 2007 for a systematic treatment). This possibility generally leads to equilibrium market structures with a monopolist featuring persistently positive profits, so that low profitability and intense competition are by no means two faces of the same coin.
innovative leaders à l'Aghion et al. (2005) (Amable, Demmou and Ledezma, 2010) have been put forward to highlight, and more generally to recall, the ambiguities in the theoretical relationship between competition, regulation and innovation.5 We have also argued therein that our empirical results, pointing out a positive interaction between PMR and the proximity to the technology frontier in determining innovation and productivity, are by no means an isolated finding. Although the claims differ in interpretation, Nicoletti and Scarpetta (2003) and Conway et al. (2006) find parameters estimates of similar sign with other economy-wide and country level time-varying indicators of regulation.6
In this paper we go further on these issues and test whether countries where industries are more regulated suffer from a technological handicap on their ability to export and therefore perform a lower level of export activity. We use industry-level information for a sample of 13 OECD manufacturing industries in 13 countries from 1977 to 2007 and rely on a two-step estimation strategy that seeks to explain the export share of production of an industry in a given country by traditional determinants of comparative advantage such as international differences in factor endowments as well as international differences in productivity at the industry level. These latter are in turn explained by product market regulatory pressures. Hence, in our modelling framework, PMR affects export activity through its influence on technical progress.
The above mentioned debate of competitiveness cannot be treated in an underlying theoretical context of comparative advantage without some embarrassment.7 However no empirically implementable theory of competitiveness is available and we need to put some theoretical structure into the analysis. Hence, we interpret the word "competitiveness" in its fairly popular signification of "ability to export", which still has sense when the analysis is grounded on relative productivity measures, as we do. We rely on sophisticated estimations of multifactor productivity levels provided by the Groningen and Growth Development Centre, the construction of which is relative to the United States. We focus on the export share of production, which can be interpreted as both a measure of export specialisation as well as a measure of export performance in an international comparative analysis, once national scale effects are taken into account. This variable has also the highest coverage, with information starting in 1979.8
The particularities of the indicator used to capture PMR give further precisions on the scope of the analysis. We use the regulation impact indicator of the OECD. It measures the impact of regulatory pressures in key input sectors on the rest of the economy accordingly to their use, which leads to a panel data structure that explains its wide use in the PMR empirical literature. As such, its most popular interpretation is that of the knock-on effect of upstream
5 The traditional Schumpeterian insight whereby market power provides incentives to innovate actually appears in most theoretical models of the endogenous growth and patent-races literatures. For Aghion et al. (2005), product market competition encourages innovation in a step-by-step innovation process since in a neck-and-neck technological competition firms will try to escape competition by innovating. However, at the same time, laggards' innovation will be discouraged by competition as they anticipate lower post innovation profits. As we argue in the above-mentioned papers, the absence of innovative activity of leaders and more generally the lack of analysis of entry deterrence are important neglected elements.
6
In an error correction model, the authors claim a slowing-down effect of PMR in the natural catching-up process of laggard industries.
77
See Krugman (1993) for an assertive point on this. 8
A revealed comparative advantage indicator considering world markets is available in the STAN Indicators database, but only from 2000 on. Using it would imply losing information on key decades of the current wave of globalisation.
regulation on downstream industries.9 But it also presents high correlation with other more direct economy-wide product market regulation indicators so that the regulation impact indicator also remains a good proxy of business constraints (See Amable, Demmou and Ledezma, 2010).
Estimations obtained with these data do not support the postulate associating less-regulated industries with higher levels of export orientation. Rather the contrary appears: the pressures generated in manufacturing industries from upstream provisions appear to positively influence their productivity level, which in turn translates in higher export specialisation. Such a result recalls the ambiguities in the relationship between competition and technical progress and is consistent with our previously mentioned findings.
To the best of our knowledge this is the first attempt to make a link from PMR to technology driven comparative advantage at the industry level. Since at least Leontief (1953) or Balassa (1963), there is an important literature testing classical and neoclassical predictions about international trade specialisation. Recent empirical attempts (e.g. Harrigan, 1997; Redding, 2002; Nickell, Redding and Swaffield, 2008) have implemented a theoretically grounded empirical framework based on a GDP function derived from duality to incorporate both the technology and the endowment explanations of trade within the same estimation of GDP shares.10 This approach has also proved to be compatible for new trade theories (Helpman and Krugman 1985, Feenstra and Klee 2008). The link to market institutions, however, has received scarce attention. An exception is Nickell, Redding and Swaffield (2008) who, among other analysis, establish a relationship between deindustrialisation in the OECD and labour market institutions by relating estimates of specialisation adjustments with proxies of labour market protection. In our empirical framework we integrate the role of PMR directly in the identification strategy as an excluded variable. Moreover, GDP-shares duality-based estimates usually require industry-by-industry identification, which yields directly interpretable coefficients, namely on Rybzcinsky elasticities, but does not exploit the full sample variance for other explanatory variables. Here, in this paper we have preferred to follow Romalis (2004) for an empirical strategy that considers factor endowments scaled by their respective factor intensity. Hence, it is possible to run full sample regressions and expect a positive coefficient on the composed terms of factor inputs, as the national availability of a production factor should positively influence trade specialisation when it is intensely used in the production process.11
The other way around (the link from trade to technical progress) has also been largely tracked in empirical studies at several levels of aggregation. There is a large body of macroeconomic literature, recently surveyed by Harrison and Rodriguez-Clare (2010), analysing how trade openness affects economic growth at the country level. After the methodological criticism of Rodriguez and Rodrik (2001) that had tempered initial claims of sizeable positive effects of trade openness, recent panel data studies have provided new evidence on a positive correlation between trade volumes and economic growth, but generally after other reforms than trade liberalisation have taken place. In any case the usefulness of using trade volumes as proxies of trade liberalisation policies still lacks of general agreement, even if the problem is (partially) addressed through instrumenting strategies. At the firm level,
9
Indeed, recent debates on manufacturing competitiveness, in particular with respect to the France-Germany comparisons, have focused on the role of services (e.g. Gallois, 2012).
10
See Dixit and Norman (1980) for a formal presentation. 11
Nunn (2007) also follows a similar strategy to test prediction from the application of incomplete contracts to trade theory.
the empirical research is also abundant on country specific case studies testing the effects of trade on firm productivity.12 Recent works on this research line emphasise the heterogeneous responses stemming from heterogeneous firms, with a general consensus on positive effects at least for most performing firms.
Although substantial, these macro and micro empirical literatures on the relationship between trade openness and productivity have not provided a consistent discussion on the role of national product market provisions. Recent papers in the PMR literature rely on firm-level data to explore the link between trade, national regulatory reforms and productivity. Ben Yahmed and Dougherty (2012) do so using micro-level data for several OECD countries. They test whether import penetration improves firm productivity accordingly to different national regulatory environments. They find negative interactions between import penetration and PMR at the leading edge with economy-wide indicators of barriers to entrepreneurship and administrative burdens. The overall effect of PMR, however, cannot be identified as the specification considers only an interaction term for PMR, without including it alone in linear form, which reflects the authors' focus on the ability of national industries to face foreign competition. With our modelling framework, we allow for a larger role of PMR on the internationalisation of countries since it is considered at the root of technology driven comparative advantage, while still controlling from reverse channels.
The rest of the paper gives the details of what we have announced so far. Next section presents the data and methodology used; the following section discusses descriptive data statistics and explores reduced forms relationships. We then turn to the main estimations and briefly conclude in a final section.
2. Methodology
a. Empirical strategy
Following standards theories of comparative advantage, we are interested in testing the following system
ln(𝑀𝐹𝑃𝑖𝑐𝑡) = 𝛼0+ � 𝜃𝑗
𝑗∈𝐽 𝐼𝑗𝑡ln�𝐹𝑗� + 𝜌 ln(𝑃𝑀𝑅𝑖𝑐𝑡) + 𝜖𝑖 + 𝜖𝑐+ 𝜖𝑡+ 𝑢 (1)
ln(𝑋𝑃𝑖𝑐𝑡) = 𝛽0+ � 𝛾𝑗
𝑗∈𝐽 𝐼𝑗𝑡ln�𝐹𝑗𝑡� + 𝛿 ln(𝑀𝐹𝑃𝑖𝑐𝑡) + 𝜀𝑖 + 𝜀𝑐 + 𝜀𝑡+ 𝜇 (2)
Equation (2) explains an export performance measure 𝑋𝑃𝑖𝑐𝑡 of country 𝑐 in industry 𝑖 at time period 𝑡, by its multifactor productivity level 𝑀𝐹𝑃𝑖𝑐𝑡 and a set of country's factor endowments 𝐹𝑗𝑡 that are scaled by their factor intensity in production. This latter transformation seeks to estimate the extent to which the increase in factor availability reinforces export performance in sectors that intensively use them.13 Equation (1) expresses that multifactor productivity 𝑀𝐹𝑃𝑖𝑐𝑡 is in turn explained by factor endowments and product market regulation 𝑃𝑀𝑅𝑖𝑐𝑡, which does not directly participate in the explanation of export performance. As a consequence, the identification will follow an instrumental variable approach where we treat 𝑀𝐹𝑃𝑖𝑐𝑡 as an endogenous variable and 𝑃𝑀𝑅𝑖𝑐𝑡 as the instrument within a two-stage ordinary least square estimation. Equation (2) will thus be exactly
12
See the trade related works surveyed by Syverson (2011) 13
identified, 𝑃𝑀𝑅𝑖𝑐𝑡 will be the excluded instrument and factor endowments 𝐹𝑗𝑡 and other dummy variables will be the included instruments. We rely in fact on the hypothesis that the policy measure is exogenous to technical progress, which should be a good approximation at least in the short run of our static specification. Moreover, in the estimations that follow the null hypothesis of weak instruments is systematically rejected.
With this specification we can estimate the parameters without splitting the sample by industry, as it would be the case if factor inputs were not scaled by their relative utilisation so that different Rybczynski effects would be expected to depend on the industry. In this manner we exploit the full sample variability of regulation environments and that of technological performances while controlling for factor inputs. From standard international trade theories we expect then 𝛾𝑗 and 𝛿 to be positive. Usual arguments postulating a positive impact of market liberalisation policies would suggest 𝜌 < 0, which we are about to test.
Unobserved heterogeneity is supposed to come from the three dimensions of the data: country, industry and time. We consider then fixed effects for each of them. In the robustness checks we shall also consider individual fixed effects (one for each country-industry couple) in a model where national industries present specific characteristics explaining their export share.
b. Data and sources
We have collected data on capital assets, hours worked and value added from the EU KLEMS database, constructed by the Groningen Growth and Development Centre (GGDC). Details on labour inputs are only available in the 2008 release whereas the rest of series have been drawn from the 2009 release, updated on March 2011.14 The sample considered in the main regressions potentially contains information on 13 manufacturing industries in 13 OECD countries for the 1977-2007 period, with main estimations varying from 3534 to 3781 observations. The latest two years are dropped when estimations include a higher level of detail for labour inputs. A superior coverage can yet be obtained in pairwise descriptive regressions with consistent results.
As EUKLEMS is consistent with national accounts, we have aggregated data on total hours worked by persons engaged (L) and data on gross fixed capital formation (K) for the whole economy and used them as measures of factor endowments. In alternative specifications, we also consider more detailed data on hours worked by high- medium- and low-skilled workers (resp. HS, MS and LS). Factor intensities are proxied via the share of the factor compensation on value added, also available in EUKLEMS.
EU KLEMS also provides measures of multifactor productivity (MFP) growth, but not of MFP levels. In order to obtain the latter, we use the GGDC Productivity Level Database, which gives a benchmark of MFP in levels relative to the United States for 1997. Since these measures need to be comparable across time, countries and industries, a specific deflation procedure is performed with heavy data details, especially to construct purchasing power parities at the industry level. For this reason MFP measures in levels are available only for the benchmark year 1997. Combining this benchmark with MFP growth of EU KLEMS it is possible, however, to reproduce MFP series in levels for our sample period.15
14
http://www.ggdc.net/databases/euklems.htm. A complete description of EU KLEMS can be found in O'Mahony and Timmer (2009)
15
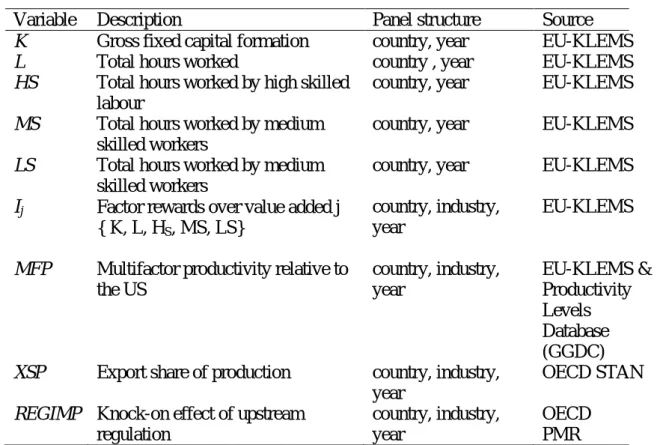
Table 1. Main variables
Variable Description Panel structure Source
K Gross fixed capital formation country, year EU-KLEMS
L Total hours worked country , year EU-KLEMS
HS Total hours worked by high skilled labour
country, year EU-KLEMS
MS Total hours worked by medium skilled workers
country, year EU-KLEMS
LS Total hours worked by medium skilled workers
country, year EU-KLEMS
Ij Factor rewards over value added j ∈
{ K, L, HS, MS, LS}
country, industry, year
EU-KLEMS
MFP Multifactor productivity relative to the US country, industry, year EU-KLEMS & Productivity Levels Database (GGDC)
XSP Export share of production country, industry, year
OECD STAN
REGIMP Knock-on effect of upstream
regulation
country, industry, year
OECD PMR
These data have been completed with other information from the OECD. We use the OECD indicator of regulation impact (Henceforth REGIMP). It informs about the "knock-on" effects of PMR in key input sectors (energy, transport and communication, retail and distribution, finance and professional services) on the rest of the economy. For each industry, regulation in these sectors is weighted accordingly to their use thanks to harmonised input-output tables constructed by the OECD. Hence, a large value of the regulation impact indicator may be the effect of both a restrictive regulation in a particular input sector or a heavy use of the latter as supplier. This proxy is useful as it gives a measure of the strength of regulatory provisions in business operations and at the same time has the advantage of being available in a panel format (i.e. time-varying for each country-industry couple). 16 Finally, the export share of production has been obtained from the OECD STAN indicators database (v. 2009).
3. Preliminary analysis
a. Data patternsWe start with an overview of the data. Box plots in Figure 1 show the central tendency and the dispersion of our main variables, available on a yearly basis for each industry in each country.17 In order to better assess the specificity of our sample heterogeneity, the graph on
16
www.oecd.org/eco/pmr. See Conway and Nicoletti (2006) 17
Each box displays the interval between the 25th percentile and the 75th percentile (i.e. the interquartile range), with the horizontal line inside the box showing the median. The length of the vertical lines (portrayed bellow the lower quartile and above the upper one) are given by the so-called adjacent values. These values are computed as the most extreme values within an interval equal to one and a half times the length of the interquartile range.
each variable is displayed twice, by industry and by country, which are the most structuring dimensions of the data. Panels (a) and (b) present the export share of production (XSP). The hierarchy of countries is in conformity with expectations, large countries (the US or Japan) have lower and less dispersed export shares than smaller countries.
For several countries, the export shares of textiles (17t19), electrical and optical equipment (30t33) as well as chemical products (24), are substantially higher in the respective country sample distribution. However, if one considers the country by country representation, there is in general one specific outlier industry exhibiting an exceptional export performance. In an analogous fashion, for a given industry there is in general one specific country outperforming the rest in relative terms, with the smaller highly dispersed countries (notably, the Netherland, Belgium and Denmark) being remarkable in this respect
Panels (c) and (d) give the median and dispersion of the regulation indicator (regimpact), which measures the strength of downstream restrictiveness caused by upstream regulation, the so-called knock-on effect of upstream regulation. Clearly, considering the country specificity rather than the industry specificity leads to clearer data patterns, although scarcely any observable association between the regulation indicator and the size of the country appears. Interestingly, however, the top and the bottom of the country hierarchy of the export share of manufacturing and the knock-on effect of upstream regulation are inverted. Whereas Belgium appears as having the strongest average knock-on effects of upstream regulation it is the country featuring highest export orientation, which is also consistent with its small size. The opposite is true for the US.
Figure 1.
Note: The figure presents box-plot graphical analysis of central tendency and dispersion of main variables by country and industry. See footnote (4) for further details.
A similar graphical analysis is displayed for the levels of multifactor productivity (relative to the US) in panels (c) and (d). As can be seen, there is substantial dispersion in the levels of productivity according to both country and industry dimensions. The US is not on average the most productive country. Some industries seem to be characterised by extreme values of the productivity level, in particular industries belonging to the chemical, rubber, plastics and fuel products (23 to 25). Some countries exhibit that pattern too, notably Ireland and UK. The highest multifactor productivity level in the sample belongs actually to Ireland in the chemical industry (24), however, excluding Ireland, this industry presents substantially less extreme values.
This first descriptive analysis suggests that data patterns are heavily structured by country and industry specificities that should be kept in mind at the moment of explaining different export
29 30t33 29 34t35 29 29 30t33 30t33 30t33 29 30t33 29 30t33 29 30t33 30t33 29 30t33 30t33 30t33 30t33 30t33 30t3330t3330t3330t3334t3534t3534t3534t3534t3534t3534t3534t3534t3534t3534t3534t3534t3534t3534t35 30t33 30t33 30t33 30t33 17t19 17t19 30t3317t1917t1917t1934t3534t3534t3534t35 34t35 34t35 34t35 34t35 34t35 30t33 30t33 30t33 17t19 17t19 17t19 17t19 17t19 17t19 17t19 17t19 17t19 17t19 17t19 34t35 17t19 17t1917t1934t3534t3517t1917t1917t19 17t19 17t19 17t19 17t19 17t19 17t19 17t19 30t33 17t19 17t19 30t33 17t19 30t33 17t19 17t19 30t33 30t33 30t33 30t33 30t33 30t33 30t33 30t33 30t33 30t33 30t33 24 24 24 0 100 200 300 400 X SP US A
JPN ESP ITA UKFRA GER FINSW E AUTDN K NLDBEL Panel (a) DNK BEL DNK BEL DNK NLD NLD DNK BEL DNK DNK BEL BEL BEL BEL BEL BEL BEL BEL BEL BEL BEL BEL BEL BEL BEL BEL BEL BEL BEL BEL BEL BEL BEL BEL BEL BEL BEL BEL BELNLDNLDNLDNLD NLD NLD NLD NLD NLD NLD NLD NLD NLD NLD NLD NLD NLD NLD DNK DNK BEL BEL DNK BEL BEL BEL BEL BEL BEL BEL BEL BEL BEL BEL BEL BEL BEL BEL BEL BEL BEL BEL BEL BEL BEL BEL BEL BEL BEL BEL BEL BEL BEL BEL BEL BEL BEL BEL BEL BEL BEL BEL BEL BEL BEL BEL BELDNKNLDNLDBELBELBEL
DNK NLD NLD NLD DNK BEL BEL BEL DNK NLD NLD DNK DNK DNK DNK BEL BEL BEL BEL BEL BEL BEL BEL BEL BEL BEL BEL BEL BEL BEL BEL BEL BEL BEL BEL BEL NLD BEL NLD UK NLD BEL BEL BEL BEL NLD BEL NLD BEL BEL BEL NLD BEL NLD BEL BEL NLD NLD NLD NLD NLD NLD NLD NLD BEL BEL BEL BEL BEL BEL BEL BEL BEL 0 100 200 300 400 XS P _ 15t 16 21t 22 20 26 23 36t 37 27t 28 25 17t 19 24 29 30t 33 34t 35 Panel (b) 15t16 34t35 34t35 15t16 15t16 26 21t22 21t22 21t22 21t22 21t22 21t22 21t22 21t22 21t22 21t22 21t22 21t22 17t19 0 .05 .1 .15 .2 .25 R EG IM P US A DN K NLDSW E IRLAUS UK FINFRAGERHU N
AUT JPNCZEESP ITABEL
Panel (c) BEL BEL BEL BEL BEL BEL BEL BEL BEL BEL BEL BEL BEL BEL BEL BEL BEL BEL BEL BEL BEL BEL BEL BEL BEL BEL BEL BEL BEL BEL BEL BEL BEL BEL BEL BEL BEL
BEL BELBELBELBELBELBELBELBELBELBELBELBELBELBEL BEL BEL BEL BEL BEL BEL BEL BEL BEL BEL BEL BEL BEL BEL BEL BEL BEL BEL BEL BEL BEL BEL BEL BEL BEL BEL BEL BEL BEL BELBELBELBELBELBELBELBELBELBEL
0 .05 .1 .15 .2 .25 R EG IM P 17t 19 23 27t 28 29 30t 33 36t 37 25 20 15t 16 34t 35 21t 22 24 26 Panel (d) 25 25 26 25 25 25 26 25 25 25 25 25 23 25 25 25 25 25 25 25 25 25 25 25 25 25 25 25 25 25 25 25 25 25 25 25 25 26 26 26 26 26 26 26 26 26 29 25 29 29 29 29 29 29 29 29 23 23 23 30t33 23 23 23 23 23 23 23 23 23 23 23 23 23 23 23 23 23 23 23 23 20 30t33 23 23 23 25 25 25 23 25 25 25 25 25 25 25 25 25 25 25 36t37 36t37 25 36t37 25 25 25 36t37 36t37 36t37 36t37 36t37 25 36t37 25 36t37 36t37 36t37 36t37 36t37 36t37 36t37 36t37 36t37 36t37 36t37 36t37 36t37 36t37 36t37 36t37 36t37 36t37 25 25 25 25 23 25 23 25 23 36t37 36t37 36t37 36t37 36t37 36t37 36t37 23 36t37 36t37 36t37 36t37 23 23 23 36t37 23 36t37 23 23 23 36t37 36t37 36t37 36t37 36t37 36t37 36t37 36t37 36t37 23 36t37 36t37 36t37 23 36t37 36t37 36t37 23 23 36t37 23 36t37 36t37 23 30t33 25 26 26 30t33 25 30t33 26 26 25 26 25 30t33 26 30t33 30t33 26 26 26 26 25 25 26 26 26 26 26 26 26 26 26 25 26 25 26 26 26 26 26 26 26 26 26 25 25 25 25 25 25 25 25 26 25 26 25 25 25 25 25 25 25 25 25 25 25 25 25 25 25 25 23 23 23 23 21t22 24 24 24 24 24 24 24 24 24 24 24 24 24 24 24 24 24 24 24 24 30t33 23 30t33 30t33 23 30t33 25 25 25 25 25 25 25 25 25 25 25 25 25 25 25 25 25 25 23 25 25 25 25 25 25 25 25 25 0 2 4 6 8 10 M FP CZ E AUTSVNHU N AUSESPJPNNLDSW E FRADN K UK ITAGERUSAIRL FINBEL Panel (e) ITA ITA ITA ITA ITA ITA ITA ITA ITA ITA ITA ITA ITA UK BEL IRL IRL UK AUS BEL AUS IRL AUS UK BEL UK UK UK UK UK FRA UK AUS GER UK UK UK BEL AUS UK UK UK UK BEL BEL BEL BELFINIRLIRLIRLIRLIRLIRL
IRL IRL IRL IRL IRL DNKUKUKDNKUKDNKDNKDNKUKUKDNKDNKUKDNKDNKDNKUKUKUKDNKUKUKDNKUKDNK UK UK UK UK UK UK UK DNK UK DNK UK DNK UK UK UK UK UK UK FRA ITA FRA ITA ESP ITA BEL ITA ITA ITA BEL BEL BEL BEL BEL ESP FRA ESP FIN SWE FRA FIN FIN FIN FIN ESP FIN FRA FRA FIN FIN FRA ESP FRA FIN FRA ESP ESP FRA ESP FRA FRA FRA HUN HUN HUN HUN HUN HUN HUN HUN HUN HUN HUN HUN FRA FRA FRA FRA FRAFIN IRL IRL IRL IRL IRL IRL IRL IRL IRL IRL IRL IRL IRL IRL IRL IRL IRL IRL IRL IRL ITA SVN ITA CZE ITA ITA ITA ITA ITA ITA ITA SVN ITA FRA BEL BEL FRA FRA FRA BEL BEL BEL FRA BEL BEL FRA BEL BEL BEL BEL BEL BEL BEL BEL BEL BEL BEL BEL BEL BEL BEL BEL FRA FRA BEL BEL BEL 0 2 4 6 8 10 M FP 34t 35 23 17t 19 21t 22 36t 37 30t 33 20 29 15t 16 27t 28 24 26 25 Panel (f)
industry-level orientation in our sample. The next section goes further on this by proposing an exploratory regression on reduced-form relationships.
b. Exploratory regressions
Before starting the main econometric analysis it is instructive to examine the empirical relationship between the regulatory indicator and the performance measures of export orientation and productivity. This analysis is done through a set of exploratory regressions shown in Table 2. Regression in column (1) is a simple pooled OLS regression of the (log of) export market share on the (log of) the product market regulation indicator. Such a bivariate estimation gives a significantly negative correlation, which would be compatible with the dominant “common sense” (Aghion and Griffith, 2005) interpretation of the negative influence of PMR on productivity and hence competitiveness. However, when this model is extended to include year dummies (column (2)), industry dummies (regression (3)) and country dummies (column (4)), the consequence is to turn progressively the significantly negative elasticity of REGIMP into a significantly positive one. Therefore, correcting for common shocks and heterogeneity across countries and industries eliminates the “common sense” negative correlation between product market regulation and export orientation. The same conclusion arises in a fixed-effect model assuming the unobserved heterogeneity at the country-industry level, that is to say, in a model where national industries present specific unobserved time-invariant characteristics explaining its export propensity.
Regressions reported in columns (6)-(8) describe the empirical relationship between multifactor productivity and the product market regulation indicator. Consistent with the previous findings, the popular view portraying highly regulated environment as intrinsically inefficient is not found. With all the set of dummies included (column (6)) and even within a more exigent fixed-effect specification (column (7)) the estimated elasticities are again significantly positive. The last regression (column (7)) is a robust one in the sense that it seeks to minimise the effect of outliers, namely of those regarding the dependent variable.18 This additional robustness check confirms the sign of the previous estimates.
Table 2
(1) (2) (3) (4) (5) (6) (7) (8)
𝑙𝑛(𝑋𝑆𝑃) 𝑙𝑛(𝑋𝑆𝑃) 𝑙𝑛(𝑋𝑆𝑃) 𝑙𝑛(𝑋𝑆𝑃) 𝑙𝑛(𝑋𝑆𝑃) 𝑙𝑛(𝑀𝐹𝑃) 𝑙𝑛(𝑀𝐹𝑃) 𝑙𝑛(𝑀𝐹𝑃)
Estimation POLS POLS POLS POLS WG POLS WG RR
𝑙𝑛(𝑅𝐸𝐺𝐼𝑀𝑃) -0.153*** 0.052 0.070** 0.219*** 0.125*** 0.335*** 0.510*** 0.453*** (0.035) (0.037) (0.033) (0.041) (0.04) (0.055) (0.067) (0.045) Fixed-effects No Year Industry,
Year Industry, Country, Year Individual (country-industry), Year Country, Industry, Year Individual (country-industry), Year Country, Industry, Year Obs. 4977 4977 4977 4977 4977 5518 5518 5518
Note: Standard errors in parentheses. POLS stands for pooled OLS regression, WG for within group estimates and RR for robust regression to outliers in the sample.
18
The method used performs an iterative process of assessment of outliers based on residuals which are in turn weighted accordingly to their magnitude (See Hamilton, 1991).
In the same spirit of tracking the effect of possible outliers in the previous estimates, the upper panels of Figure 2 plots the partial elasticity relating the regulation indicator to the export market share as specified by regression in column (4), which controls for country, industry and time fixed effects.19 This regression is run twice, including (Panel (a)) and excluding (Panel (b)) the Coke, refined petroleum products and nuclear fuel industry (23), the rubber and plastic industry (25) as well as Ireland. As previously mentioned, there we observe the most extreme values of multifactor productivity, performing in general more than five times the efficiency level of the US. Clearly, such a filter implies a significantly higher and more precise elasticity of REGIMP.
Figure 2.
Note: Panel (a) and (b) presents the partial elasticity of the regression of the export share of production on the product market regulation indicator (in log form) after controlling for time, country and industry fixed effects. Panel (a) considers the full sample whereas panel (b) exclude potential outliers (industry 23, 25 and Ireland). Panel (c) presents the estimates of the elasticity of the product market regulation indicator after performing quantile regressions at different percentiles of the conditional distribution of the dependent variable (see Koenker and Hallock, 2001).
19
This is done in a two dimensional space by plotting expected conditional residuals, which is an application of the Frisch-Waugh theorem.
-3 -2 -1 0 1 2 e ( l n (XS P) | X ) -1.5 -1 -.5 0 .5 e( ln(REGIMP) | X ) coef = .219, se = .0415, t = 5.29 Panel (a) -3 -2 -1 0 1 2 e ( l n (XS P) | X ) -.4 -.2 0 .2 .4 e( ln(REGIMP) | X ) coef = .720, se = .066, t = 10.95 Panel (b) 0. 00 0. 10 0. 20 0. 30 0. 40 ln (R EG IM P) 0 .2 .4 .6 .8 1 Quantile Panel (c)
Finally, given the important heterogeneity in the sample, one may ask if the fit performed at the mean is actually representative of the relationship in other location of the distribution. Panel (c) in Figure 2 plots the coefficients and confidence intervals stemming from quantile regressions having the same specification as regression in column (4) and performed at different percentile of the conditional distribution of (the log) of XSP. Basically, these estimations seek to fit the model at different quantiles of the conditional distribution of the export share of production, instead of fitting at its expected conditional mean (as in a standard OLS). The graph also presents the OLS elasticity with its confidence intervals (the horizontal lines depicted in the figure). This exercise reveals that the estimated OLS elasticity provides a fairly representative picture of the relationship between the export share of production and the regulation indicator in most of the conditional distribution.
To sum up, the “common sense” notion that product market regulation should lead to lower productivity and lower export orientation is not supported by this preliminary inspection of the data. In order to assess the robustness of these findings, we now turn to the estimation of the system of equation discussed above, which includes, in a more parsimoniously way, traditional determinants of comparative advantage.
4. Estimation results
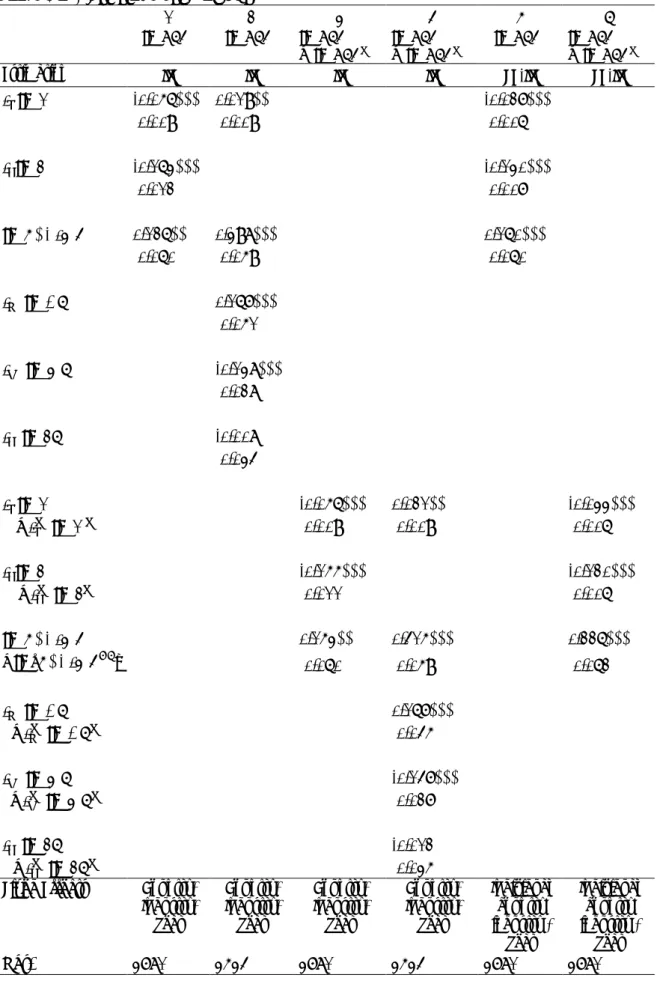
Table 3 presents the estimation results for the first stage equation (Table 3.a) linking product market regulation to productivity and for the second stage (Table 3.b) where the export share of production is determined by the productivity level. Six different specifications are considered, depending on whether all variables are considered relative to the US (regressions in columns (3), (4) and (6)) or not, whether the labour input is detailed according to the skill level (high, medium, low, presented in columns (2) and (4)) or not, and whether the model consider individual (country-industry couples) fixed effect (columns (5) and (6)) or not.
The simplest specification is an instrumental variable (IV) regression distinguishing only aggregate capital and labour input (column (1)). In this estimation, the first stage results show a negative influence of factor inputs variables on multifactor productivity, which may reflect a smaller than unity scale effect or an inaccurate accounting of factor inputs, but a significantly positive influence of product market regulation. Recall that factor input variables are multiplicative terms that interact the national availability of the factor with the intensity of their use in production. Hence, as expected, the availability of factors intensely used in an industry has a positive impact on its export share of production at the second stage. Moreover, multifactor productivity also significantly boosts export orientation of the industry. Therefore, this IV estimation suggests that product market regulation has a positive influence on productivity, which in turns favourably impacts exports.
Table 3.a. First-stage estimations
(1) (2) (3) (4) (5) (6)
𝑙𝑛(𝑋𝑆𝑃) 𝑙𝑛(𝑋𝑆𝑃) 𝑙𝑛(𝑋𝑆𝑃)
− 𝑙𝑛(𝑋𝑆𝑃𝑈𝑆) 𝑙𝑛(𝑋𝑆𝑃)− 𝑙𝑛(𝑋𝑆𝑃𝑈𝑆) 𝑙𝑛(𝑋𝑆𝑃) 𝑙𝑛(𝑋𝑆𝑃)− 𝑙𝑛(𝑋𝑆𝑃𝑈𝑆)
Estimation IV IV IV IV FE-IV FE-IV
𝐼𝐾𝑙𝑛(𝐾) -0.056*** 0.019** -0.027*** (0.009) (0.009) (0.006) 𝐼𝐿𝑙𝑛(𝐿) -0.163*** -0.130*** (0.012) (0.007) 𝑙𝑛(𝑅𝐸𝐺𝐼𝑀𝑃) 0.126** 0.398*** 0.160*** (0.060) (0.059) (0.060) 𝐼𝐻𝑆𝑙𝑛(𝐻𝑆) 0.167*** (0.051) 𝐼𝑀𝑆𝑙𝑛(𝑀𝑆) -0.138*** (0.028) 𝐼𝐿𝑆𝑙𝑛(𝐿𝑆) -0.008 (0.034) 𝐼𝐾𝑙𝑛(𝐾) -0.056*** 0.021** -0.033*** −𝐼𝐾𝑈𝑆𝑙𝑛(𝐾𝑈𝑆) (0.009) (0.009) (0.006) 𝐼𝐿𝑙𝑛(𝐿) -0.155*** -0.120*** −𝐼𝐿𝑈𝑆𝑙𝑛(𝐿𝑈𝑆) (0.011) (0.006) 𝑙𝑛(𝑅𝐸𝐺𝐼𝑀𝑃) 0.153** 0.415*** 0.226*** −𝑙𝑛�𝑅𝐸𝐺𝐼𝑀𝑃𝑈𝑆� (0.060) (0.059) (0.062) 𝐼𝐻𝑆𝑙𝑛(𝐻𝑆) 0.167*** −𝐼𝐻𝑆𝑈𝑆𝑙𝑛(𝐻𝑆𝑈𝑆) (0.045) 𝐼𝑀𝑆𝑙𝑛(𝑀𝑆) -0.147*** −𝐼𝑀𝑆𝑈𝑆𝑙𝑛(𝑀𝑆𝑈𝑆) (0.027) 𝐼𝐿𝑆𝑙𝑛(𝐿𝑆) -0.012 −𝐼𝐿𝑆𝑈𝑆𝑙𝑛(𝐿𝑆𝑈𝑆) (0.035)
Fixed Effects Country, Industry, Year Country, Industry, Year Country, Industry, Year Country, Industry, Year Individual (country-industry), Year Individual (country-industry), Year Obs. 3781 3534 3781 3534 3781 3781
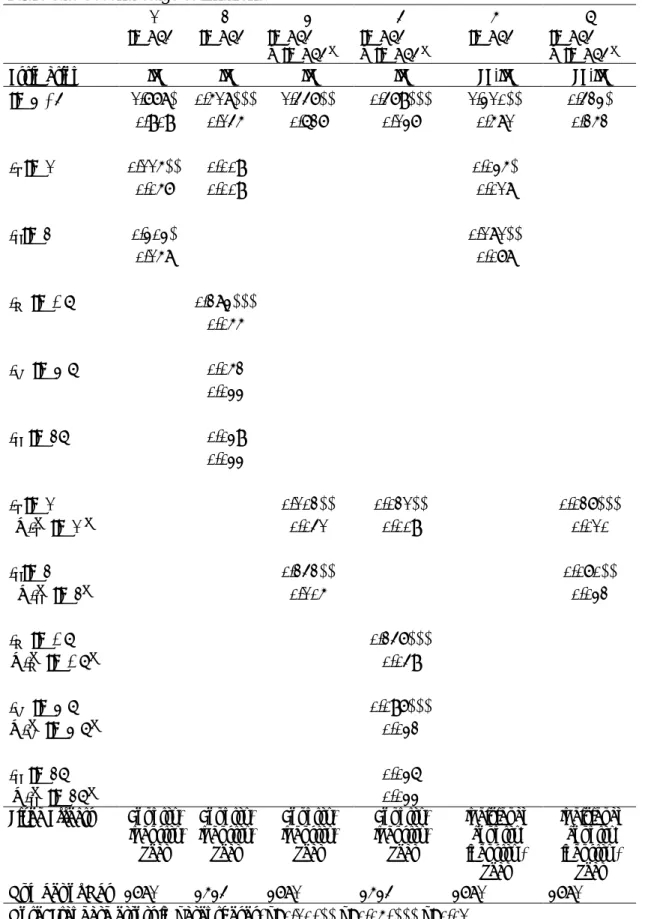
Table 3.b. Second-stage estimations.
(1) (2) (3) (4) (5) (6)
𝑙𝑛(𝑋𝑆𝑃) 𝑙𝑛(𝑋𝑆𝑃) 𝑙𝑛(𝑋𝑆𝑃)
− 𝑙𝑛(𝑋𝑆𝑃𝑈𝑆) 𝑙𝑛(𝑋𝑆𝑃)− 𝑙𝑛(𝑋𝑆𝑃𝑈𝑆) 𝑙𝑛(𝑋𝑆𝑃) 𝑙𝑛(𝑋𝑆𝑃)− 𝑙𝑛(𝑋𝑆𝑃𝑈𝑆)
Estimation IV IV IV IV FE-IV FE-IV
𝑙𝑛(𝑀𝐹𝑃) 1.778* 0.518*** 1.447** 0.479*** 1.310** 0.423* (0.909) (0.145) (0.627) (0.137) (0.581) (0.252) 𝐼𝐾𝑙𝑛(𝐾) 0.115** 0.009 0.035* (0.057) (0.009) (0.018) 𝐼𝐿𝑙𝑛(𝐿) 0.303* 0.181** (0.158) (0.078) 𝐼𝐻𝑆𝑙𝑛(𝐻𝑆) 0.283*** (0.055) 𝐼𝑀𝑆𝑙𝑛(𝑀𝑆) 0.052 (0.033) 𝐼𝐿𝑆𝑙𝑛(𝐿𝑆) 0.039 (0.033) 𝐼𝐾𝑙𝑛(𝐾) 0.102** 0.021** 0.027*** −𝐼𝐾𝑈𝑆𝑙𝑛(𝐾𝑈𝑆) (0.041) (0.009) (0.010) 𝐼𝐿𝑙𝑛(𝐿) 0.242** 0.070** −𝐼𝐿𝑈𝑆𝑙𝑛(𝐿𝑈𝑆) (0.105) (0.032) 𝐼𝐻𝑆𝑙𝑛(𝐻𝑆) 0.247*** −𝐼𝐻𝑆𝑈𝑆𝑙𝑛(𝐻𝑆𝑈𝑆) (0.049) 𝐼𝑀𝑆𝑙𝑛(𝑀𝑆) 0.097*** −𝐼𝑀𝑆𝑈𝑆𝑙𝑛(𝑀𝑆𝑈𝑆) (0.032) 𝐼𝐿𝑆𝑙𝑛(𝐿𝑆) 0.036 −𝐼𝐿𝑆𝑈𝑆𝑙𝑛(𝐿𝑆𝑈𝑆) (0.033)
Fixed Effects Country, Industry, Year Country, Industry, Year Country, Industry, Year Country, Industry, Year Individual (country-industry), Year Individual (country-industry), Year Number of Obs 3781 3534 3781 3534 3781 3781
Distinguishing several skill levels gives different estimations of the contributions of factor inputs (column (2)). In the first stage only the medium skilled labour input obtains a significantly negative coefficient, but high skill labour input is significantly positively contributing to productivity. As in the previous estimation, the coefficient of the regulatory indicator is substantially higher and still significantly positive. In the second stage, can be noted the positive contributions of capital and high-skill labour inputs, which means that export share are higher when these factors are proportionally heavily used in production. Here also, productivity favourably influences exports, but the coefficient is somewhat lower than in the regression reported in column (1).
The estimates presented in column (3) take into account all variables relative to the US. This is done as a robustness check on the fact that the measures of productivity levels that we can obtain are only available relative to the US, which means that equations are more meaningful if expressed in relative terms. These estimates can be compared with those presented in column (1). Results are not substantially different. The same conclusion applies to regression (4), which can be compared to regression (2). One may note however that the positive impact of product market regulation is larger in specifications relative to the US. Regressions reported in columns (5) and (6) take a more precise account of heterogeneity. Besides time fixed effects they include individual country-industry fixed effects. Remarks regarding the impact of factor inputs at each stage are similar to those made with the other specifications. The positive impact of product market regulation is somewhat higher in fixed-effect specifications than in the equivalent IV regressions and the impact of productivity on exports slightly lower.
Overall, the conclusions drawn from these estimations are that, contrary to the “common sense” regarding the consequences of product market regulation, the impact of the latter on productivity is significantly positive, which translates in better export performance at the industry level.
5. Conclusion
This paper has analysed the impact of product market regulation on the propensity to export at the industry level for 13 OECD countries and 13 industries over the 1977-2007 period. Recent economic policy and academic literature insists on the negative effects of product market regulation on productivity or innovation. Since the latter can be held to be positive factors influencing a broadly defined “competitiveness”, the conclusion from the dominant opinion on that matter is that product market regulation should be detrimental to exports. The results of the tests performed in this paper lead to a different conclusion. Using various estimation specifications, it is shown that the knock-on effect of product market regulation in key input sectors (energy, transport and communication, retail and distribution, finance and professional services) has a positive influence on the productivity of industries. In turn, productivity has, as expected, a positive effect on the propensity to export. Therefore, the common sense opinion that product market regulation harms competitiveness is not supported. These results confirm previous findings on the influence of PMR on innovation (Amable, Demmou and Ledezma, 2010, 2013; Amable, Ledezma and Robin, 2010; Ledezma, 2013).
References
Aghion P., Bloom N., Blundell R., Griffith R. and P. Howitt (2005). "Competition and Innovation: An Inverted-U Relationship". Quarterly Journal of Economics, Vol. 120, No. 2, pp. 701-728.
Aghion P. and R. Griffith (2005). Competition and Growth. Reconciling Theory and
Evidence. Cambridge: MIT Press.
Amable B., Demmou L. and I. Ledezma (2010). "Product Market Regulation,
Innovation, and Distance to Frontier". Industrial and Corporate Change, Vol. 19, No. 1, pp. 117-159.
Amable B., Demmou L. and I. Ledezma (2013) L’impact de la réglementation sur l’innovation : une analyse des perfomances selon la proximité à la frontière technologique. Economie et Prevision
Amable B., Ledezma I. and S. Robin (2010). "Product market regulation, innovation and productivity". CEPREMAP Mimeo.
Arnold J., Nicoletti G. and S. Scarpetta (2008). "Regulation, Allocative Efficiency and Productivity in OECD Countries: Industry and Firm-Level Evidence". OECD
Economics Department Working Paper No. 616, OECD Publishing.
Balassa B. (1963). "An Empirical Demonstration of Classical Comparative Cost Theory". The Review of Economics and Statistics, Vol. 45, No. 3, pp. 231-238.
Ben Yahmed S. and S. Dougherty (2012). "Import Competition, Domestic Regulation and Firm-Level Productivity Growth in the OECD". OECD Economics Department Working Papers, No. 980, OECD Publishing.
Bernard A., Redding S. and P. Schott (2012)." The Empirics of Firm Heterogeneity and International Trade". Annual Review of Economics. In press.
Bourlès R., Cette G., Lopez J., Mairesse J., and G. Nicoletti (2012). "Do Product Market Regulations in Upstream Sectors Curb Productivity Growth? Panel Data Evidence for OECD Countries". The Review of Economics and Statistics, in press. Conway P. and G. Nicoletti (2006)." Product Market Regulation in the
Non-Manufacturing Sector of OECD Countries: Measurements and Highlights". OECD Economics Department Working Paper No. 530. Paris: OECD.
Conway P., de Rosa D., Nicoletti G. and F. Steiner (2006). "Regulation, Competition, and Productivity Convergence". Economics Department Working Papers No. 509, Paris: OECD.
Dixit A. and V. Norman (1980). The Theory of International Trade. Cambridge: Cambridge University Press.
Etro F. (2007). Competition, Innovation, and Antitrust. A Theory of Market Leaders
and Its Policy Implications. Berlin: Springer Verlag.
European Commission (2010). “An Integrated Industrial Policy for the Globalisation Era. Putting Competitiveness and Sustainability at Centre Stage”. Communication from the Commission tothe European Parliament, the Council, the European Economic and Social Committee and the Committee of the regions. European Commission, Brussels, COM(2010) 614.
Feenstra R. and H. Kee (2008). "Export variety and country productivity: Estimating the monopolistic competition model with endogenous productivity". Journal of
International Economics, Vol. 74, No. 2, pp. 500-518.
Gallois L. (2012). Pacte pour la compétitivité de l’industrie française. Rapport au Premier Ministre.
Hamilton L. (1991). srd1: How robust is robust regression? Stata Technical Bulletin 2: 21–26. Reprinted in Stata Technical Bulletin Reprints, vol. 1, pp. 169–175. College Station, TX: Stata Press.
Harrigan J. (1997). "Technology, Factor Supplies, and International Specialization: Estimating the Neoclassical Model". American Economic Review, Vol. 87, No. 4, pp. 475-94.
Harrison and Rodriguez-Clare (2010). "Trade, Foreign Investment, and Industrial Policy for Developing Countries". Handbook of Development Economics, Vol. 5. Elsevier B.V. Chapter 63, pp.4039-4214.
Helpman E. and P. Krugman (1985). Market structure and foreign trade. Cambridge, MA: MIT Press.
Inklaar R. and M. Timmer (2008). "GGDC productivity level database: international comparisons of output, inputs and productivity at the industry level". GGDC Research Memorandum GD-104, University of Groningen.
Koenker R. and Hallock H.F. (2001). “Quantile Regression”. Journal of Economic
Perspectives, Vol. 15, No. 4, 143–156.
Krugman P. (1993)."What Do Undergrads Need to Know About Trade?". American
Economic Review, Papers and Proceedings, Vol. 83, No. 2, pp. 23-26
Ledezma (2013). "Defensive Strategies in the Quality Ladders". Journal of Economic
Dynamics and Control, Vol. 37, N° 1, pp. 176–194.
Leontief W. (1953). "Domestic Production and Foreign Trade: The American Capital Position Re-examined." Proceedings of the American Philosophical Society, Vol. 9, No. 4, pp. 332-49.
Nickell S., Redding S. and J. Swaffield (2008). "The Uneven Pace of
Deindustrialisation in the OECD". The World Economy. Vol. 31, No. 9, pp. 1154– 1184
Nicoletti G. and S. Scarpetta (2003). "Regulation, Productivity and Growth: OECD Evidence". Economic Policy, No. 36, pp. 9-72.
Nunn N. (2007). "Relationship- Specificity, Incomplete Contracts, and the Pattern of Trade". Quarterly Journal of Economics, Vol. 122, No. 2, pp. 569-600.
O'Mahony M. and M. Timmer (2009). "Output, Input and Productivity Measures at the Industry Level: The EU KLEMS Database". The Economic Journal, Vol. 119, N° 538, pp. F374 - F403.
Redding S. (2002). "Specialization Dynamics". Journal of International Economics, Vol. 58, No. 2, pp. 299-334
Rodriguez F. and D. Rodrik (2001). "Trade Policy and Economic Growth: A Skeptic's Guide to the Cross-National Evidence," in Macroeconomics Annual 2000, eds. Ben Bernanke and Kenneth S. Rogoff, MIT Press for NBER, Cambridge, MA.
Romalis J. (2004). "Factor Proportions and the Structure of Commodity Trade".
American Economic Review, Vol. 94, No. 1, pp. 67-97.
Syverson C. (2011). "What Determines Productivity?". Journal of Economic
Appendix
Table A1. List of industries
Code Description
15t16 FOOD , BEVERAGES AND TOBACCO
17t19 TEXTILES, TEXTILE , LEATHER AND FOOTWEAR 20 WOOD AND OF WOOD AND CORK
21t22 PULP, PAPER, PAPER , PRINTING AND PUBLISHING 23 Coke, refined petroleum and nuclear fuel
24 Chemicals and chemical products 25 Rubber and plastics
26 OTHER NON-METALLIC MINERAL
27t28 BASIC METALS AND FABRICATED METAL 29 Machinery,
30t33 ELECTRICAL AND OPTICAL EQUIPMENT 34t35 TRANSPORT EQUIPMENT
36t37 MANUFACTURING NEC; RECYCLING
Note: capital letters indicate 2-digit industry aggregation
Table A2. List of countries
Code Description
AUS * Australia
AUT Austria
BEL Belgium
CZE * Czech Republic
DNK Denmark ESP Spain FIN Finland FRA France GER Germany HUN * Hungary IRL * Ireland ITA Italy JPN Japan NLD Netherland SVN * Slovenia SWE Sweden UK United Kingdom
USA United States
Note : * indicates countries without information on export share, but considered in the exploratory regression of multifactor productivity.