HAL Id: ird-00593507
https://hal.ird.fr/ird-00593507
Submitted on 16 May 2011
HAL is a multi-disciplinary open access archive for the deposit and dissemination of sci-entific research documents, whether they are pub-lished or not. The documents may come from teaching and research institutions in France or abroad, or from public or private research centers.
L’archive ouverte pluridisciplinaire HAL, est destinée au dépôt et à la diffusion de documents scientifiques de niveau recherche, publiés ou non, émanant des établissements d’enseignement et de recherche français ou étrangers, des laboratoires publics ou privés.
The family at the heart of the household : evolution and
differentiation of household structure in Côte d’Ivoire,
1975-98
Patrice Vimard, Raïmi Fassassi
To cite this version:
Patrice Vimard, Raïmi Fassassi. The family at the heart of the household : evolution and differen-tiation of household structure in Côte d’Ivoire, 1975-98. Van de Walle, Etienne. African households censuses and surveys, M.E. Sharpe ; M.E. Sharpe, pp.102-125, 2006, A General Demography of Africa. �ird-00593507�
household structure in Côte d'Ivoire, 1975-98. In : Van de Walle E. (ed.) African households censuses and surveys. New York (USA) ; Londres : M.E. Sharpe ; M.E. Sharpe, 2006, p. 102-125.
Chapter 6
The Family at the Heart of the Household:
Evolution and Differentiation of Household Structure in Côte d’Ivoire, 1975–1998
Patrice Vimard* and Raïmi Fassassi**
Research on the family and on households has provoked many theoretical debates, from the functionalist theories of Talcott Parsons (1955) to the affirmation of Louis Roussel (1986) that there is a plurality of family models, via the William Shorter’s demonstration (1977) of the existence of a postmodern family (Vimard 1997).
We will not revisit these debates here. They provide a background, however, for a discussion of the present-day evolution of family and household and their prospects. Although such a discussion has often been based on studies of industrialized countries, it is also relevant for developing countries that are undergoing profound transformations of their kinship structure.1 It is particularly important for countries of sub-Saharan Africa, where kinship systems shaped the structure of traditional societies.
The following questions must be addressed if we want to make sense of present-day forms of the family and the household: What is the role of kinship relations in the formation of residential units? How permanent are households based on an extended family, and how important is the pattern of nuclearization? Are there types of households, such as single-person or one-parent households, that reflect a certain decay of family structure? Can the presence of a single or dominant model of co-residence be ascertained, or do several models coexist? Are there differentials between sections of the population that can be explained by social class, mode of production, or economic situation?
In order to answer these questions, we have selected Côte d’Ivoire, a country for which we have access to several countrywide sources of data since 1975. These sources have already made it possible to identify certain characteristics and trends of such family structures as the family nucleus and the household. For example, the analysis of the multi-round survey of 1977–78 led to the following main conclusions (Vimard and N’Cho 1988):
The nuclear2 family household presents itself . . . as the dominant form that determines to a large extent
the structure of family nuclei and the family life cycle of individuals. It assumes a different weight in
* Directeur de recherche at the IRD, Laboratoire Population-Environnement-Développement, Marseille, F.ance. ** Teacher-Researcher at ENSEA, Abidjan, Côte d’Ivoire.
THE FAMILY AT THE HEART OF THE FAMILY
103
various populations, is more widespread in rural than in urban areas, and varies according to demographic characteristics of the head of the unit, being non-existent for women and weak for the youngest and the oldest men. Beside this nuclear unit, widely diffused secondary forms can also be identified, such as the single parent family unit headed by a woman, and non-family units. The importance of links between related or non-related individuals outside of the nuclear component itself should be noted. These family structures that run counter to the exclusive character of the nuclear family are essentially a consequence of the activation of solidarity within extended families, of the development of extra-family structures of co-residence, of female autonomy and of the appearance of new forms of parenthood.
These conclusions were obtained by considering the family nucleus as a statistical unit of observation. They were confirmed by observations of larger units such as households or domestic groups in urban (Antoine and Herry 1983) and rural areas (Vimard 1987). The analysis of household structure in the census of 1988 revealed relatively distinct patterns of household structure by socioeconomic groups, which may thus be characterized as a particular mode of residential aggregation by kinship group (Vimard and N’Cho 1993).
In view of consistent series of observations, it seems useful to seek a more complete view of the evolution of household structure in order to evaluate the persistence over time of these multiple family models as well as their transformations, and to investigate the principles that determine household structure in the communities residing in Côte d’Ivoire. In the following analysis we try to estimate the extent to which, at the global level and for various groups represented in the population, various phenomena have emerged that are manifestations of a relative fraying of the demographic fabric of society: an increase in the number of single-person households, a dominance of the nuclear component of households and even of the mother-child dyad, and the instability of the marital nucleus. These phenomena have become obvious in the last thirty years in industrialized countries, but they can also be observed in the developing world. It is also necessary to document the relevance of developments that are characterized by the survival or reappearance of family solidarities, made concrete by the persistence of the extended household structures that have been observed in African societies (Locoh 1988; Vimard 1993).
The present chapter updates and complements an earlier article (Vimard and N’Cho 1997). At the time, data were available from the population censuses of 1975 and 1988 and from the 1993 survey of migration and urbanization. Since the 1993 survey was close in time to that of the census of 1988, the analysis was not entirely adequate to evaluate long-term family changes. Today it is possible to use the results of a national survey on household living standards that took place in 1998, while awaiting access to the files of the population census of 1998. The difference between the definition of the household in the censuses and that used at the time of the 1998 survey might have resulted in different classifications of heads and members of households, and therefore in different estimates of the size and composition of households.3 A comparison of certain general characteristics that are available for the census of 1998 suggests that this did not happen. In 1998, the average size of the household was 5.8 in the census and 5.9 in the living standard survey; the proportions of female heads of households were 16.0 and 15.3 percent respectively; the mean age of household heads was 42.2 and 43.0 years respectively (data from the 1998 General Census of Population and Housing). Using the 1998 data provides more historical depth, particularly in regard to the changes during
the decade of the 1990s, a crucial point if we wish to link the evolution of households with that of the economy and society. The period covered by our sources offers strong contrasts from an economic point of view. The year 1975 is situated toward the end of a stage of intense economic growth, which has been called the “Ivoirian model of development.” Per capita gross national product reached its peak in 1980. After that, a severe economic crisis with important social and political consequences resulted in a 30 percent decline of the GNP by 1988, the date of our second observation. The decade 1988–98 was an era of stagnation of production, but particulars varied from sector to sector. Agriculture and the rural areas benefited more than small-scale industrial production and the urban areas from various structural adjustment plans and from the 1994 devaluation of the CFA franc (Grimm et al. 2000). In spite of the crisis, progress as measured by the UNDP human development index continued during the period 1980–98, although at a slower pace than in the preceding decades (Talnan 2001). This long period of economic upheaval was accompanied by a slowing down of urban growth and a diversification of migration streams. Exhaustion of the soil in the newly exploited parts of the forest regions and an employment crisis in the modern urban sector of the economy resulted in complex patterns of mobility that, more than was the case in the past, combined rural-rural migration, return migration from the city to the countryside, and temporary moves (Tapinos et al. 2002). Evolution of Household Composition
Three population files were used for this analysis: those of the two first censuses of Côte d’Ivoire, in 1975 and 1988, and that of the National Household Living Standards Survey of 1998. Random samples of districts were drawn from the censuses, of 1 in 30 for 1975 and 1 in 35 for 1988. The entire sample of the national living standard survey was used. It had been drawn randomly among 210 clusters drawn from enumeration areas in the census of 1988, weighed to insure the representativity of the sample.
The household files include: for 1975, 34,842 households comprising a de jure population of 191,191 persons; for 1988, 44,622 households with a de jure population of 269,623 persons; for 1998, 4,200 households with a de jure population of 24,560.4
Heads of Household
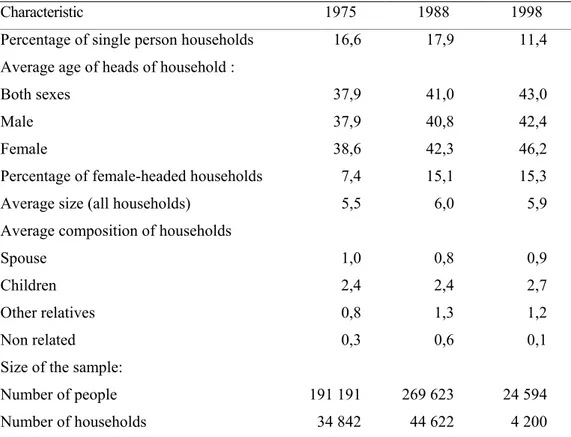
The sub-population of household heads underwent three evolutions (Table 6.1). First, the share of single-person households decreased after a slight initial increase. Second, there was an important increase in the mean age of household heads between 1975 and 1998, for males as well as for females. And finally, and most importantly, there was a large increase in the proportion of female-headed households between 1975 and 1988, followed by stabilization during the most recent period.5 The share of female-headed households more than doubled in twenty-three years. The increase was proportionately largest among households of more than two members: their number multiplied almost by two and a half.
THE FAMILY AT THE HEART OF THE FAMILY
105
Table 6.1. Change in household characteristics (in percent)
Characteristic 1975 1988 1998
Percentage of single person households 16,6 17,9 11,4 Average age of heads of household :
Both sexes 37,9 41,0 43,0
Male 37,9 40,8 42,4
Female 38,6 42,3 46,2
Percentage of female-headed households 7,4 15,1 15,3 Average size (all households) 5,5 6,0 5,9 Average composition of households
Spouse 1,0 0,8 0,9
Children 2,4 2,4 2,7
Other relatives 0,8 1,3 1,2
Non related 0,3 0,6 0,1
Size of the sample:
Number of people 191 191 269 623 24 594 Number of households 34 842 44 622 4 200 Sources : Micro-data from the 1975 and 1988 censuses of Côte d’Ivoire and from the National Household Living Sandards Survey of 1998.
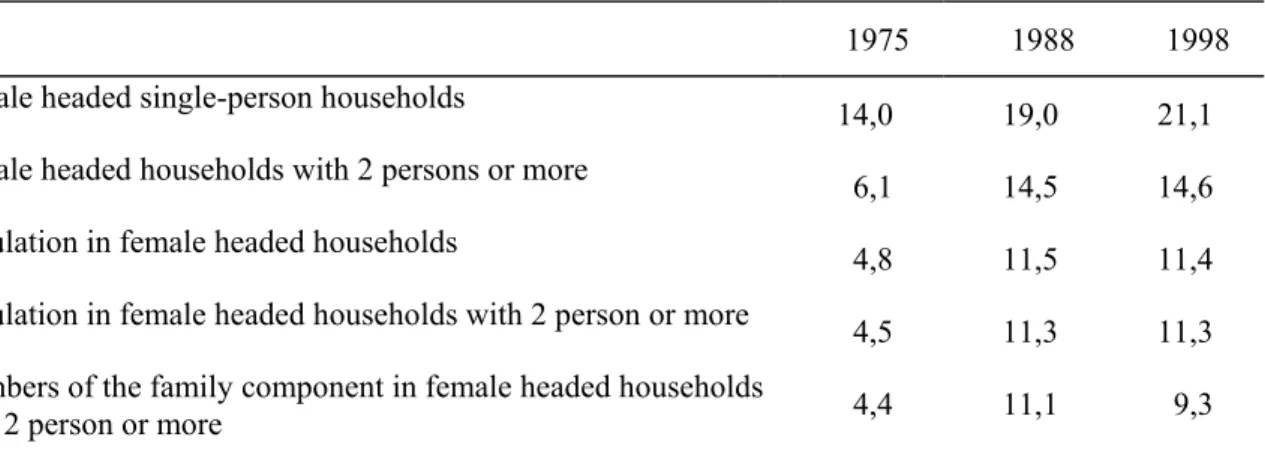
This increase in the proportion of female-headed households between 1975 and 1998 led to a corresponding increase of the population living in such households (Table 6.2). The contribution of women to the family structure increased markedly during the two decades of observation, and in the end was no longer a marginal factor as it had been in 1975.
Table 6.2. Changes in the percentage of female heads of household and of the population living in their households
1975 1988 1998
Female headed single-person households 14,0 19,0 21,1 Female headed households with 2 persons or more 6,1 14,5 14,6 Population in female headed households 4,8 11,5 11,4 Population in female headed households with 2 person or more 4,5 11,3 11,3 Members of the family component in female headed households
with 2 person or more 4,4 11,1 9,3 Sources : Micro-data from the 1975 and 1988 censuses of Côte d’Ivoire and from the National Household Living Sandards Survey of 1998.
Changes in the General Composition of Households
During the period of observation, the average size of households increased from 5.5 to 6 persons between 1975 and 1988, and then stabilized between 1988 (6 persons) and 1998 (5.9 persons). (See Table 6.1).6 This overall increase in size is worth noting, as it occurred during a period marked by a decline of polygyny—the proportion of polygynist among married males drops from 25 to 19 percent between 1975 and 1998—and by growth of the urban population—from 35 to 42 percent of the total population during the same period. These two factors would seem to operate in favor of a reduction in the size of households. Their effect is compensated by various social phenomena that we will examine in the subsequent analysis, and that include a decline in the number of persons living alone and an increase in the number of “other relatives” in the households. The increase in average size was the combined result of changes in the size of households of two persons or more—6.4 in 1975, 6.8 in 1988, and 6.5 in 1998—and of the proportion of one-person households.
Other trends deserve to be noted. The number of non-related individuals per household decreased over the period. However, the size of the family component (head, spouse, children and other relatives) grew from 5.2 in 1975, to 5.5 in 1988, and 5.8 in 1998. This family component increased also as a proportion of all households, from 95 percent in 1975 to 98 percent in 1998. Within it, the various categories of relatives evolved differently; the average number of spouses was stable, while the number of children and other relatives increased (Table 6.1). Thus, the nuclear component increased absolutely from 4.4 to 4.6 persons, but decreased as a proportion of the whole family, from 80 to 78 percent. Households became more family-centered, but not more nuclear, as they included on average more children and more other relatives, but fewer non-related members, in 1998 than in 1975.
THE FAMILY AT THE HEART OF THE FAMILY
107
These global tendencies seem to confirm certain observations of economists and sociologists on Ivoirian society. They have noted the evolution of kinship solidarity, including the welcoming of the underprivileged in the more well-to-do households at the beginning of a crisis, and the weakening of solidarity as the crisis lasts or intensifies (Vidal and Le Pape 1986; Jarret and Mahieu 1991). Welcoming the poor may well explain the doubling of the number of the non-related in households between 1975 and 1988, while the strong decline by 1998 would reflect the weakening of social solidarity. Such parallelism over time should be treated with a grain of salt, however. The welcoming curve seems to reach a peak in 1988 if we believe the statistical evidence, whereas the process of expelling guests was already reported earlier in households from Abidjan (Vidal and Le Pape 1986). Similarly, the decline in 1998 occurred at the end of a period during which the general economic situation had been relatively stable.
Changes in the Composition of Households of Two Persons or More
Considering households of two persons or more separately in Table 6.3 controls for the effect of changes in the proportion of single-person households, which will be discussed later. The size of the latter households was relatively stable at the two ends of the period of observation, 1975 and 1998, although it increased in 1988. The trend in the family component is different: it is stable between 1975 and 1998, and grows in 1998. Within the family component, the various categories of relatives change slightly; the decline in the number of spouses and the increase in the number of children and other relatives suggest a tendency toward denuclearization. Most of the variation is in the number of non-related persons, and this accounts for a major part of the change in the average size of households.
Composition of the Household According to Sex of the Head
The growing importance of female-headed households lends special interest to the differences in the make-up of households by sex of their head (Table 6.3). Concentrating again on households with two or more members, female-headed households are in sharp contrast with those headed by men in the following respects:
• they are markedly smaller: 5.0 persons versus 6.7 in 1998;
• spouses are almost completely absent, as female heads consist most often of widows or divorced women;
• children are fewer, about 2 in contrast with 3 for male-headed households; • other relatives are more numerous: for example, in 1998, 1.7 versus 1.3.7
On the other hand, the numbers of non-related individuals are comparable. Thus, female-headed households are characterized by a more restricted biological cell, because of the absence of a spouse and a smaller number of children, and by a wider extension in the direction of extra-nuclear kinship. The trends in the average size of these households between 1975 and 1998 runs parallel with that of the male-headed ones: an increase until 1988, followed by a decrease; over the whole period, size increases for both sexes.
Table 6.3. Change in average composition of household, by sex of the head (households of 2 persons or more)
Spouse Child Other relative Non related Total Male 1975 1,3 2,9 1,0 0,3 6,5 1988 1,1 2,9 1,5 0,7 7,1 1998 1,1 3,2 1,3 0,1 6,7 Female 1975 0,1 2,1 1,2 0,3 4,7 1988 0,1 1,8 1,9 0,6 5,4 1998 0,0 2,2 1,7 0,1 5,0 Both sexes 1975 1,2 2,9 1,0 0,3 6,4 1988 0,9 2,7 1,5 0,7 6,8 1998 1,0 3,0 1,4 0,1 6,5 Sources : Micro-data from the 1975 and 1988 censuses of Côte d’Ivoire and from the National Household Living Sandards Survey of 1998.
The evolution by sex leads to the conclusion that the relative stability of the average size of households of more than two persons during our period of observation is principally accounted for by an increase in the proportion of the smaller female-headed households, while the average size increases for both categories of heads of household.
Changes in the Structure of Households by Socioeconomic Groups General Evolution of Household Structure
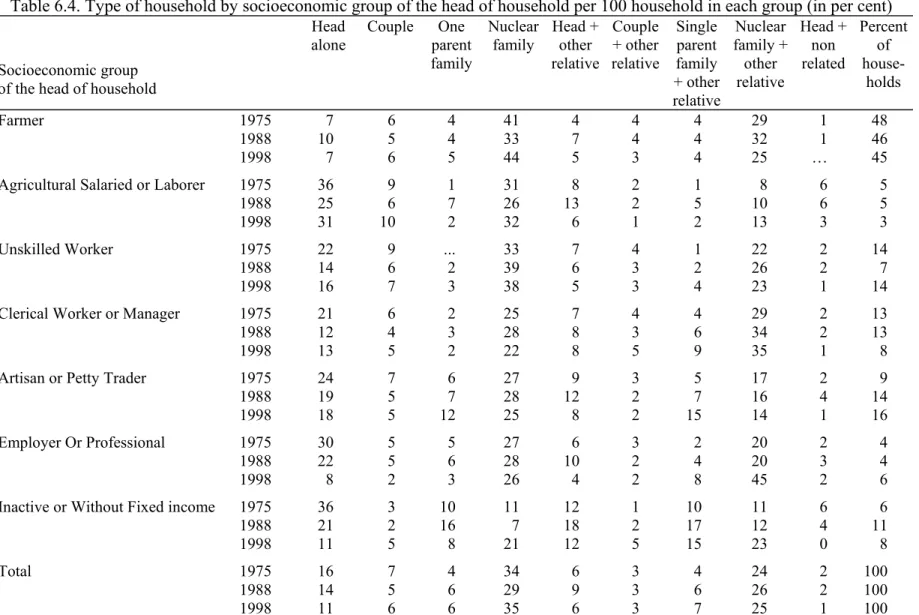
A look at the distribution of households by type complements the preceding discussion of size, composition, and sex of head. In the following typology, we distinguish between nine types of households on the basis of the structure of their nuclear component and of the presence or absence of individuals classified as “other relatives.”8 This yields the following types: “living alone,” “couple,” “single-parent family,” “nuclear family,” “head of household + other relative,” “couple + other relative,” “single-parent family + other relative,” “nuclear family + other relative,” “head of household + non-related” (Table 6.4).9
For the population as a whole, the dominant impression is one of stability of the various types of households. Some changes in the distribution should be noted, however. First, the proportion of persons living alone declined from 16 to 11 percent of the households. Next, one-parent families increased from 8 percent in 1975 to 13 percent in 1998; the change reflects a decline in marital stability. Finally, the inclusion of “other relatives” in the household showed a slight increase, from 37 percent of the households in 1975 to 41 percent in 1998. This shows the increasing tendency, for at least two decades, to include members of the kinship group of the head of household who are not part of his or her nuclear family.
Table 6.4. Type of household by socioeconomic group of the head of household per 100 household in each group (in per cent)
Socioeconomic group of the head of household
Head alone Couple One parent family Nuclear family Head + other relative Couple + other relative Single parent family + other relative Nuclear family + other relative Head + non related Percent of house-holds 1975 7 6 4 41 4 4 4 29 1 48 1988 10 5 4 33 7 4 4 32 1 46 Farmer 1998 7 6 5 44 5 3 4 25 … 45 1975 36 9 1 31 8 2 1 8 6 5 1988 25 6 7 26 13 2 5 10 6 5 Agricultural Salaried or Laborer
1998 31 10 2 32 6 1 2 13 3 3 1975 22 9 ... 33 7 4 1 22 2 14 1988 14 6 2 39 6 3 2 26 2 7 Unskilled Worker 1998 16 7 3 38 5 3 4 23 1 14 1975 21 6 2 25 7 4 4 29 2 13 1988 12 4 3 28 8 3 6 34 2 13 Clerical Worker or Manager
1998 13 5 2 22 8 5 9 35 1 8 1975 24 7 6 27 9 3 5 17 2 9 1988 19 5 7 28 12 2 7 16 4 14 Artisan or Petty Trader
1998 18 5 12 25 8 2 15 14 1 16 1975 30 5 5 27 6 3 2 20 2 4 1988 22 5 6 28 10 2 4 20 3 4 Employer Or Professional 1998 8 2 3 26 4 2 8 45 2 6 1975 36 3 10 11 12 1 10 11 6 6 1988 21 2 16 7 18 2 17 12 4 11 Inactive or Without Fixed income
1998 11 5 8 21 12 5 15 23 0 8
1975 16 7 4 34 6 3 4 24 2 100
1988 14 5 6 29 9 3 6 26 2 100
Total
1998 11 6 6 35 6 3 7 25 1 100
Household Structure and Socioeconomic Groups
In order to refine our analysis of the typology of households and to investigate the different types of structures by socioeconomic class, we will distinguish between seven socioeconomic groups defined in terms of the type of activity, occupation, and employment status of the head of household: independent farmers, agricultural wage earners or laborers, unskilled workers, clerical workers or managers, artisans or petty traders, employers or professionals, the economically inactive or without a fixed income.10
These groups have different weights in the population, and these weights change during the period, sometimes significantly.11 Of particular interest are:
• The attrition of the population engaged in agricultural activities, farmers as well as wage earners and unskilled laborers.
• The decrease in the number of clerical workers and managers, probably as a result of a decade of severe economic difficulties and structural adjustment. In contrast, the share of unskilled workers had regained its 1975 level in 1998, after having been cut in half in 1988, in the middle of the crisis.
• Three groups grew: employers and professionals, the inactive or without a fixed income, and most of all artisans and shopkeepers. The growth of the two latter categories is symptomatic of the changes that took place during the crisis, with the extension of the informal sector, consisting mainly of petty crafts and trade, and the increase in the number of individuals without activity or a fixed income who are no longer welcomed in the less economically destitute households. The growth of the number of employers and professionals suggests that modernization continued during the crisis, and that a modern private sector of small businesses and professionals was expanding.
Ongoing Nuclearization in Most Groups
Socioeconomic groups show clear differences with respect to the structure of their households, and particularly to the process of nuclearization.
It is possible to distinguish between:
• Strongly nuclearized groups. They are those with a majority of households based on a nuclear family, with or without other relatives. In 1998, the following groups were ranked on top: employers and professionals (71 percent); farmers (69 percent); unskilled workers (61 percent); clerical workers and managers (57 percent).
• Groups with limited nuclearization. Nuclearization concerns less than half the households of agricultural wage earners and laborers (45 percent), inactive persons and persons without a fixed income (44 percent), and artisans or petty traders (39 percent).
Unequal Importance of One-parent Family Households
The proportion of one-parent family households (with or without other relatives), linked as it is with the proportion of female heads of households, is an element that helps distinguish between groups. One-parent families were especially important in 1998 among the inactive or without a fixed
THE FAMILY AT THE HEART OF THE FAMILY
111
income, and above all among artisans and traders, where the change since 1975 is very marked. The growth of the latter category was accompanied by a change in its composition, as more women became heads of household: 15.8 percent of households in 1975 and 31.5 percent in 1998 (Appendix Table 6.A2).
The other occupational categories are less affected by this phenomenon. Note, however, that the increase in the proportion of one-parent family households is general over the period, and is particularly marked among unskilled workers because of the appearance of women in this group. Wage earning confers some autonomy on women.
Differentiation by the Presence of Other Relatives
Socioeconomic groups are also differentiated by the presence of other relatives. Two groups at the top of the socioeconomic scale, employers or professionals, and clerical workers or managers, and one group at the bottom, the inactive or without a fixed income, increasingly included other relatives; more than half of these households contained other relatives by 1998. A third of the other groups included other relatives, and the proportions have tended to decline since 1975, with the exception of agricultural wage earners and laborers, where the proportion was 22 percent in 1998.
Strong Variations in the Proportion of Single-person Households
Households consisting of isolated persons represented 11 percent of the total in 1998, but the proportion varies strongly by socioeconomic category. Such households were particularly important among agricultural wage earners or laborers, and exceeded 10 percent among most categories except employers or professionals (8 percent) and farmers (7 percent). Over the period, the proportions decreased among all groups except farmers.
Diverging Evolution of Family Structure in the Socioeconomic Groups
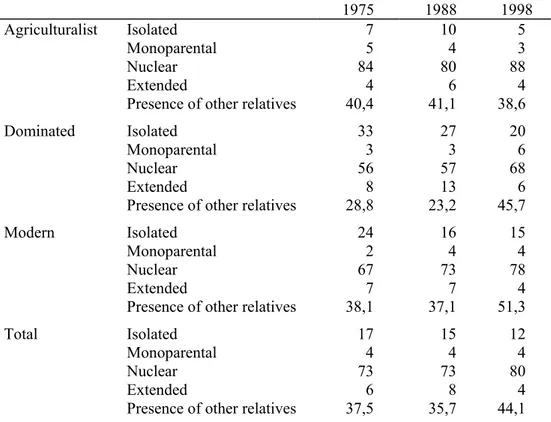
The various trends that have been described so far show that beyond the global evolution, there were diverging transformations that affected the socioeconomic groups. An overview of these transformations can be obtained by regrouping the seven socioeconomic groups in three larger categories—farmers, “dominated” categories which are characterized by having a vulnerable means of subsistence, and modern categories which enjoy social and economic stability and/or access to a modicum of social and human capital—and by regrouping the types of household into four main categories: isolated persons, one-parent, nuclear, and extended households.12
The presence of relatives other than the members of the nuclear family can also be examined. Table 6.5 includes only male-headed households, so as to eliminate the effect of different size by sex of the head.
Table 6.5. Main types of household and presence of other relatives by three socioeconomic categories of (per 100 male-headed households)
1975 1988 1998
Agriculturalist Isolated 7 10 5
Monoparental 5 4 3
Nuclear 84 80 88
Extended 4 6 4
Presence of other relatives 40,4 41,1 38,6 Dominated Isolated 33 27 20
Monoparental 3 3 6
Nuclear 56 57 68
Extended 8 13 6
Presence of other relatives 28,8 23,2 45,7
Modern Isolated 24 16 15
Monoparental 2 4 4
Nuclear 67 73 78
Extended 7 7 4
Presence of other relatives 38,1 37,1 51,3
Total Isolated 17 15 12
Monoparental 4 4 4
Nuclear 73 73 80
Extended 6 8 4
Presence of other relatives 37,5 35,7 44,1 Sources : Micro-data from the 1975 and 1988 censuses of Côte d’Ivoire and from the National Household Living Sandards Survey of 1998.
Household Structure and Its Impact on Family and Society
In a community the pattern of household structure is related to family cohesion to the extent that it determines the modalities and the degree of integration of individuals into family units. Thus, the differences in the structure of households by socioeconomic group correspond to differences in the cohesion of family and society. There are four indicators of cohesion: the proportion of persons living alone, the proportion of non-relatives in households, the proportion of relatives in households, and the ratio of the number of children living in single-parent families to the number of children living in nuclear families with both their parents (Table 6.6).
THE FAMILY AT THE HEART OF THE FAMILY
113
Table 6.6. Indicators of familial and social cohesion by socioeconomic group (in percent) Persons living alone Non related individuals Other relatives Children in nuclear households Children in one-parent households Children in one-parent households per 1000 children in nuclear ones 1975 1,1 4,2 13,7 92,8 7,2 77 1988 1,4 9,3 22,0 93,2 6,8 75 Farmer 1998 1,1 0,7 18,6 91,3 8,7 96 1975 11,3 7,1 9,7 94,2 5,8 62 1988 6,6 9,9 18,6 78,7 21,3 271 Agricultural Salaried or Laborer 1998 9,0 1,8 13,4 87,7 12,3 141 1975 5,0 4,5 14,5 98,0 2,0 21 1988 2,6 7,2 14,2 96,9 3,1 32 Unskilled Worker 1998 3,0 1,9 17,3 92,4 7,6 83 1975 3,9 6,3 20,7 92,6 7,4 80 1988 1,8 10,0 20,6 91,4 8,6 94 Clerical Worker or Manager 1998 2,1 3,4 28,2 91,3 8,7 95 1975 5,4 5,8 15,4 85,3 14,7 172 1988 3,8 9,0 19,5 83,2 16,8 202 Artisan or Petty Trader 1998 3,8 2,2 21,5 65,1 34,9 536 1975 6,1 5,9 11,2 92,9 7,1 76 1988 4,1 12,6 18,6 90,5 9,5 105 Employer Or Professional 1998 1,1 4,3 22,2 89,7 10,3 115 1975 8,7 7,7 17,4 62,6 37,4 598 1988 4,1 11,8 31,8 48,9 51,1 1043 Inactive or Without Fixed income 1998 1,8 3,0 30,0 76,3 23,7 311 1975 3,0 4,9 14,8 91,7 8,3 91 1988 2,3 9,6 21,8 88,1 11,9 135 Total 1998 2,0 1,7 20,8 86,8 13,2 152 Sources : Micro-data from the 1975 and 1988 censuses of Côte d’Ivoire and from the National Household Living Sandards Survey of 1998.
The proportion of persons living alone reflects the individualism in a given group, and provides a first index of familial and social cohesion. The proportion averaged 2 percent in 1998, and was very uneven between socioeconomic groups. It declined in all groups over the period, except among farmers, where it was very low from the start in 1975.
The proportion of individuals who are not related to the head of their household is a second indicator, and a more ambiguous one. It reflects lower social cohesion, but also a certain social
solidarity with individuals who are not part of the head’s kinship group. The proportion underwent a sharp increase in 1988, before reaching its lowest point in 1998. The differences between socioeconomic groups are not very marked, the highest proportions being reached by groups at either end of the socioeconomic ladder while the households of farmers were most often limited to relatives.
The proportion of other relatives in the household reflects the intensity of another ambivalent phenomenon in family life. It corresponds on the one hand to extended family solidarity, mostly toward lateral branches, but also toward grandchildren and parents; on the other hand, it reveals a certain fragmentation of the nuclear family, since most of these other relatives have left their own nuclear family. The share of foreign relatives has clearly increased since 1975 in all groups, but particularly in the households of the inactive or without a fixed income.
The ratio of the number of children in one-parent households to those who live in nuclear-family households reflects the impact of a breakdown of marital cohesion and, to a lesser extent, of extramarital births, on the mode of socialization of children. In 1998, for the whole population, 13.2 percent of the children were raised in one-parent family households. Thus, for every 1,000 children living in a nuclear family, 152 lived with only one of their parents, compared to 135 in 1988 and 91 in 1975. The phenomenon is gaining ground in all groups of the population, except among the inactive or without fixed revenue, where it has always been high but declined between 1988 and 1998. The increase was uneven among the groups, however, and involved more specifically agricultural wage earners and laborers, unskilled workers, and artisans and traders; 34.9 percent of the children in the last category lived in a one-parent family. The degree of marital cohesion influences the mode of socialization of children, which for 90 percent of the children in the other groups occurs in the nuclear family.
If we consider the four indicators together, then agricultural wage earners and laborers, the inactive or without a fixed income, and artisans and traders seem to constitute the groups that are most affected by the decline in familial and social cohesion. These groups also share the most precarious economic conditions, but they are also those where the heads of households, as a consequence of their sex and age, are in a demographic condition that is coterminous with a lack of structure of the family. This is the case for women heads in the group of artisans and traders or in the group of inactive or without a fixed income, as well as for young heads who are wage earners or laborers in agriculture. The demographic characteristics, economic conditions, and family status of these groups are not distinct factors.
On the contrary, familial and social cohesion is found in communities that have an adequate economic foundation, whatever the source of this adequacy—ownership of land or of means of production, a stable wage job, financial comfort, or the like—and one that remains adequate in spite of the uncertainty during crises. This is true for all the better-endowed economic groups
Factors Behind the Complexity of Households
The progress of one-parent families and of the inclusion of other relatives, the stability of nuclearization, and the decrease in the number of one-person households all made Ivoirian households more diverse, more oriented toward the family, and more complex between 1975 and
THE FAMILY AT THE HEART OF THE FAMILY
115
1998. In other words, households were based on the family more than in the recent past, but the structure of the family took diverse and often complex forms. This complexity varies mainly according to the socioeconomic group of the head of household. What are the characteristics of household heads that are associated with household complexity? Were these factors the same in 1975 and 1998? We try to answer these questions through an analysis of household type by means of a model of ordered multinomial logistic regressions, which seem to be the most appropriate for this type of analysis.13
The Variables
Household complexity, the dependent variable, is represented by five types of households, from the least to the most complex, depending on the number of relationships encountered in each type.14 The categories are as follows:15
Category 1, no kinship relation: Household head living alone or with non-related persons. Category 2, one kinship relation: Couple; one-parent family; one-parent family + other
relatives.
Category 3, two kinship relations: Couple + other relatives; one-parent family + other relatives. Category 4, two kinship relations: nuclear family.16
Category 5, three kinship relations: nuclear family + other relatives.
In the choice of independent variables, our model is constrained by the availability of the same variables at both ends of the period of observation. This compelled us not to retain ethnic group and type of residence, which were absent from one of the files. We also excluded sex from our list of explanatory variables, since female-headed households are, almost by definition, based on a one-parent family. Thus, for this initial analysis, we retained six variables: age, age squared, marital status, socioeconomic group, religion, and years of completed education (table 6.7 and table 6.8).
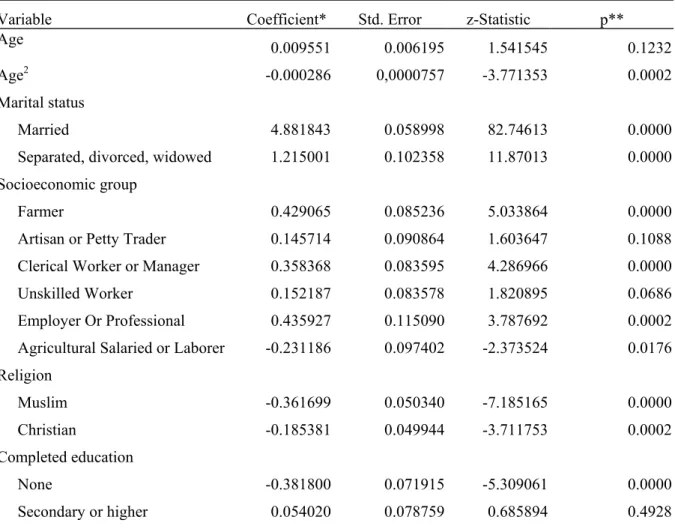
Table 6.7. Ordered multinomial logistic regression of type of household by characteristics of the head, Côte d’Ivoire 1975
Variable Coefficient* Std. Error z-Statistic p** Age 0.009551 0.006195 1.541545 0.1232
Age2 -0.000286 0,0000757 -3.771353 0.0002
Marital status
Married 4.881843 0.058998 82.74613 0.0000 Separated, divorced, widowed 1.215001 0.102358 11.87013 0.0000
Socioeconomic group
Farmer 0.429065 0.085236 5.033864 0.0000 Artisan or Petty Trader 0.145714 0.090864 1.603647 0.1088
Clerical Worker or Manager 0.358368 0.083595 4.286966 0.0000 Unskilled Worker 0.152187 0.083578 1.820895 0.0686 Employer Or Professional 0.435927 0.115090 3.787692 0.0002 Agricultural Salaried or Laborer -0.231186 0.097402 -2.373524 0.0176 Religion Muslim -0.361699 0.050340 -7.185165 0.0000 Christian -0.185381 0.049944 -3.711753 0.0002 Completed education None -0.381800 0.071915 -5.309061 0.0000 Secondary or higher 0.054020 0.078759 0.685894 0.4928 Notes: * When the coefficient > 0, the corresponding explanatory variable indicates that the individual with that characteristics is more likely to choose a complex structure of household. Conversely, when the coefficient is< 0, the corresponding explanatory variable indicates that the individual is more likely to choose a simple structure.
THE FAMILY AT THE HEART OF THE FAMILY
117
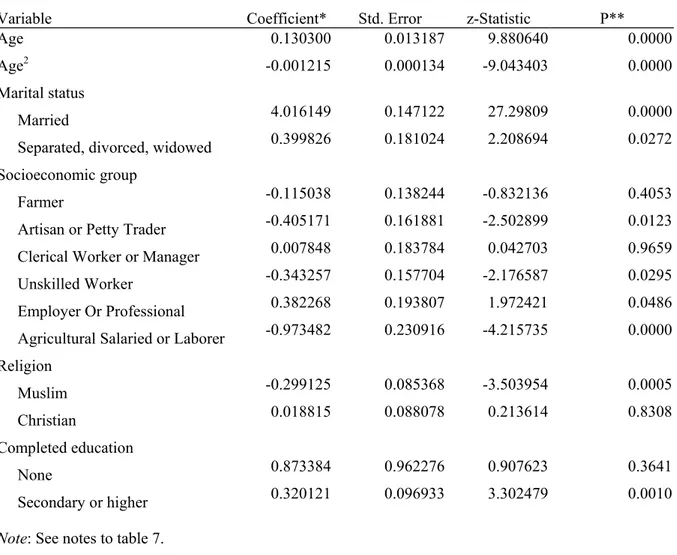
Table 6.8. Ordered multinomial logistic regression of type of household by characteristics of the head, Côte d’Ivoire 1988
Variable Coefficient* Std. Error z-Statistic P**
Age 0.130300 0.013187 9.880640 0.0000
Age2 -0.001215 0.000134 -9.043403 0.0000
Marital status
Married 4.016149 0.147122 27.29809 0.0000 Separated, divorced, widowed 0.399826 0.181024 2.208694 0.0272 Socioeconomic group
Farmer -0.115038 0.138244 -0.832136 0.4053 Artisan or Petty Trader -0.405171 0.161881 -2.502899 0.0123 Clerical Worker or Manager 0.007848 0.183784 0.042703 0.9659 Unskilled Worker -0.343257 0.157704 -2.176587 0.0295 Employer Or Professional 0.382268 0.193807 1.972421 0.0486 Agricultural Salaried or Laborer -0.973482 0.230916 -4.215735 0.0000 Religion Muslim -0.299125 0.085368 -3.503954 0.0005 Christian 0.018815 0.088078 0.213614 0.8308 Completed education None 0.873384 0.962276 0.907623 0.3641 Secondary or higher 0.320121 0.096933 3.302479 0.0010 Note: See notes to table 7.
Significance and Impact of the Chosen Variables
In 1975, most of the variables are significant, and the level of significance is low only for age, secondary or higher level of education, and the artisan/trader group. In 1998, these variables have become significant. The former two are positively related to household complexity, the latter one negatively. Farmers, clerical workers or managers, Christians, and without schooling, which were significant in 1975, cease to be so twenty-three years later. The two former ones were favorable to complex households, the two latter ones to simple households. The effect of age and age squared conform to the classical life-cycle pattern of the household. When the household is formed, its head is most often a young adult who lives alone or as member of a couple, and the degree of complexity is low. As age increases, the biological and collateral sphere broadens. At older ages, the structure
becomes simpler again, and this results in a negative effect of age squared.
Some variables are associated with complexity in 1975 as well as in 1998. These include the variables: married; separated/divorced/widowed, in relation to the increase in household complexity after marriage and after its breaking-off ; and employer/professional, representing the broadening of households in this category that enjoys a certain social and economic well-being. Conversely, other variables are associated with low complexity in 1975 as well as in 1998: age squared (see above); agricultural wage earner/laborer, whose precarious economic conditions limit the opportunity to have a complex household; and Muslim, which cannot be readily explained as the Muslims are often thought to have large households with an extended kinship group. Our model shows that these characteristics of Muslim households are not linked with religion, but with other factors.
On the other hand, it is worth nothing that the variable unskilled worker, which was favorable to household complexity in 1975, had the opposite effect in 1998. The evolution for this group may be due to the effects of the crisis. By making the situation of the wage earner more precarious, it has limited the ability of heads of household to support a large number of dependents. Alternatively, this could be the result of a change in the family model of reference for these heads of household. The changes between 1975 and 1998 could be the result of the crisis, but there is no way to settle the issue one way or the other.
Conclusion
Our analysis of the evolution of household structure from the middle of the 1970s to the end of the 1990s in Côte d’Ivoire, as recorded in three data collection operations, suggests that there is more than one principle of organization of family structure, and that the various socioeconomic groups behave differently. Various forces that bind or dissolve families, such a nuclearization, the hosting of other relatives, individualization or marital instability, are encountered within the households, and account for their particular morphology in line with the distribution of characteristics that vary by socioeconomic group. The particular mix is determined at least in part by the economic and financial ability of the groups to withstand the constraints of the crises encountered by Ivoirian society since the early 1980s, but also in part by the demographic characteristics of sex and age of the heads of household. The structure of households is a joint function of the economic and social position of their heads, but also of the stage of the life cycle in which they are located.
The groups benefiting from the best economic foundations also have the strongest family bonds. Inversely, the groups characterized by precarious economic circumstances, and that have been hit hardest by the crisis, are also most prone to the breakup of the family. For the latter groups, the relaxation of family links is a necessity rather than the choice of a social norm, and it corresponds to a structural collapse due to poverty and crisis. As such, it is very different from what the industrial countries have experienced during the 1970s and 1980s (Roussel 1986).
It appears that the populations of Côte d’Ivoire have conformed to a multiplicity of family models in shaping their dominant household structures. This diversity is not predicated on an opposition between a nuclearization of the family and its extension in the direction of the kinship group beyond the nuclear family unit, as several analyses of family models in the developing world have argued, but rather on the competition between the principles of family cohesion and marital stability on one
THE FAMILY AT THE HEART OF THE FAMILY
119
hand, and between the reality of destructuration, individualization, and marital breakdown on the other. Ivoirian families since 1975 have been characterized as much by the constant or even increasing tendency of certain groups to expand outside of the family nucleus to the larger kinship, as by an increasing frequency of single parenthood, which has been accompanied by a growing role of women in family and society, particularly in the underprivileged section of the population. These general trends, however, must not hide the progress of nuclearization by attrition of the isolated households and rejection of other relatives when a man heads the house.
The acute crisis that affected the 1988 results was accompanied by a marked increase in single parenthood and in the number of non-related persons in households. Ten years later, in 1998, the incidence of single parenthood has remained important, and it appears to have become a long-term structural phenomenon related to a change in the position of women in the economy and society and to a strengthening of their capacity for autonomy in familial and social life. On the other hand, the presence of the non- related has clearly ebbed, indicating that it was a short-term phenomenon linked to the onset of the crisis.
In summary, Côte d’Ivoire in the last twenty years has witnessed an evolution of the family model, that is of the mode of more or less stable communal living specific to economic groups. This evolution is linked to the transformations of marital and kinship solidarity. It developed under the influence of the modernization of socioeconomic structures, which continued through recession and crises. Little by little, the household models diverge by social strata. At the same time, the members of the family nucleus and, beyond them, the members of the kinship group, represent a larger share of households. More than ever, the family is at the heart of the household.
Bibliography
Antoine P. et Herry C., 1983, « Urbanisation et dimension du ménage », Cah. ORSTOM, Sér. Sci. Hum., Vol XIX, n° 3 : 295-310.
Burguière A., Klapish-Zuber C., Segalen M. et Zonabend F. (éds.), 1986, Histoire de la famille. tome II : le choc des modernités, Armand Colin, Paris, 560 p.
Chevaugeon P. et Vimard P., 1990, SANDCO, système pour l'analyse des données collectives, Logiciel et manuel d'utilisation, ORSTOM-CEPED, Paris, 107 p.
Fassassi R., 1997, « Le cycle de vie individuel au sein des ménages : différenciation selon les catégories socioprofessionnelles en Côte d’Ivoire », in Pilon M., Locoh T., Vignikin E. et Vimard P. (dir.), Ménages et familles en Afrique, Les Etudes du Ceped n° 15, Ceped-Ensea-Ins-Orstom-Urd, Paris, 1997 : 223-236.
Grimm M., Guenard C. et Mesple-Somps S., 2000, De l’évolution de la pauvreté urbaine en Côte d’Ivoire. Une analyse sur 15 ans d’enquêtes ménages, communication aux Journées d’Économie du Développement, « Distribution des revenus, pauvreté, bien-être », 26-27 octobre 2000, Paris, 30 p. Jarret M.-F. et Mahieu F. R., 1991, « Ajustement structurel en Côte-d'Ivoire », Revue Tiers-Monde, t. XXXII,
n° 125 : 39-62.
Locoh T., 1988, « L'évolution de la famille en Afrique », in Etat de la démographie africaine, UIESP, Liège : 45-66.
Parsons T., 1955, « The kinship system of the contemporary United States », in Bourricaud F. (éd.), Eléments pour une sociologie de l'action, Paris, Plon.
Recensement général de la population et de l'habitat de 1998, Analyse des résultats, Volume IV, tome 12 : Caractéristiques des ménages et condition de vie des populations, Document de travail, diffusion restreinte, 25 p.
Roussel L., 1986, Evolution récente de la structure des ménages dans quelques pays industriels, Population, 41, 6 : 913-933.
Shorter E., 1977, Naissance de la famille moderne, Paris, Seuil, 379 p.
Talnan E, 2001, Mutations sociales, crise économique et évolution du modèle de reproduction en Côte d’Ivoire, communication à l’atelier de l’Unité de recherche « Santé de la reproduction, fécondité et développement », 24-26 octobre 2001, IRD, Paris, 21 p.
Tapinos Georges Photios, Hugon Philippe et Vimard Patrice (direction), La Côte d’Ivoire à l’aube du XXIe
siècle, Collection Hommes et Sociétés, Paris, Karthala, 2002, 497 p.
Vidal C. et Le Pape M., 1986, Pratiques de crise et conditions sociales à Abidjan (1979-1985), ORSTOM-CNRS, Abidjan, 102 p.
Vimard P., 1987, Diversité des structures familiales en Côte d'Ivoire, une approche à partir d'études de cas en milieu rural akan, ORSTOM, Abidjan, 22 p.
Vimard P. et N'Cho S., 1988, « Les noyaux familiaux en Côte d'Ivoire, structures et probabilités de transition », in Congrès Africain de Population, Dakar, UIESP, Liège, vol. 2 : 1988 : 5.2.59-75.
Vimard P. et N'Cho S., 1993, Conséquences sociales de la structure des ménages selon les groupes socioéconomiques en Côte d'Ivoire, Communication au XXIIe Congrès Général de la Population, UIESP, Montréal, 1993, 13 p.
Vimard P., 1993, « Modernité et pluralités familiales en Afrique de l'Ouest », Revue Tiers Monde, t. XXXIV, n° 133, janvier-mars 1993 : 89-115.
Vimard P. et N'Cho S., 1997, « Évolution de la structure des ménages et différenciation des modèles familiaux en Côte-d'Ivoire 1975-1993 », in Pilon M., Locoh T., Vignikin E. et Vimard P. (dir.), Ménages et familles en Afrique, Les Etudes du Ceped n° 15, Ceped-Ensea-Ins-Orstom-Urd, Paris, 1997 : 101-123. Vimard P., 1997, Transitions démographique et familiale. Des théories de la modernisation aux modèles
de crise, Documents de recherche de l‘ETS n° 3, ORSTOM, Paris, 31 p.
THE FAMILY AT THE HEART OF THE FAMILY
121 Appendix The Ordered Multinomial Logistic Regression
The multinomial logistic model analyzes decisions concerning multiple choices, Y, that can be ordered. These choices are made by the individual i with multidimensional characteristics Xi. In this
model, choices Yi (where Yi goes from 0 to m) are related to a non-observable variable Yi*, which is
linearly related to Xi:
Yi* = bXi + u,
where b is a vector of parameters bj and u is a random vector of components that follow a logistic
law. The value assumed by the random variable Yi* determines Yi according to the following rule: Yi = j when, and only when, cj < Y* < cj+1.
The values cj are limits determining the thresholds of change of choice. The regression estimates
parameters bj and cj. The sign of the coefficient bj gives the direction of the probability that the
choice will be made in the extreme categories. For bj > 0, the corresponding explanatory variable
indicates that the individual is more likely to choose Yi = m (and therefore less likely to choose Yi =
0). When bi < 0, however, the corresponding explanatory variable indicates that the individual is
more likely to choose the smallest value of Yi (and therefore less likely to choose the largest value of Yi.).
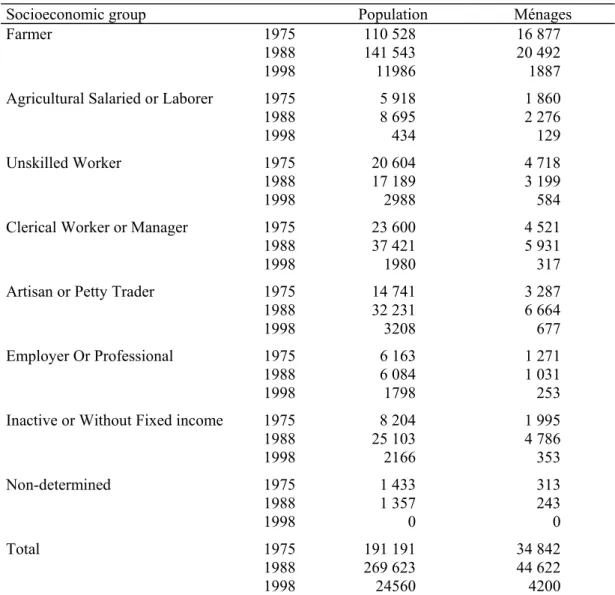
Table 6.A1. Size of the population and number of households in the samples by socioeconomic group
Socioeconomic group Population Ménages
Farmer 1975 110 528 16 877
1988 141 543 20 492
1998 11986 1887
Agricultural Salaried or Laborer 1975 5 918 1 860
1988 8 695 2 276
1998 434 129
Unskilled Worker 1975 20 604 4 718
1988 17 189 3 199
1998 2988 584
Clerical Worker or Manager 1975 23 600 4 521
1988 37 421 5 931
1998 1980 317
Artisan or Petty Trader 1975 14 741 3 287
1988 32 231 6 664
1998 3208 677
Employer Or Professional 1975 6 163 1 271
1988 6 084 1 031
1998 1798 253
Inactive or Without Fixed income 1975 8 204 1 995
1988 25 103 4 786 1998 2166 353 Non-determined 1975 1 433 313 1988 1 357 243 1998 0 0 Total 1975 191 191 34 842 1988 269 623 44 622 1998 24560 4200
Sources : Micro-data from the 1975 and 1988 censuses of Côte d’Ivoire and from the National Household Living Sandards Survey of 1998.
THE FAMILY AT THE HEART OF THE FAMILY
123
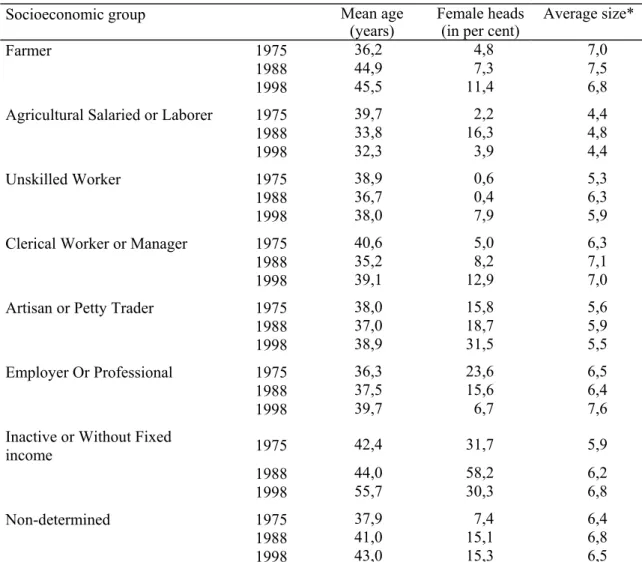
Table 6.A2. Mean age of heads of household, proportion of female heads and average size of household by socioeconomic group
Socioeconomic group Mean age
(years) Female heads (in per cent) Average size*
Farmer 1975 36,2 4,8 7,0
1988 44,9 7,3 7,5
1998 45,5 11,4 6,8
Agricultural Salaried or Laborer 1975 39,7 2,2 4,4
1988 33,8 16,3 4,8
1998 32,3 3,9 4,4
Unskilled Worker 1975 38,9 0,6 5,3
1988 36,7 0,4 6,3
1998 38,0 7,9 5,9
Clerical Worker or Manager 1975 40,6 5,0 6,3
1988 35,2 8,2 7,1
1998 39,1 12,9 7,0
Artisan or Petty Trader 1975 38,0 15,8 5,6
1988 37,0 18,7 5,9
1998 38,9 31,5 5,5
Employer Or Professional 1975 36,3 23,6 6,5
1988 37,5 15,6 6,4
1998 39,7 6,7 7,6
Inactive or Without Fixed
income 1975 42,4 31,7 5,9 1988 44,0 58,2 6,2 1998 55,7 30,3 6,8 Non-determined 1975 37,9 7,4 6,4 1988 41,0 15,1 6,8 1998 43,0 15,3 6,5
Sources : Micro-data from the 1975 and 1988 censuses of Côte d’Ivoire and from the National Household Living Sandards Survey of 1998.
Notes
1. On transformations of the family in developing countries, see the articles on Latin America, sub-Saharan Africa, the Arab world, and Asia in Burguière et al. (1986).
2. In this chapter, a nuclear family consists of a couple with or without children. Nuclearization is the tendency for the population to live increasingly in households consisting of such a nuclear family, whereas denuclearization would be characterized by a larger proportion of one-parent or single-person households.
3. The two censuses use the same definition based on de jure residence, whereas the survey definition introduces a criterion of duration. In 1975 and 1988, the household was defined as “the group of persons, whether related or not, who acknowledge one individual entitled ‘head of household,’ and who hold part of their resources in common. They live in the same building.” In 1998, however, the household was defined as “a group of persons who sleep usually in the same dwelling and who have shared their meals for at least three months during the 12 months that preceded the interview.” 4. The household files were created with the SANDCO program (Chevaugeon and Vimard 1990). Table 6.A1 in the Appendix gives the size of the population and the number of households by socioeconomic groups at the three dates.
5. The proportion of female heads of household in the survey of living standards is very close to that computed from the census data for the same year: 16 percent (Côte d’Ivoire n.d., 23).
6. The size reported in the survey on levels of living—5.79—was very close to that calculated on the basis of the census taken in the same year (Côte d’Ivoire n.d., 17).
7. In 1998, even more clearly than in 1975 or 1988, female heads of household were older than male heads (46.2 years versus 42.4) and had been responsible for the household for a shorter time, having reached headship at an older age than the men (Fassassi 1997).
8. The “other relatives” include ascending and lateral relatives, grandchildren, and individuals allied by marriage to the head of household.
9. The last type, “head of household + non-related,” is the only one for which the presence of non-related individuals is taken into consideration.
10. Farmers are self-employed agricultural workers. Agricultural wage earners and laborers include salaried workers of agro-industrial complexes and laborers earning wages or paid by the piece on village farms; their common trait is that they do not own the land on which they work. The “inactive or without fixed income” category includes individuals who are not currently in the labor force (students, unemployed, retired, and the like) and unpaid workers (for example, housewives, growers of food crops for home consumption, family workers, apprentices).
11. A summary table, 6.A2, in the Appendix gives the numbers of individuals and households for each socioeconomic group. Because the number of heads of household whose activity is unknown is not significant, the make-up of households in that category has not been presented in the text.
12. Farmers are only independent agriculturalists. The “dominated” include agricultural wage workers and laborers, artisans and petty traders, and the inactive or without fixed income. The modern category includes the other groups. The “isolated” type includes heads of household living alone or with non-relatives; the “one-parent” and “nuclear” types regroup the households of those types with and without non-relatives; the “extended” type includes all heads of households living with other relatives.
13. See the Appendix for a presentation of ordered multinomial logistic regressions.
14. Three kinship relationships are distinguished: between spouses, between parents and children, and between the head of household and another relative.
15. The classification was validated a posteriori as the values of the thresholds were all significantly different in 1975 as well as in 1998.
16. A distinction is made between categories 3 and 4, even though the number of kinship relationships is the same, because the nuclear family appears to be closest to the norm.