HAL Id: hal-01934897
https://hal.inria.fr/hal-01934897
Submitted on 26 Nov 2018
HAL is a multi-disciplinary open access
archive for the deposit and dissemination of
sci-entific research documents, whether they are
pub-lished or not. The documents may come from
teaching and research institutions in France or
abroad, or from public or private research centers.
L’archive ouverte pluridisciplinaire HAL, est
destinée au dépôt et à la diffusion de documents
scientifiques de niveau recherche, publiés ou non,
émanant des établissements d’enseignement et de
recherche français ou étrangers, des laboratoires
publics ou privés.
Personalizing Actions in Context for Risk Management
using Semantic Web Technologies
Jiewen Wu, Freddy Lecue, Christophe Guéret, Jer Hayes, Sara van de
Moosdijk, Gemma Gallagher, Peter Mccanney, Eugene Eichelberger
To cite this version:
Jiewen Wu, Freddy Lecue, Christophe Guéret, Jer Hayes, Sara van de Moosdijk, et al.. Personalizing
Actions in Context for Risk Management using Semantic Web Technologies. International Semantic
Web Conference, Oct 2017, Vienna, Austria. �hal-01934897�
Personalizing Actions in Context for Risk
Management using Semantic Web Technologies
Jiewen Wu1, Freddy L´ecu´e1,4, Christophe Gueret1, Jer Hayes1, Sara van de
Moosdijk1, and Gemma Gallagher3, Peter McCanney2, Eugene Eichelberger2
1 Accenture Labs, Ireland 2
Accenture The Dock, Ireland
3 FJORD, Ireland 4
INRIA, France
Abstract. The process of managing risks of client contracts is manual and resource-consuming, particularly so for Fortune 500 companies. As an example, Accenture assesses the risk of eighty thousand contracts ev-ery year. For each contract, different types of data will be consolidated from many sources and used to compute its risk tier. For high-risk tier contracts, a Quality Assurance Director (QAD) is assigned to mitigate or even prevent the risk. The QAD gathers and selects the recommended actions during regular portfolio review meetings to enable leadership to take the appropriate actions. In this paper, we propose to automatically personalize and contextualize actions to improve the efficacy. Our ap-proach integrates enterprise and external data into a knowledge graph and interprets actions based on QADs’ profiles through semantic reason-ing over this knowledge graph. User studies showed that QADs could efficiently select actions that better mitigate the risk than the existing approach.
1
Introduction and Related Work
Risk is pervasive in every complex business, and businesses must manage risks in the sense that after identifying and externalizing risks they should take appro-priate actions to mitigate risks, rather than eliminating risks [1]. Such practices are essential for large enterprises because of the promised quality outcomes to be delivered to clients, stakeholder or collaborators. With proper risk management, businesses can improve predictability of financial variance [2], be more flexible [3], enhance their competitiveness in the market, and develop growth through increased client satisfaction [4] by delivering what is promised and beyond.
Project risk management has been studied for more than half a century with a different focus e.g., risk identification, estimation, response and monitoring and control [5]. Various approaches have been suggested to address such prob-lems with more and more roots in Artificial Intelligence and Machine Learning given the recent access to large amount of digitalized projects monitoring data. For instance risks of software-related projects can be predicted using ensemble learning of Artificial Neural Networks and Support Vector Machine [6]. Other
approaches such as [7] presented a framework based on a risk ontology to mon-itor and identify risks through the project life cycle. Most of the work has been focusing on risk prediction and monitoring and less on mitigation, although miti-gation processes have been largely curated by in-house quality assurance experts of most companies to limit revenue loss. Indeed mitigation actions are usually discussed among senior experts, and often subject to non consensus given the complex nature of contracts, and their complex environments and contexts e.g., contract type, industry group, geography delivery centre, client lead among oth-ers. In this respect the identification of relevant and impactful actions for the right contracts is a challenging task.
In Accenture an Intelligent Risk Management tool (IRM) has been devel-oped to provide leadership with a holistic view of project risks. The tool con-solidates data from multiple systems and predicts the risk tier of ongoing Ac-centure projects. Based on the computed risk tier, a project will be assigned a corresponding Quality Assurance Director (QAD), who oversees the project to identify and mitigate its risk(s). The sources of the risk can be manifold, such as the dependencies of the clients, the terms and conditions stipulated in the contract, or the capability of the company to staff the project with the right people, among others. Once the risk is identified for a contract, the task of the risk management team is to determine what is actionable, in other words which parameters can be controlled to reach positive outcome. In general, a QAD works with the project team (and leadership team if necessary) to determine the right actions that need to be taken to mitigate the risk. These actions, usually spe-cific to the project, are documented in meeting minutes during portfolio review meetings.
The purpose of risk management is to mitigate risk and recover the losses as much as possible and in the most efficient way. One critical responsibility of QADs is to ensure the actions proposed by project personnel and leadership team are well understood and executed, as they might have very negative outcome if wrongly applied. Documented in meeting minutes, actions need to be reviewed and well understood by QADs before they can be executed. On average, a QAD can be assigned to oversee a few dozen contracts, each of which has a number of tasks that demand different levels of attention according to the risk tier of the contract. To help our 3, 000+ QADs streamline this process, we designed a solution that customizes the actions recommended for the contracts based on the context the actions were proposed in, with the aid of semantic technologies from both an integration and reasoning perspective. QADs are empowered to explore actions in relevant context more quickly and to prioritize actions more confidently.
1.1 Motivation
The process of monitoring review meetings and tracking actions is laborious, in particular for QADs who are newly assigned to oversee the contracts. With the popular adoption of Artificial Intelligence practices in enterprises, Accenture has been phasing in machine learning to aid in its business processes, among which
is risk management. Once a contract has been identified to have above normal risk, an action recommender automatically proposes a list of actions based on past five years’ records, which would have required numerous portfolio review meetings involving various resources without the recommender.
Some challenges that QADs face in this process, with or without the aid of an action recommender, have been identified: (1) A QAD needs an efficient way to read the relevant meeting documents, e.g., to identify the list of actions when no recommender is used, or to understand the context of these actions. (2) QADs who are new to a contract or business may have difficulty in understanding the terms used in actions. They want to understand the actions and associated context accurately and effectively. For QADs, the purpose of reviewing actions is to ensure a correct understanding of the actions in context and prioritize the actions to be taken, e.g., actions that demand immediate attentions or that have a greater impact on the outcome. To help our leadership team manage risk-mitigation actions more efficaciously, we build a solution, deployed at validated by Accenture risk officer, to improve the understanding of actions, which in turn leads to better prioritization of actions for execution.
1.2 Problem Statement
To ensure a quicker and effective understanding of the actions, we find the fol-lowing tends to help our users: (1) salient terms are highlighted, especially if the descriptions of actions are lengthy, and (2) terms are put into context, prefer-ably customized for each individual user, so that confusion is minimized and minimum efforts are required from QADs to read relevant passages in meeting minutes. Personalization is important to our users due to the various levels of background knowledge they possess about actions in different contracts. To help readers understand our approach, Example 1 shows a typical action documented in a review meeting.
Example 1 (Actions). Action 1 reads Meet with John Doe re the role require-ments that the team has identified and notify the group when the next MLR should be scheduled. Action 2 reads Adjust time and material for delivery center in Chicago. Without proper context, a QAD may, for instance, have difficulty in understanding the specific employee John Doe or the term MLR mentioned in the action.
Formally, the problem to be dealt with in this paper is stated as follows. Let a term T be a sequence of (at least one) words. An action, denoted A, is a sequence of n terms (n ≥ 1). A user (a QAD in our business case) is denoted U, and her profile is encoded in a knowledge base (a.k.a. ontology) K. Without loss of generality, we can assume all facts in K are represented by triples hs, p, oi. Given an action A = (T1, . . . , Tn), the problem is to generate a personalized
action for U: A = Aa∪ Aesuch that:
– Aa = (T1, . . . , Tm), where m ≤ n, represents the key terms that carry the
– Ae= (G1, . . . , Gm), where Gi⊆ K,1 ≤ i ≤ m. The context of each key term is
represented separately by a graph consisting of a set of semantic entities and binary relations between entities, all associated with the given knowledge bases. Note that a graph can be empty, in which case there is no additional context available for the corresponding term.
– A is sufficiently small in size for users to understand the action A.
Our solution aims to provide proper context of each action so that a user can easily understand the actions and better prioritize the actions to be executed.
The paper is organized as follows: Section 2 gives an overview of the system architecture, as well as high level descriptions of the miscellaneous data sources and the applications. Following the system description, Section 3 details the three applications as a pipeline that ingests user profiles and raw actions to generate personalized action context. An empirical evaluation is provided in Section 4 to validate the efficacy of the system, which also includes a discussion on the learned lessons. Section 5 summarizes the paper and presents some extensions that we plan to build on the existing solution.
2
System Architecture
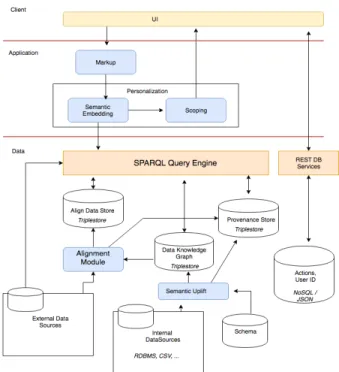
Figure 2 depicts the architecture of the solution we built to contextualize ac-tions. Below is a detailed, bottom-up description of the architecture, in which Section 2.1 gives an overview of the data sources. Section 2.2 describes the func-tionality of system applications, and Section 2.3 describes the data flow and how users interact with the system.
2.1 Data Sources and Integration
Enterprise data provides information on the business context, for instance, ac-tions usually mention specific business entities, Accenture acronyms, or employ-ees names. Most internal datasets we used are structured, while some of them are unstructured, such as the dataset for actions, which is a set of meeting minutes notes. External data includes some standard RDF datasets, namely, DBpedia and Wikidata.
Accenture Business Schema describes the organization structure of Accen-ture and attributes of several types of objects, such as employees information, contracts, among others.
Accenture Data Lake is the internal Accenture data lake that serves as a hub for accessing key business data sourced from a variety of systems, rang-ing from SAP to MS SQL Server to documents. We have access to data about human resources (e.g., employees), financial outcomes (e.g., contract economics), and risk assessment (e.g., review meeting minutes and notes). When both internal and external datasets are identified, we need to align their entities so semantic contextualization becomes possible on enterprise data e.g., actions. The first step is to uplift internal data into semantic knowledge,
Fig. 1. The Architecture
which leads to an enterprise Knowledge Graph (KG) that captures the semantic information of relevant enterprise data. The next step is to align the enterprise KG with external data sources.
Semantic Uplift The relational data and unstructured data used in the system is converted explicitly into RDF triples5, with the latter given as the file paths referencing the actual unstructured content.
Alignment leverages both syntactic keyword searches and SPARQL queries and it enables us to interface the enterprise data with the external linked dataset via a uniform query engine.
Provenance Store records two types of data: (1) the source graph of RDF statements and (2) the source application or data unit of the resulting state-ments. The former is used to differentiate different types of application data, for instance, the user profile of a given user has to be separated from the ac-tions’ data during personalization. The latter is for end users to understand the details of computation. In our business environment, it is important to keep track of data flow in any process. In addition to compliance and regu-lation requirements due to data confidences, a more compelling reason is to help users make more informed decisions. In the task of risk management,
5
our business users, e.g., QADs, want to understand how the resulting action context is generated so they can be more confident when making decisions. We use the ontology PROV-O6 to describe the provenance at the level of
datasets. For instance to keep track of the process integrating a given CSV file into the knowledge graph.
2.2 Application Layer
The application layer is made of 3 components linked in a linear pipeline. Their objective is to enrich an action with the semantic context relevant for the user currently looking at this action. Those three components are referred to as “Markup”, “Semantic Embedding” and “Scoping” after the main role they fulfill. Markup extracts a set of important complex terms from an action. The imple-mentation is chosen to be parameterizable in order to return sets of different sizes depending on user profiles. The output is forwarded into the next com-ponent “Semantic Embedding”;
Semantic Embedding aims at associating to an entity each of the complex terms marked up in the action. In addition to the relevant entity the immedi-ate context of this entity, that is all the other entities it is directly connected to, is also retrieved. The component further taps into the data store con-taining the provenance data in order to make this information available to the next component (“Scoping”). Finally, the graph describing the user cur-rently using the system is also retrieved. This combined large graph (entities + embedding entities + provenance + profile) is passed as NQuads to the next component in the pipeline for scoping;
Scoping the large graph resulting from the embedding is important in order to avoid an information overload. Any given user need to be presented with the only data (s)he needs to understand a particular action, no more no less, as stated in the problem definition on the size of A in Section 1.2. The graph thus needs to be scoped to remove superfluous nodes and edges. The outcome of this process is sent back to the user interface for rendering.
2.3 Application, Data, and User Interfacing
The data layer provides a uniform access interface through SPARQL query en-gine (i.e., StarDog7 in our implementation). As can be seen from Figure 2,
ap-plications can query external KGs directly, or a combination of alignment data, provenance data, with enterprise and external KGs when needed (e.g., for se-mantic embedding). To our end users (QADs), the interaction with the system applications is a series of steps.
User Login and Contract Selection A QAD must be logged onto the sys-tem to see the assigned portfolio of contracts. She can then select a particular
6
https://www.w3.org/TR/prov-o/, last accessed 15 May 2017
7
contract for review. To this end, two types of data items have been requested by the User Interface through some REST services: the user’s unique iden-tifier and, with the newly introduced action recommender, an automatically populated list of recommended actions if the contract is considered to be risky.
Application Processing Once the input is identified, appropriate applications will be triggered, with access to the relevant data via the query engine. Any action in the recommended list will go through the full computation cycle in order: markup, semantic embedding, and scoping. An action, as defined in Section 1.2, is simply a list of complex terms. After processing, it will be enriched with proper context in the form of knowledge graphs (triples). Output Rendering The final output consists of 2 parts: one is the
personal-ized context of this action, while the other is the provenance information associated with the computation, which users can choose to be presented.
3
Semantic Approach towards Project Risk Management
This section describes the techniques of the three applications given in Figure 2.
3.1 Markup
The markup functionality is leveraging [8] to identify the most important terms in any action. To this end [8] retrieves the key terms of an action that make this action in a particular class: documentation, financial, resources, capability, delivery, meeting, contract.
Example 2 (Markups of Actions). Consider the actions in Example 1. Action 1 has been marked with two key terms: “John Doe” and “MLR”, while Action 2 has also two term highlighted: “time and material ”, “delivery center in Chicago”.
3.2 Semantic Embedding
The objective of Semantic Embedding functionality is to embed the action into its global, semantically rich, context. This context is defined by the set of complex terms associated to the action (computed from the Markup functionality) and the concepts from the knowledge graph K they relate to. To this end we start by extracting some key terms (T1, . . . , Tm) from the textual description of the
action using both part-of-speech (POS) tagging and named entity recognition (NER). For each key term, a matching for some concept, as well as the triples that have this concept as a topic, is performed in the given K .
Once the extracted terms are mapped into concepts in the knowledge graph, an additional step is to obtain more relevant concepts through graph traversal. For example, in Example 2, the two concepts Delivery Centre and Chicago ini-tially extracted from Action 2’s text Delivery Centre in Chicago will get replaced by the concept Delivery Centre in Chicago, which is defined to be related to both Delivery Centre and Chicago.
Example 3 (Semantic Embedding of Actions). Consider the actions in Exam-ple 2. Semantic embedding matches key terms with these entities:
Action 1: http://accenture.com/people/irm#john.doe http://accenture.com/irm#ManagementLevelReview Action 2: http://accenture.com/irm#TimeAndMaterial
http://accenture.com/irm#DeliveryCenterChicago. Additional concepts within certain distances of the key terms in the KG are also obtained, which result in more statements. Some sample statements are given below, where entities are denoted by local names instead of URIs for readability (the Accenture name spaces are omitted).
Action 1 has part of its context being:
hjohn.doe, gender, malei, hjohn.doe, hireDate, “2009.04.19”i, hjohn.doe, hasSkill, M DM i, hM DM, a, SAP Skillsi, hjohn.doe, hasSupervisor, jane.roei,
hM anagementLevelReview, a, AccentureP rojectReviewi. Action 2 has part of its context being:
hDeliveryCenterChicago, inCity, wikidata : Q1297i, hDeliveryCenterChicago, a, DeliveryCenteri, hwikidata : Q1297, a, wikidata : Q515i,
hT imeAndM aterial, partOf, T imei, hT imeAndM aterial, partOf, M ateriali.
3.3 Scoping
After semantic embedding, the context of an action consists of user-specific con-text, enterprise concon-text, as well as general knowledge. This also means the gen-erated context is potentially large, which may overload the users with excessive contextual information. To this end, we developed an algorithm to reduce the contextual information (represented as a knowledge graph w.l.o.g.) based on the user-specific context. Algorithm 1 shows how a given user profile is used to scope the action context (in the form of triples). Given a user profile Gu, Algorithm 1
decides if a statement from an action context can be filtered. We first collect all the entities that are known to the user on lines 1-2. On line 3, the subject s of the contextual statement is tested: if it is a known entity to the user, the algorithm considers if the statement is a description of some attribute of s (line 4), if the predicate or object is a known entity in general (the set StandardV ocab denotes the set of entities defined in standard vocabularies such as RDF/S, OWL, SKOS, among others. An example of generally known entity is skos:Concept.), or if both the object and the predicate are also known to the user (line 6).
Input : hs, p, oi, Gu Output: true/false 1 U C ← {s0| hs0 , p0, o0i ∈ Gu} ∪ {o0| hs0, p0, o0i ∈ Gu} ; 2 U P ← {p0| hs0, p0, o0i ∈ Gu}}; 3 if s ∈ U C then
4 if o ∈ Literal then return true;
5 if {p, o} ∩ StandardVocab 6= ∅ then return true;
6 if o ∈ U C and (p ∈ U P or p ∈ StandardVocab) then return true;
7 end
8 if s ∈ StandardVocab then return true; 9 return false;
Algorithm 1: Statement Test
Example 4 (Scoping of Actions Context). Continue the examples given in Ex-ample 3. Assume a QAD, user1, logs onto the system and scoping takes place
by looking at the user context of user1, with a small part shown below:
huser1, knows, john.doei, huser1, hasSkill, SAP N etW eaveri,
hSAP N etW eaver, owl:sameAs, M DM i.
Finally, scoping reduces Action 1 context to the following: hjohn.doe, hasSupervisor, jane.roei,
hM anagementLevelReview, a, AccentureP rojectReviewi.
For Action 2, the user context does not reduce the action context due to lim-ited user context on the key terms such as TimeAndMaterial. Thus, Action 2’s context remains the same.
4
Validation
We discuss our asset in use by senior Accenture QADs. We review the main functionality exposing contexts of actions for risk management mitigation (Sec-tion 4.1). Then, we present an end-user valida(Sec-tion on the fit-for-purpose of the contextualization asset (Section 4.2). Section 4.3 evaluates the scalability of com-ponents involved in our main architecture (Figure 1). Finally, we review lessons learnt from the deployment of the asset in an industrial context (Section 4.4).
4.1 Actions in Context Asset
• Broader Asset: Figure 2 presents the Intelligent Risk Management (IRM) asset (and its 5 main functionalities) we deployed at Accenture. It represents the general user interface, in which our “action in context ” asset has been integrated, tested and validated by QADs. A QAD connects to the IRM tool on a daily basis to assess a portfolio of projects that she is responsible for. She aimed at
evaluating the level of risk predicted by the system (details of the prediction component is beyond the scope of this paper), investigating the root causes of the risk tiers, potentially requesting support from other QADs, exploring inconsistencies in the project and finally selecting relevant actions to be applied for mitigating financial risks, and limiting any revenue loss. The remaining part of this section emphasises on the latter functionality, captured in 7 through “Action Explanations” of Figure 2. This particular component is selected when the project is at high risk (cf. upper part of risk scale 2 in Figure 2).
Fig. 2. fig:IRM-Action fig:IRM IRM - Intelligent Risk Management - Asset. 1 : Project (represented as a yellow circle) selected (the larger the bubble the greater the target revenue). 2 : Risk scale of the project (the higher the circle / project the riskier). 3 : Summary of project details with expected revenue and risk tier. 4 : Functionality for explaining risk tier prediction. 5 : Functionality for recommending additional QADs for this particular project. 6 : Functionality for recommending actions to QAD. :7 Functionality for explaining the context of actions to QAD (focus of the paper). :8 Functionality for flagging inconsistencies in projects (color print).
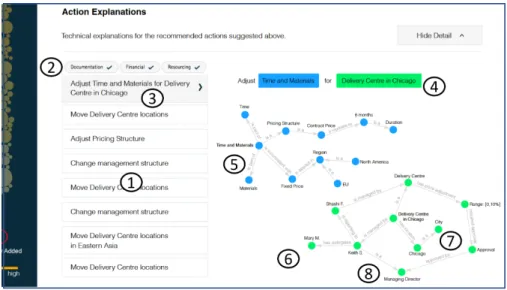
• “Action in Context” Asset: Figure 3 provides a detailed description of functionality 7 of Figure 2. QADs are shown a list of potential actions in 1 of Figure 3 which have been applied to projects with similar risk tier, and un-der similar conditions (industry e.g., resources, client classification e.g., diamond client). Each action is represented by its category 2 e.g., Documentation, Finan-cial and Resourcing for general context, and its intent 3 e.g., “Adjust Time and
Material for Delivery Centre in Chicago”. The DBpedia and wikidata vocabu-laries have been used for cross-referencing categories using syntactic mapping e.g., http://dbpedia.org/resource/Category:Finance for financial. Each action is broken-down in important complex terms (as opposed to entities) in Figure 4 e.g., “Time and Material ” and “Delivery Centre in Chicago” for action in 3 . Then a graph, capturing the context and provenance of each important complex term, is displayed for action contextualization (cf. Figure 4 for zoomed-in ver-sion of graphs 5 - 8 in Figure 3). For instance the “Pricing structure” of selected project is “Time and Materials” 5 , which is inconsistent with “Fixed Price”, and “Contract Price” can be adjusted for a short “Duration” of “6 months”. Some similar contexts are retrieved for complex term “Delivery Centre in Chicago”
6
. 7 connects our enterprise knowledge graph with external resources such as SKOS, DBpedia, and Wikidata concepts. Item 8 provides context using our enterprise knowledge graph, for instance
– http://accenture.com/labs/people/irm#Person for Person or
– http://accenture.com/labs/people/irm#PCrossWorkForceCareerLevel for ca-reer level.
A sample of our enterprise knowledge graph is available8. The latter context
is crucial for QAD to understand how the action can be applied, and more importantly what is the rational of the context. In addition the context brings general information which is somehow discarded from initial information by the traditional approach e.g., Chicago is a city in North America region. This has been possible only because we initially mapped the enterprise data with external vocabularies such as DBpedia and wikidata.
4.2 Experimental Results: User Satisfaction
The evaluation of personalization and contextualization systems remains a chal-lenge due to the lack of understanding of what factors affect user satisfaction [9]. Towards this issue, the applicability and usability of our approach has been tested in real world scenarios with users. In particular we evaluate the relevance and usefulness of the context of action selection.
• Users: To test the proposed approach, we have conducted a focus group study with 20 senior QADs at Accenture, aiming to explore the degree to which they understand, accept, and make use of the provided context for deciding on which actions to recommend. We split directors among 4 groups depending on their level of experience with the QAD role: (G1) [0-3) months, (G2) [3-6) months, (G3) [6,12) months and (G4) over 12 months of experience.
• Tasks: The participants were asked to interact with the action explanation component (Figure 3) of the Integrated Risk Management tool (Figure 2) to select action to be escalated for execution. First of all they have been requested to select actions using the traditional approach i.e., neither semantic uplift of
8
Fig. 3. “Action in Context” Functionality of IRM Asset. 1 : List of recommended ac-tions. 2 : Categories of actions. 3 : Action: “Adjust Time and Material for Delivery Center in Chicago” selected by QAD. 4 : Breakdown of terms uplifted by our semantic embedding approach. 5 : Contextualization of term: “Time and Material”. 6 : Con-textualization of term: “Delivery Centre in Chicago”. 7 : Knowledge context of city Chicago captured from external sources: SKOS concept, DBpedia city, wikidata Q515.
8
: Knowledge context of person Keith S. captured from internal enterprise knowledge graph: Work Force Career Level Managing Director, Delegates. (color print).
actions nor context. Then they were asked to interact with our semantic-based model. Finally they were asked to rate the perceived usability of both approaches i.e., without and with semantic context and answer three open-ended questions: (1) the merits of contextualisation, (2) problems arising from contextualisation, and (3) possible ways to overcome these issues.
• Results: Selection of actions using the traditional approach has been a very difficult task to achieve by most of the least experienced participants (i.e., 77% for G1 and G2). 63% of the most experienced directors identify this particular task as difficult. Overall, our users’ interest in contextualization and personal-ization (using semantics) is rooted in the hope that it will empower them to perform tasks more effectively, save time, and expose details according to their own needs and experience.
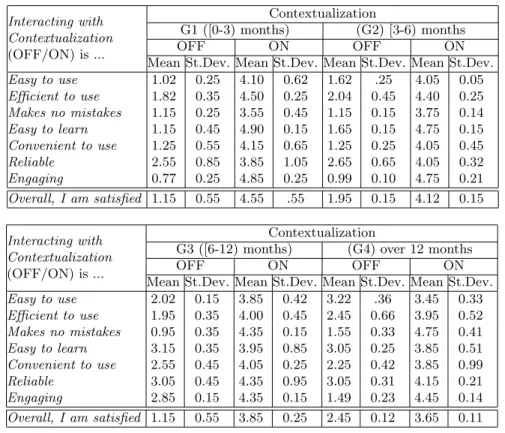
Table 1 shows that all groups of users were highly satisfied with the approach (an average rating 4.04 on a 5-point Likert scale where 1=disagree and 5=agree) and also demonstrates benefits against an approach without contextualization activated: Overall, Convenient to use and Engaging. Although all groups consider contextualization to be engaging, the less experienced is the director the more useful is the contextualization for their day to day work (G1: 4.55, G2: 4.12, G3: 3.85, G4: 3.65).
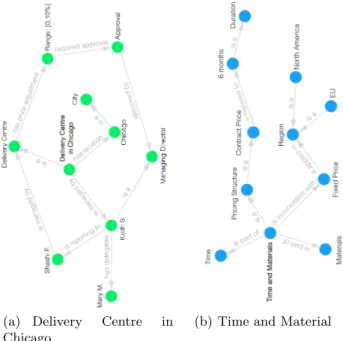
(a) Delivery Centre in Chicago
(b) Time and Material
Fig. 4. Semantics-driven Representation of Context for Complex Terms of Action: “Adjust Time and Material for Delivery Centre in Chicago”.
Usability measures, such as easy to use, efficient to use and easy to learn, all received high ratings, particularly for the least experienced directors. The more experienced group had more difficulties navigating through the graph represen-tation and its context. More surprisingly experienced users are more optimistic regarding the quality of the outcome (Makes no mistake), and tend to trust the system more easily (G1: 3.55, G2: 3.75, G3: 4.35, G4: 4.75). This is due to the fact that more senior users already know about the context, and therefore trust a system that is giving information they already know. Junior users are less exposed and then tend to be more cautious about the outcome.
4.3 Experimental Results: System Evaluation
The system is tested on: 16 Intel(R) Xeon(R) CPU E5-2680, 2.80GHz cores, 32GB RAM.
On Markup The markup functionality requires to have a classification model ready to be used for important terms identification. Classification is performed off-line with an average computation time of 65 seconds for 1, 200 actions and 5 classes. Once the model is computed the identification of terms is done action by action, which takes on average 18 seconds. The latter is also computed off-line for scalability reasons.
On Semantic Embedding There are 1,200 actions to be recommended for contracts and 3,000 QADs (end users) in Accenture. On average an action would require about 15 calls for semantic embedding, which costs up to 500 ms. Since the set of actions is relatively static, we performed semantic embedding and cache the embedding results for all actions. We do the same on all user profiles. When a given user sees a particular action, the semantic embedding is a union of both results. We only consider embedding concepts over the graph up to a certain number of hops (currently two) away from the key terms’ concepts.
Interacting with Contextualization
Contextualization G1 ([0-3) months) (G2) [3-6) months
(OFF/ON) is ... OFF ON OFF ON
Mean St.Dev. Mean St.Dev. Mean St.Dev. Mean St.Dev. Easy to use 1.02 0.25 4.10 0.62 1.62 .25 4.05 0.05 Efficient to use 1.82 0.35 4.50 0.25 2.04 0.45 4.40 0.25 Makes no mistakes 1.15 0.25 3.55 0.45 1.15 0.15 3.75 0.14 Easy to learn 1.15 0.45 4.90 0.15 1.65 0.15 4.75 0.15 Convenient to use 1.25 0.55 4.15 0.65 1.25 0.25 4.05 0.45 Reliable 2.55 0.85 3.85 1.05 2.65 0.65 4.05 0.32 Engaging 0.77 0.25 4.85 0.25 0.99 0.10 4.75 0.21 Overall, I am satisfied 1.15 0.55 4.55 .55 1.95 0.15 4.12 0.15
Interacting with Contextualization
Contextualization G3 ([6-12) months) (G4) over 12 months
(OFF/ON) is ... OFF ON OFF ON
Mean St.Dev. Mean St.Dev. Mean St.Dev. Mean St.Dev. Easy to use 2.02 0.15 3.85 0.42 3.22 .36 3.45 0.33 Efficient to use 1.95 0.35 4.00 0.45 2.45 0.66 3.95 0.52 Makes no mistakes 0.95 0.35 4.35 0.15 1.55 0.33 4.75 0.41 Easy to learn 3.15 0.35 3.95 0.85 3.05 0.25 3.85 0.51 Convenient to use 2.55 0.45 4.05 0.25 2.25 0.42 3.85 0.99 Reliable 3.05 0.45 4.35 0.95 3.05 0.31 4.15 0.21 Engaging 2.85 0.15 4.35 0.15 1.49 0.23 4.45 0.14 Overall, I am satisfied 1.15 0.55 3.85 0.25 2.45 0.12 3.65 0.11 Table 1. Perceived Usability Rating by Users Using a Likert Scale, where 1=Disagree, 5=Agree.
On Scoping Scoping is not resource-consuming as the processing is done locally in memory (requiring no querying). On average, a user has about 100 statements to describe the user context, while an action has generally fewer statements as the action context. Scoping on a single action’s context w.r.t. the user context in most cases requires less than 15 milliseconds. Caching is possible: the combination of frequently recommended actions and most active users can be pre-computed.
4.4 Lessons Learnt
• Context Importance: Although directors are senior, they do not have nec-essarily all the same deep and long experience in selecting actions for mitigating risks of projects. Indeed the turnover of QAD within the company i.e., 24% is very high for such roles. The latter is one of the strongest motivation to get context for non-experienced directors, specially for projects which may be out of their industry, geography or scope.
• Context Navigation: Our focus group user study emphasizes the advantage of using semantic Web technologies for bringing contextualization and person-alization to the tasks of actions selection. In particular the least experienced directors benefit the semantic context the most. Although the most experienced group also benefits from the contextualization, deeper contexts were expected in some cases for this group. More detailed context would require more infor-mation on a graph, which we limited to 11 nodes. Handling larger knowledge graphs might be challenging from a user perspective. Towards this issue we have been requested by quality assurance directors to handle graph summarization [10] for capturing the essence of some information to understand actions. • Context Display: As emphasized in Table 1, the usability of the context, and in particular the graph part of the personalization, has been questioned by the most experienced user groups. Some of the users had difficulties navigating the concepts in the graph, which emphasizes the common usability issues in knowl-edge representation systems [11]. Towards this issue it has been recommended to expose narrative-like sentences rather than tree or graph structures, which are less of use by financial experts.
• Context Trust: As mentioned in Section 4.2 context trust might be an issue for some users. Indeed they needed evidence the systems is displaying correct context, which not all users have knowledge to assess its veracity. This is true for more junior users, who tend to verify the facts. Although we integrated PROV-O for provenance, but more from a debugging perspective, it turns out that we should have communicated this information more explicitly to our users. • Vocabulary Alignment: The OWL / RDF (concept) linking (alignment) process has been performed manually between our enterprise context and ex-ternal vocabularies, but only once. However the latter needs to be replicated for each new data source or schema we might need to integrate. The automa-tion of this process is a complex task as it required to align descripautoma-tions from very dedicated enterprise vocabularies with concepts from broad and sometimes inexpressive models such as DBpedia or wikidata.
• Markup Scalability: The Markup functionality, ensuring the detection of important terms to be contextualized, has shown some scalability, in particular for real-time processing. The identification of terms using [8] requires complex and time-consuming similarity functions to evaluate which terms are represen-tative in an action with respect to a give class. Given that pair-wise similarity is performed, on-time processing is limited. Therefore our current implementation does not consider incremental adds-on of new actions in the system. The task
of classification needs to be re-activated each time a new action and its class are added. Senior QADs questioned about the end-to-end automation of the risk management chain i.e., from minutes meeting ingestion to real-time suggestion of new actions (when available). This is a clear limitation of our asset.
5
Conclusions
Daily tasks of quality assurance directors range from: evaluating the level of risk of projects, investigating its root causes, requesting support from other QADs, exploring inconsistencies and selecting relevant actions to be applied for mitigating financial risks, and limiting any revenue loss. This work addresses the problem of understanding complex and sometimes generic and broad actions together with the rational of their context. Our approach integrates enterprise and external data into a knowledge graph and interprets actions based on QADs’ profiles through semantic reasoning over this enterprise KG. User studies have shown that QADs, and particularly more junior directors, could more efficiently select actions that better mitigate the risk than the existing approach.
In future work, we will consider interactive learning to facilitate the on-the-fly integration of user feedback. We also expect to expand linkage of our enterprise knowledge graph with more LOD entities.
References
1. Cooper, D.F.: Project risk management guidelines: managing risk in large projects and complex procurements. John Wiley & Sons, Inc. (2005)
2. Mustafa, M.A., Al-Bahar, J.F.: Project risk assessment using the analytic hierarchy process. IEEE transactions on engineering management 38(1) (1991) 46–52 3. Huchzermeier, A., Loch, C.H.: Project management under risk: Using the real
options approach to evaluate flexibility in r d. Management Science 47(1) (2001) 85–101
4. Raz, T., Michael, E.: Use and benefits of tools for project risk management. International journal of project management 19(1) (2001) 9–17
5. Chapman, C.: Project risk analysis and managementpram the generic process. International Journal of Project Management 15(5) (1997) 273–281
6. Hu, Y., Zhang, X., Sun, X., Liu, M., Du, J.: An intelligent model for software project risk prediction. In: Information Management, Innovation Management and Industrial Engineering, 2009 International Conference on. Volume 1., IEEE (2009) 629–632
7. Tserng, H.P., Yin, S.Y., Dzeng, R., Wou, B., Tsai, M., Chen, W.: A study of ontology-based risk management framework of construction projects through project life cycle. Automation in Construction 18(7) (2009) 994–1008
8. Ribeiro, M.T., Singh, S., Guestrin, C.: ”why should I trust you?”: Explaining the predictions of any classifier. [8] 1135–1144
9. Anand, S.S., Mobasher, B.: Introduction to intelligent techniques for web person-alization. ACM Trans. Internet Technol. 7(4) (2007) 18
10. Gunaratna, K., Thirunarayan, K., Sheth, A.P.: FACES: diversity-aware entity summarization using incremental hierarchical conceptual clustering. [10] 116–122 11. McGuinness, D.L., Patel-Schneider, P.F.: Usability issues in knowledge