HAL Id: hal-00317998
https://hal.archives-ouvertes.fr/hal-00317998
Submitted on 22 Nov 2005
HAL is a multi-disciplinary open access
archive for the deposit and dissemination of
sci-entific research documents, whether they are
pub-lished or not. The documents may come from
teaching and research institutions in France or
abroad, or from public or private research centers.
L’archive ouverte pluridisciplinaire HAL, est
destinée au dépôt et à la diffusion de documents
scientifiques de niveau recherche, publiés ou non,
émanant des établissements d’enseignement et de
recherche français ou étrangers, des laboratoires
publics ou privés.
Geomagnetically induced pipe-to-soil voltages in the
Czech oil pipelines during October-November 2003
P. Hejda, J. Bochni?ek
To cite this version:
P. Hejda, J. Bochni?ek. Geomagnetically induced pipe-to-soil voltages in the Czech oil pipelines
during October-November 2003. Annales Geophysicae, European Geosciences Union, 2005, 23 (9),
pp.3089-3093. �hal-00317998�
SRef-ID: 1432-0576/ag/2005-23-3089 © European Geosciences Union 2005
Annales
Geophysicae
Geomagnetically induced pipe-to-soil voltages in the Czech oil
pipelines during October–November 2003
P. Hejda and J. Bochn´ıˇcek
Geophysical Institute, Academy of Sciences, Bocni II, 14 131, Prague, Czech Republic
Received: 22 February 2005 – Revised: 12 July 2005 – Accepted: 20 July 2005 – Published: 22 November 2005 Part of Special Issue “1st European Space Weather Week (ESWW)”
Abstract. Whereas geomagnetically induced currents are a
source of problems for technological systems mainly at high geomagnetic latitudes, strong geomagnetic disturbances can have quite strong effects even at mid-latitudes. This paper deals with the analysis of the pipe-to-soil (P/S) voltage mea-sured in oil pipelines in the Czech Republic during the Hal-loween magnetic storms in 2003. It is shown that the simplest – plane wave and uniform Earth-model of the electric field corresponds well to the measured P/S voltage. Although the largest amplitudes of the geomagnetic field were reached on the onset of the geomagnetic storm, large voltages were also induced in the main and recovery phases due to Pc5 oscilla-tions.
Keywords. Geomagnetism and paleomagnetism
(Geomag-netic induction; Rapid time variations)
1 Introduction
The rapidly varying geomagnetic field occurring in connec-tion with geomagnetic storms may induce electric fields and currents that can affect technological systems, such as power transmission grids, telecommunication cables and oil or gas pipelines (Boteler et al., 1998). Geomagnetically induced currents (GIC) are a source of problems for technological systems mainly at high geomagnetic latitudes. This is why these phenomena have been studied intensively in Canada, Scandinavia and Scotland (e.g. Bolduc, 2002; Molinski, 2002; Beamish et al., 2002; Pirjola et al., 2003). Neverthe-less, strong geomagnetic disturbances can have quite strong effects even at mid-latitudes. Irregular currents observed in the oil pipelines in the Czech Republic during the Halloween magnetic storms in 2003 caused the pipeline operator to con-tact the Geomagnetic Department of the Geophysical Insti-tute, which gave rise to this study.
Correspondence to: P. Hejda
(ph@ig.cas.cz)
Pipelines may suffer from problems associated with cor-rosion due to GIC and the accompanying pipe-to-soil (P/S) voltages (Jansen et al., 2000; Trichtchenko et al., 2002). The telluric currents alter the pipe-to-soil potential to a re-gion where the electrochemical processes of corrosion can proceed (e.g. Gummov, 2002). Even though the pipelines are provided with an insulating coating, there are always points where the insulation is defective. For this reason, the pipelines are, in addition, equipped with a cathodic protec-tion system which keeps the pipeline at a negative potential of about 1 to 2 volts in relation to the ground.
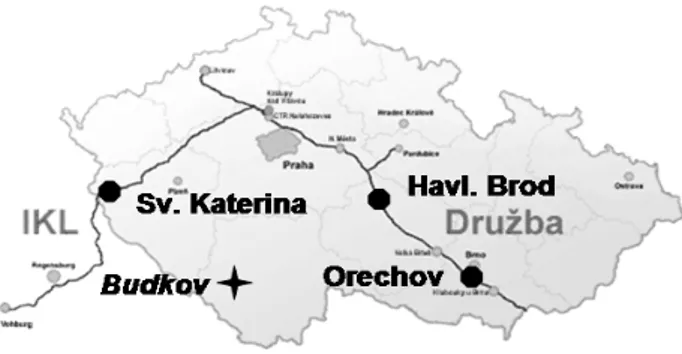
The oil transport system in the Czech Republic consists of the DRUZBA pipeline, laid from the former Soviet Union in the sixties, and the IKL pipeline, built from Ingolstadt (Germany) to Kralupy nad Vltavou (Central Bohemia) in the nineties. As the pipelines were built in distinct epochs and belong to distinct European networks, they differ in many parameters. For example, the DRUZBA pipeline is coated by tar while the IKL pipeline is coated by polyethylene, the cathodic protection is set to −1.2 V for DRUZBA and −2 V for IKL. The P/S voltage is recorded at about 80 stations. For this pilot study, three stations were selected from differ-ent parts of the network (see Fig. 1).
As the pipeline data are assigned to Central European Time (CET) all graphs (including magnetic data) keep this time zone (CET=UT+1:00).
2 Magnetic and electric fields at the Earth’s surface
Geomagnetically induced currents can be viewed as a result of electromagnetic coupling between space currents (in the first order ionospheric) and conductors of the particular tech-nological system. In general, the problem can be divided into two steps (Pirjola, 2002):
1. Determination of the horizontal geoelectric field at the Earth’s surface;
3090 P. Hejda and J. Bochn´ıˇcek: Geomagnetically induced P/S voltages
Fig. 1. Oil pipelines in the Czech Republic, the measuring stations
used in the present analysis and the Reference Geomagnetic Obser-vatory Budkov.
24-Oct 25-Oct 26-Oct 27-Oct 28-Oct 29-Oct 30-Oct 31-Oct 1-Nov 2-Nov 400 600 800 1000 1200 nT -2 -1 0 1 2 nT/s 24-Oct 25-Oct 26-Oct 27-Oct 28-Oct 29-Oct 30-Oct 31-Oct 1-Nov 2-Nov 19400 19600 19800 20000 20200 20400 nT -2 -1 0 1 2 nT/s X-component Y-component
Fig. 2. North, X, and east, Y, components of the geomagnetic field
recorded at the Geomagnetic Observatory Budkov between 24 Oc-tober and 1 November 2003 (black lines) and their time derivatives (shadow lines). The sampling rate is 1 min.
2. Computation of the currents in the particular technolog-ical system based on Ohm’s and Kirchhoff’s laws; par-ticular calculations for pipeline networks were given by Pulkkinen et al. (2001) and for power systems by Lehti-nen et al. (1985).
As we do not have enough information about the techni-cal parameters of the pipelines, the second point is not the subject of this paper. Instead, the measured P/S voltage data are directly compared with the calculated geoelectric field, which itself is calculated by the simplest plane wave model. This step is connected with several constraints:
1. The Earth is replaced by a half-space with a flat surface. It does not represent any severe limitation, as GIC are a regional phenomenon;
2. The second assumption says that the Earth structure is (regionally) homogeneous with constant conductiv-ity σ . This assumption is definitely not valid, but it is acceptable in the present study;
3. We further suppose that the information contained in the time variation of the geomagnetic field (measured at the
geomagnetic observatory Budkov) is sufficient for com-puting the geoelectric field or, to put it in a better way, the field is satisfactorily homogeneous in the whole re-gion and the ionospheric primary currents need not be considered. This point is discussed below.
The calculations can be carried out either in frequency do-main or in time dodo-main (Pirjola, 2002). The relation between the electric and magnetic fields in time domain reads:
Ey(t ) = − 1 √ π µ0σ Z ∞ 0 g(t − u) √ u du, g(t ) = dBx(t ) dt
and, correspondingly, for Ex. Here, x denotes north and y east components. Even if the electric field is affected by all the past values, their weight is decreasing with time and a stable solution can be achieved by integration over several hours. In accordance with Viljanen (1989) twelve hours were used in our calculations.
3 Halloween geomagnetic storms
Geomagnetic storms that occurred at the end of October 2003 were the biggest over the last decades. During the two great-est events, the geomagnetic activity considerably exceeded the limit for K=9 at most observatories. Figure 2 shows the horizontal components of the geomagnetic field recorded at the Budkov Observatory (the limit for K=9 is 500 nT). The selected period starts with a few quiet days before the dou-ble geomagnetic storm, which allows us to study the phe-nomenon under various conditions. Figure 2 also shows the time derivatives of the components. We can notice that whereas the largest spikes appeared at the onset of the mag-netic storms, large time derivatives were also connected with the oscillations in the main phase (between 9:00 and 18:00 on 29 October) and in the recovery phase (between 6:00 and 15:00 on 31 October). According to Sakurai (2004), the am-plitude of the Pc5 oscillations in the recovery phase on 31 October belonged to the largest ever recorded. The calcu-lations of the electric field were done with the value of con-ductivity σ =0.001 [1/ohm m], which is a typical value for the Czech territory (J. Pek, private communication, 2004). The computed electric field is shown in Fig. 3.
In order to test the homogeneity of the electromagnetic field, the results from Budkov were compared with the data from the neighbouring observatories of F¨urstenfeldbruck, Niemegk and Belsk. The difference in the computed elec-tric field was less than 5% of the maximum value at Budkov. It confirms the correctness of the assumption of the homo-geneity of the electromagnetic field. Of course, this finding is not a big surprise for a mid-latitude region.
4 Analysis of the pipe-to-soil voltage
The P/S voltage is measured continuously at about 80 points on the Czech pipelines and its 30 s average values are regis-tered with a time step of 30-s. The data are used to check the
24-Oct 25-Oct 26-Oct 27-Oct 28-Oct 29-Oct 30-Oct 31-Oct 1-Nov 2-Nov -400 -200 0 200 400 600 nT -2 -1 0 1 2 nT/s 24-Oct 25-Oct 26-Oct 27-Oct 28-Oct 29-Oct 30-Oct 31-Oct 1-Nov 2-Nov -400 -200 0 200 400 600 800 nT 2 1 0 -1 -2 nT/s X-component Y-component
Fig. 3. North, X, and east, Y, components of the geoelectric field
computed by the plane-wave model using data from the Observa-tory Budkov (black lines) and corresponding time derivatives of the geomagnetic field (shadow lines). The sampling rate is 1 min.
cathodic protection, which is set to −1.2 V for DRUZBA and
−2 V for IKL.
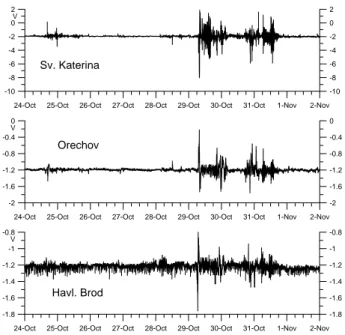
We were provided with data from three stations (see Fig. 4). The graphs from Sv. Katerina and Orechov show di-rect impact of geomagnetic disturbances on the P/S voltage. At the same time, the amplitude of the voltage is much higher at Sv. Katerina. The voltage record at Havlickuv Brod is, in general, noisier, but the impact of the geomagnetic storm is less pronounced. One of the largest spikes (−5.88 V) in Sv. Katerina data occured on 30 October at 21:10 CET and is closely related to the blackout of the power system in south-ern Sweden at 21:07 CET (Lundstedt, 2004).
As the induced P/S voltage depends not only on the mag-nitude of the electric field but also on its direction with re-spect to the pipeline, we computed a direction which gives the highest correlation with the P/S voltage (Trichtchenko et al., 2004). To be more concrete: P/S voltage was correlated with Eα=Excos α+Eysin α, for all α from 0◦to 360◦(step 5◦), and the angle α which gave the highest correlation co-efficient was denoted at a best-fit direction. In order to as-sess the robustness of the best-fit direction, the correlation was computed not only for the whole period but also sepa-rately for each day. Stable results were obtained for Orechov and Sv. Katerina again (see Fig. 5). The best-fit direction at Orechov is closely related to the direction of the pipeline. The situation at Sv. Katerina is more intricate as the pipeline bends near the station.
The fit between the computed electric field and the P/S voltage is shown on the detailed graphs of the most disturbed period in Fig. 6 and on the scatter graphs that involve the whole interval in Fig. 7. We must remember that the magni-tude of geoelectric field is dependent on the Earth’s conduc-tivity. As the value σ =0.001 [1/ohm m] is just a crude guess of the true values, it makes sense to pay attention only to the order of magnitude, which is as high as 1 V/km. The volt-age induced in the pipelines thus corresponds to the distance from one to ten kilometers, which is a reasonable result.
24-Oct 25-Oct 26-Oct 27-Oct 28-Oct 29-Oct 30-Oct 31-Oct 1-Nov 2-Nov -1.8 -1.6 -1.4 -1.2 -1 -0.8 V -1.8 -1.6 -1.4 -1.2 -1 -0.8 Havl. Brod
24-Oct 25-Oct 26-Oct 27-Oct 28-Oct 29-Oct 30-Oct 31-Oct 1-Nov 2-Nov -2 -1.6 -1.2 -0.8 -0.4 0 V -2 -1.6 -1.2 -0.8 -0.4 0 Orechov
24-Oct 25-Oct 26-Oct 27-Oct 28-Oct 29-Oct 30-Oct 31-Oct 1-Nov 2-Nov -10 -8 -6 -4 -2 0 2 V -10 -8 -6 -4 -2 0 2 Sv. Katerina
Fig. 4. Pipe-to-soil voltage recorded at the stations Orechov, Sv.
Katerina and Havlickuv Brod between 24 October and 1 November 2003.
24-Oct 26-Oct 28-Oct 30-Oct 1-Nov 0 0.2 0.4 0.6 0.8 1 C o rre la tio n 0 90 180 270 360 Best-fit d irecti o n Sv. Kateřina 0.763, 270o
24-Oct 26-Oct 28-Oct 30-Oct 1-Nov 0 0.2 0.4 0.6 0.8 1 C o rrelatio n 0 90 180 270 360 Bes t-f it di re cti o n Havl. Brod 0.164, 150o
24-Oct 26-Oct 28-Oct 30-Oct 1-Nov 0 0.2 0.4 0.6 0.8 1 C o rr el at io n 0 90 180 270 360 B e s t-fi t d ire c ti o n Ořechov 0.874, 140o
Fig. 5. Best-fit directions (lines) and correlations (bars) between the
vector of geoelectric field and the P/S voltage. The figures on the left denote average values over the whole period.
In general, the differences between individual stations are due to the geological conditions (Earth’s electrical conduc-tivity) and technical parameters of the pipeline system. As we are not aware of any dramatic differences in the conduc-tivity on the territory of the Czech Republic, we will further concentrate on technical parameters.
An important factor is that primary corrosion protection is secured by insulating coating. If the coating were perfect, no cathodic protection would be necessary. On the other hand, coating with greater electrical resistance produces greater voltage between the pipeline and the ground, which increases
3092 P. Hejda and J. Bochn´ıˇcek: Geomagnetically induced P/S voltages 10/29/03 6:00 10/29/03 9:00 10/29/03 12:00 -500 0 500 1000 mV/km -1.6 -1.2 -0.8 -0.4 0 nT/s 10/29/03 6:00 10/29/03 9:00 10/29/03 12:00 -800 -600 -400 -200 0 200 400 mV/km -10 -8 -6 -4 -2 0 2 nT/s Sv. Katerina Orechov
Fig. 6. Fit between the measured P/S voltage (red) and the
com-puted geoelectric field (black) for the most disturbed period of 29 October 2003. -400 -200 0 200 400 600 800 mV/km -2 -1.6 -1.2 -0.8 -0.4 0 V Orechov -800 -600 -400 -200 0 200 400 mV/km -10 -8 -6 -4 -2 0 2 V Sv. Katerina
Fig. 7. Scatter graphs of the P/S voltage [mV/km] vs. computed
geoelectric field [V] for the whole period from 24 October to 1 November 2003.
the risk of corrosion at those points of the pipeline where the insulation is defective (Jansen et al., 2000). The pipe-to-soil electrical resistance of DRUZBA pipeline, which is coated with tar, is lower than the pipe-to-soil resistance of IKL, which is protected by polyethylene. This partly explains the differences in amplitude between Sv. Katerina and Orechov. Another reason for larger P/S voltages at Sv. Katerina than at Orechov is the fact that the former lies near a bend whereas the latter is in the middle of a straight pipeline section.
0 45 90 135 180 225 270 315 0 45 90 135 180 225 270 315
(a)
(b)
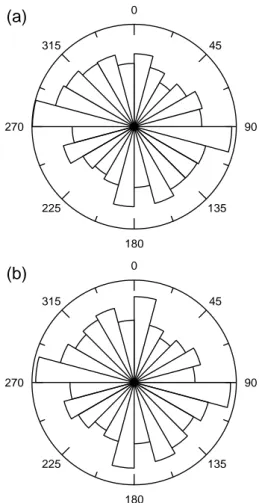
Fig. 8. Distribution (relative frequency) of the directions of ∂B/∂t
in horizontal plane. (a) year 2003, (b) period between 24 October and 1 November 2003.
Regarding the station Havlickuv Brod, the noise on the graph in Fig. 4 indicates that the pipeline near Havlickuv Brod is significantly affected by stray currents caused by in-dustrial electromagnetic fields. Their size is comparable with the effect of GIC.
5 Concluding remarks
It was shown that the simplest - plane wave and uniform Earth − model of the electric field corresponds surprisingly well to the measured P/S voltage at Sv. Katerina and Ore-chov. As we analyzed a relatively short time interval, a ques-tion arises about the relevance of the results. Our belief in a positive answer is based on two facts. Firstly, the analyzed interval includes periods with various levels of disturbances. There are quiet periods, onsets of great geomagnetic storms, oscillations in the recovery phase, etc. Secondly, as the mag-netic and electrical fields are vector quantities, we calculated the frequency of occurrence of directions of ∂B/∂t (with the step of 15 deg) and found a close similarity between the data from 23 October to 1 November and the data for the com-plete year 2003 (see Fig. 8). This is a good message for
the pipeline operators, because they know what effects can be expected in the future (including the minimal response at Havlickuv Brod).
On the other hand, the present results did not enable any deeper insight into the problem. This is why we hope to ob-tain more data from a greater number of measuring stations and apply quantitative models of geomagnetically induced currents and voltages in the pipeline networks.
Acknowledgements. We thank the referees for their valuable com-ments. The P/S voltage data are in the ownership of the joint-stock company MERO CR, a.s. We express our thanks to Pavel Rada from the service organization Prvni korozni spol. s r.o. for prepar-ing the data in a user-friendly form and for discussprepar-ing the technical issues. This work was supported by grant IAA3012105 of the Grant Agency of the ASCR and by COST724 Action.
Topical Editor T. Pulkkinen thanks two referees for their help in evaluating this paper.
References
Beamish, D., Clark, T. D. G., Clarke, E., and Thomson, A. W. P.: Geomagnetically induced currents in the UK: Geomagnetic vari-ations and surface electric fields, J. Atmos. Solar Terr. Phys., 64, 1779–1792, 2002.
Bolduc, L.: GIC observations and studies in the Hydro-Quebec power system, J. Atmos. Solar Terr. Physics, 64, 1793–1802, 2002.
Boteler, D. H., Pirjola, R. J., and Nevanlinna, H.: The effects of geo-magnetic disturbances on electrical systems at the earth’s surface, Adv. Sp. Res., 22, 17–27, 1998.
Jansen, F., Pirjola, R., and Favre, R.: Space weather. Hazard to the Earth?, Swiss Reinsurance Company, Zurich, 2000.
Gummow, R. A.: GIC effects on pipeline corrosion and corrosion control systems, J. Atmos. Solar Terr. Physics, 64, 1755–1764, 2002.
Lehtinen, M. and Pirjola, R.: Currents produced in earthed conduc-tor networks by geomagnetically-induced electric fields, Ann. Geophys., 3, 479–484, 1985.
Lundstedt, H.: The Sun, Space Weather and GIC effects in Sweden, COSPAR Assembly, Paper Number PSW1-0013-04, 2004. Molinski, T. S .: Why utilities respect geomagnetically induced
cur-rents, J. Atmos. Solar Terr. Physics, 64, 1765–1778, 2002. Pirjola, R.: Review on the calculation of surface electric and
mag-netic fields and of geomagmag-netically induced currents in ground-based technological systems, Surveys in Geophysics, 23, 71–90, 2002.
Pirjola, R., Pulkkinnen, A., and Viljanen, A.: Studies of space weather effects on the Finnish natural gas pipeline and on the Finnish high-voltage power system, Advances in Space Re-search, 31, 795–805, 2003.
Pulkkinen, A., Pirjola, R., Boteler, D., Viljanen, A., and Yegorov, I.: Modelling of space weather effects on pipelines, J. Appl. Geo-phys., 48, 233–256, 2001.
Sakurai, T. and Tonegawa, Y.: A coordinated magnetic field data study of large amplitude Pc 5 ULF waves observed during the su-per storm on 29–31 October 2003. Proceedings of the XIth IAGA Workshop on Geomagnetic Observatory Instruments, Data Ac-quisition and Processing., 9–17 November 2004, Kakioka Geo-magnetic Observatory, Japan, 301, 2004.
Trichtchenko, L. and Boteler, D. H.: Modelling of geomagnetic in-duction in pipelines, Ann. Geophys., 20, 1063–1072, 2002,
SRef-ID: 1432-0576/ag/2002-20-1063.
Trichtchenko, L. and Boteler, D. H.: Modelling geomagnetically induced currentsusinggeomagnetic indices and data, IEEE Trans. Plasma Sci., 32, 1459–1467, 2004.
Viljanen, A. and Pirjola, R.: Statistics on Geomagnetically-Induced Currents in the Finnish 400 kV Power System Based on Record-ings of Geomagnetic Variations. J. Geomag. Geoelectr., 41, 411– 420, 1989.