HAL Id: hal-00318072
https://hal.archives-ouvertes.fr/hal-00318072
Submitted on 3 Jul 2006
HAL is a multi-disciplinary open access
archive for the deposit and dissemination of
sci-entific research documents, whether they are
pub-lished or not. The documents may come from
teaching and research institutions in France or
abroad, or from public or private research centers.
L’archive ouverte pluridisciplinaire HAL, est
destinée au dépôt et à la diffusion de documents
scientifiques de niveau recherche, publiés ou non,
émanant des établissements d’enseignement et de
recherche français ou étrangers, des laboratoires
publics ou privés.
Simultaneous radar and spaced receiver VHF
scintillation observations of ESF irregularities
D. Tiwari, B. Engavale, A. Bhattacharyya, C. V. Devasia, T. K. Pant, R.
Sridharan
To cite this version:
D. Tiwari, B. Engavale, A. Bhattacharyya, C. V. Devasia, T. K. Pant, et al.. Simultaneous radar and
spaced receiver VHF scintillation observations of ESF irregularities. Annales Geophysicae, European
Geosciences Union, 2006, 24 (5), pp.1419-1427. �hal-00318072�
Ann. Geophys., 24, 1419–1427, 2006 www.ann-geophys.net/24/1419/2006/ © European Geosciences Union 2006
Annales
Geophysicae
Simultaneous radar and spaced receiver VHF scintillation
observations of ESF irregularities
D. Tiwari1, B. Engavale1, A. Bhattacharyya1, C. V. Devasia2, T. K. Pant2, and R. Sridharan2
1Indian Institute of Geomagnetism, Plot No. 5, Sector-18, New Panvel (W) New Mumbai- 410218, India 2Space Physics Laboratory, Vikram Sarabhai Space Centre Thiruvananthapuram-695022, India
Received: 6 September 2005 – Revised: 29 January 2006 – Accepted: 10 January 2006 – Published: 3 July 2006 Part of Special Issue “The 11th International Symposium on Equatorial Aeronomy (ISEA-11), Taipei, May 2005”
Abstract. Simultaneous observations of equatorial spread
F (ESF) irregularities made on 10 nights during March– April 1998 and 1999, using an 18-MHz radar at Trivan-drum (77◦E, 8.5◦N, dip 0.5◦N) and two spaced receivers recording scintillations on a 251-MHz signal at Tirunelveli (77.8◦E, 8.7◦N, dip 0.4◦N), have been used to study the evo-lution of Equatorial Spread F (ESF) irregularities. Case stud-ies have been carried out on the day-to-day variability in ESF structure and dynamics, as observed by 18-MHz radar, and with spaced receiver measurements of average zonal drift Vo
of the 251-MHz radio wave diffraction pattern on the ground, random velocity Vc, which is a measure of random changes
in the characteristics of scintillation-producing irregularities, and maximum cross-correlation CI of the spaced receivers
signals. Results show that in the initial phase of plasma bub-ble development, the greater the maximum height of ESF ir-regularities responsible for the radar backscatter, the greater the decorrelation is of the spaced receiver scintillation sig-nals, indicating greater turbulence. The relationship of the maximum spectral width derived from the radar observations and CIalso supports this result.
Keywords. Ionosphere (Equatorial ionosphere; Ionospheric
irregularities; Plasma waves and instabilities)
1 Introduction
The inhomogenities or irregularities in the nighttime F region of the equatorial ionosphere, termed as equatorial spread F (ESF), are known to be geomagnetic field-aligned and dis-play a wide spectrum of scale sizes, ranging from a few centimeters to hundreds of kilometers (Kelley, 1989; Hysell, 2000 and the references therein). A hierarchy of plasma in-stabilities is believed to be the cause for the observed wide range of scale sizes, starting with a collisional shear
instabil-Correspondence to: D. Tiwari
(diwakart@iigs.iigm.res.in)
ity which is capable of producing large-scale plasma waves in the bottomside equatorial ionosphere at sunset, thus pre-conditioning the equatorial ionosphere for the onset of spread F (Hysell and Kudeki, 2004), due to the growth of the Gener-alized Rayleigh Taylor (GRT) instability, which may evolve into a full fledged plasma bubble extending to the topside, provided that the bottomside of the equatorial ionosphere is sufficiently high (Bhattacharyya, 2004). These two mech-anisms produce irregularities with a scale in the 0.1 km to 20 km range, with an extension of the range to shorter scale lengths through secondary plasma instabilities (Haerendel, 1974; Chaturvedi and Kaw, 1976; Costa and Kelley, 1978). The GRT instability includes the destabilizing effects of the ambient electric field as well as the neutral wind and gravity (Sekar and Raghavarao, 1987; Sultan, 1996). The bottom-type scattering layers associated with ESF may be considered to arise due to primary waves excited by horizontal wind-driven instabilities (Hysell et al., 2004).
ESF irregularities produce amplitude and phase scintil-lations on transionospheric signals in the VHF and higher frequency ranges and show day-to-day variability, as well as variability with season, solar cycle, and magnetic activ-ity (Basu et al., 1988; Aarons, 1993, 1997; Aarons et al., 2000; Bhattacharyya and Basu, 2002). Earlier studies have been mostly concerned with such variability in the occur-rence pattern of ESF. However, day-to-day variability in the evolution of spatial structure in ESF irregularities, which is of prime concern as far as the impact of these irregularities on satellite-based communication and navigation systems, such as the GPS is concerned, has not received much attention. One of the problems encountered in studying the evolution of spatial structure in ESF irregularities is that for both scin-tillation and radar observations, except for the irregularities observed shortly after sunset, it is not known when the irreg-ularities observed at a given time were initially generated, as their generally eastward drift may move them onto the signal path even several hours after their initial generation.
1420 D. Tiwari et al.: Simultaneous radar and spaced receiver VHF scintillation observations
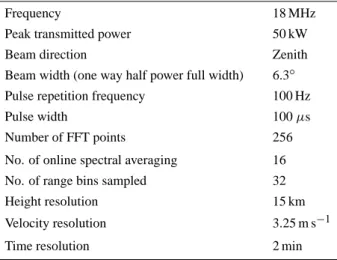
Table 1. Radar parameters and other specifications used for the spread F experiments.
Frequency 18 MHz
Peak transmitted power 50 kW
Beam direction Zenith
Beam width (one way half power full width) 6.3◦
Pulse repetition frequency 100 Hz
Pulse width 100 µs
Number of FFT points 256
No. of online spectral averaging 16
No. of range bins sampled 32
Height resolution 15 km
Velocity resolution 3.25 m s−1
Time resolution 2 min
There have been a few studies of the dynamics of ESF ir-regularities using scintillation observations (Bhattacharyya et al., 2001) and radar observations combined with scintillation observations (Rodrigues et al., 2004) which have shown the occurrence of large vertical drifts of the irregularities during the growth phase of equatorial plasma bubbles which could be associated with the perturbation electric field arising due to the GRT instability process. Here it is to be noted that although only the zonal drift, Vo, of the ground scintillation
pattern is calculated from spaced receiver scintillation obser-vations, the orientation of the signal path is usually such that vertical drifts of the irregularities also contribute to Vo, as
will be discussed in the next section. The fluctuating per-turbation electric fields associated with the growing plasma instability are expected to give rise to large variations in the irregularity drift during the growth phase of radar plumes, and hence larger spectral widths and greater decorrelation between scintillations recorded by spaced receivers. In the present paper, 18-MHz radar backscatter observations and scintillations recorded on a 251-MHz signal using spaced re-ceivers are used to study this aspect of the nonlinear evolu-tion of ESF irregularities.
2 Experimental details and data analysis
Simultaneous observations of ESF irregularities presented here were made using the 18-MHz radar located at Trivan-drum (77◦E, 8.5◦N, dip 0.5◦N), which pertain to 8.3-m scale size ESF irregularities, and spaced receivers recording scintillations on a 251-MHz signal at Tirunelveli (77.8◦E, 8.7◦N, dip 0.4◦N). The zenith and azimuth angles for the signal path from the geostationary satellite FLEETSAT, lo-cated at 73◦E, to Tirunelveli, are 11.4◦and 105.6◦, respec-tively. A calculation of the location of the ionospheric pierce
point (IPP) of the signal path at an altitude of 500 km shows that the scintillation receivers at Tirunelveli look at a volume that is approximately 50 km east of the volume seen by the radar at Trivandrum at an altitude of 500 km. It is expected that the ambient ionospheric conditions may not change sub-stantially over this distance. Considering the movement of the sunset terminator there should be around 1.56 min delay in the onset of ESF over Trivandrum compared to that along the signal path to Tirunelveli. Thus, it is likely that if an 18-MHz radar was located beneath the IPP for the Tirunelveli– FLEETSAT signal path, it would have seen nearly the same pattern of echoes from ESF irregularities as is seen by the 18-MHz radar located at Trivandrum at a later time, after a delay of about 1.56 min.
The 18-MHz radar located at Trivandrum is a coherent pulsed Doppler radar and is operated with a maximum aver-age power aperture product of 1.25×10⁷Wm2(Janardhanan et al., 2001). Spectral characteristics of the signal backscat-tered by 8.3-m scale size ESF irregularities, which have been obtained using this radar, have been studied by Tiwari et al. (2004). The radar specifications and other important pa-rameters used for ESF studies are given in Table 1. The three lower order (0th, 1st and 2nd) moments are estimated from the Doppler power spectra. Then the signal-to-noise ratio (SNR), line-of-sight irregularity drift and full spectral width respectively are derived from these moments, as described by Woodman (1985). These parameters have been used in the present study.
Two spaced receivers separated by a distance of 540 m, along an east-west baseline, have been used to record am-plitude scintillations on a 251-MHz signal transmitted from the geostationary satellite “FLEETSAT”, and received at the equatorial station Tirunelveli. The zonal drift of the ground scintillation pattern, Vo, has contributions from VE, the
eastward drift and VZ,the vertical drift of the irregularities,
which depends on the orientation of the signal path: Vo=VE–
VZtanθ sinφ, where θ is the zenith angle and φ is the azimuth
of the signal path measured eastward from the north. For the observations at Tirunelveli, θ =11.4◦and φ=105.6◦, yielding
Vo=VE–0.2VZ. Hence, large upward and downward
veloc-ities of the irregularveloc-ities, due to polarization electric fields associated with the GRT instability, give rise to large varia-tions in Vo(Bhattacharyya et al., 1989, 2001).
The scintillation data are sampled at 10 Hz. This data has been used to calculate the S4-index, which is the standard deviation of normalized intensity, and the maximum cross-correlation CI of the signals recorded by the two receivers,
for each 3-min interval during a scintillation event. Further, full correlation analysis (Briggs, 1984) was used to calculate the average drift, Vo, of the ground scintillation pattern
trans-verse to the signal path, as well as the random velocity, Vc,
which is a measure of the random variability of the irregular-ities. For the estimations of Vo and Vc, data for only those
three-minute intervals have been used for which CI>=0.5
and S4>0.15, in order to reduce the effect of noise and to
D. Tiwari et al.: Simultaneous radar and spaced receiver VHF scintillation observations 1421
Figure 1a
Figure 1b
Figure 1a
Figure 1b
Fig. 1. (a) Top, middle and bottom panels show the height-time-intensity (HTI), height-time-velocity (HTV) and height-time-width (HTW) maps of HF backscattered signal from spread F irregularities observed over Trivandrum on 19 March 1999. In the top panel,continuous and dashed lines represent the temporal variations of h0Fin the absence and presence of ESF respectively and thick black horizontal line indicates the duration of ESF observed from the Ionosonde data (b) Four panels, from top to bottom, present the temporal variations of maximum cross-correlation CIof the spaced receiver signals, random velocity Vc, average drift Voof the ground scintillation pattern along
the receiver baseline, and S4index, respectively.
improve the validity of the assumptions upon which the full correlation analysis is based (Engavale et al., 2005).
3 Case studies
Simultaneous observations of ESF irregularities on 10 nights during March–April 1998 and 1999 made using 18-MHz radar at Trivandrum and spaced receivers recording 251-MHz scintillations at Tirunelveli have been used here to un-derstand the evolution of spatial structure of ESF irregular-ities and their dynamics at different scale sizes. During the above periods, the Ap index varied in the range 3–16, which corresponds to magnetically quiet to moderate conditions.
The data here are classified into two categories, namely topside and bottomside, based on the height extent of the radar backscatter echoes. This enables us to illustrate dif-ferent types of ESF structures and their association with the parameters estimated from spaced receiver scintillation mea-surements. It may be noted that the recorded scintillations are an integrated effect and as such, it is not possible to dis-tinguish between topside and bottomside irregularities based on scintillation records alone. The base height of the
equa-torial F-region (h0F) during the post-sunset period shows considerable day-to-day variability. Hence, the bottomside backscattered echoes may occur at different altitudes on dif-ferent days. However, the classification here is also based on the vertical extent of the radar backscatter echoes: if the ver-tical extent of the echoes is less than 100 km, and the struc-ture is essentially restricted to altitudes below 400 km, it is classified as a bottomside structure. Four case studies are shown here and later general features emerging from simul-taneous observations on 10 nights are discussed. Out of the four cases presented here, three fall into the topside category, as the vertical extent of the radar backscatter echoes exceeds 100 km and extends above the 400-km altitude in these cases. During simultaneous observations on 10 nights, no exam-ple of an exclusively bottomside ESF structure was found. On 14 March 1999, a bottomside structure was observed for nearly 90 min, which was accompanied by a topside struc-ture for a shorter duration, shortly after 20 IST (Indian stan-dard time IST = UT+5.5 h). Study of these four cases reveals some of the different patterns of evolution of spatial structure in ESF irregularities that are part of the day-to-day variabil-ity of the ESF phenomenon. The apparent base height of the
1422 D. Tiwari et al.: Simultaneous radar and spaced receiver VHF scintillation observations
Figure 2a
Figure 2b
Figure 2a
Figure 2b
Fig. 2. (a) Same as Fig. 1a but for 14 April 1999. (b) Same as Fig. 1b but for 14 April 1999.
F-region (h0F), as estimated from ionosonde data, obtained
at Trivandrum are also indicated in each case as also the time duration of spread F seen on the Ionosonde data in each case. 3.1 Topside ESF structures
(i) 19 March 1999 (Ap=6)
The top, middle and bottom panels of Fig. 1a present, respectively, radar measured height-time-intensity (HTI), height-time-velocity (HTV) and height-time-width (HTW) maps observed on 19 March 1999. Here “intensity” refers to the signal-to-noise-ratio (SNR) and width refers to the full spectral width, derived from the backscattered signals. On this day, ESF was observed from 19:40 to 20:40 IST and the HTI map was spread over a large altitude range of 400–820 km, extending well into the topside F region. The strongest SNR is found to be associated with the rising plume and is in the typical range of 10–15 dB above the noise level and mostly associated with upward velocities, where above 100 m s−1 in the topside is a clear manifestation of a rising plume structure, while the decay phase is associated with predominantly downward velocities with magnitudes typi-cally about 50 m s−1. The HTV plot shown here is indicative of the nature of updrafting and downdrafting of small plasma structures. Higher spectral widths are also found to be as-sociated with the rising plume structure when the observed
irregularity drift exceeds 50 m s−1. Continuous and dashed lines represent h0F (bottom side F layer height) as a function
of time, as deduced from ionosonde data in the absence and presence of ESF respectively. The thick black line indicates the duration of ESF as seen in the ionosonde data on this night.
Four panels of Fig. 1b, starting from top, present the temporal variations of the maximum cross-correlation CI,of
the spaced receiver scintillation records, random velocity
Vc, average drift of the ground scintillation pattern along
the baseline, Vo, and S4 index, respectively, calculated for each 3-min interval. The initial appearance of 251-MHz scintillations is seen earlier than the 18-MHz radar echoes. In the initial phase of plasma bubble development (topside ESF), as seen in the radar HTI map, the maximum cross-correlation CI shows a sharp decrease to values below 0.5,
which is attributed to the presence of perturbation electric fields associated with the GRT instability (Bhattacharyya et al., 2001). Vc has higher values in the early phase of
the development of irregularities, with Vo having a larger
variability during this period. Strong scintillations were observed in association with radar backscatter echoes. In the initial phase, the radar measured vertical irregularity drift velocity also has large values, with the corresponding spectral widths also being larger. It is interesting to note that although the backscattering structures were absent after
D. Tiwari et al.: Simultaneous radar and spaced receiver VHF scintillation observations 1423
Figure 3a
Figure 3b
Figure 3a
Figure 3b
Fig. 3. (a) Same as Fig. 1a but for 19 April 1999. (b) Same as Fig. 1b but for 19 April 1999.
20:55 IST, a high level of scintillations was observed until 01:00 IST, similar to earlier observations reported elsewhere (Basu et al., 1978; Rodrigues et al., 2004). This is due to the decay of 8.3-m irregularities, while the longer scale length (>100 m) irregularities which formed earlier to the west of the observation point remained intact while they drifted eastward on to the signal path, to produce the recorded scintillations.
(ii) 14 April 1999 (Ap=7)
Figures 2a and b present the radar measured HTI, HTV and HTW and temporal variations of CI, Vc, Voand S4for
this day, similar to what has been presented above. On this day the onset of ESF irregularities was recorded at 19:42 IST and 18-MHz radar observed maximum SNR is found to be associated with the rising plumes and is in the typical range of 20–30 dB. Backscattering echoes disappeared at around 21:10 IST and again a very weak backscattering layer below 400 km appeared around 23:05 IST for a very brief period. On the whole, major features were similar to what has been observed on 19 March 1999. These observations suggest that the background ionospheric conditions were not very different on this day from that on 19 March 1999.
(iii) 19 April 1999 (Ap=12)
On this day the appearance of both radar echoes and VHF scintillations happened at a time later than in the previous two cases. HTI, HTV and HTW maps for this day have been shown in Fig. 3a. On this day the height extent of the radar echoes was confined to ∼400-650 km and two backscatter structures were observed with the first one being stronger with maximum observed SNR in the range of 20–30 dB, and with predominantly upward velocities (50–100 m s−1) and observed spectral widths mostly in the range of 0–50 m s−1. Backscattering echoes disappeared for about 5–10 min and a second backscattering layer reappeared with weaker SNR values, dominated with downward velocity (∼–50 m s−1) and small spectral widths varying in the range of 0–50 m s−1. Figure 3b shows the temporal variations of CI,Vc, Vo, and
S4index, respectively, for this day. On this day the observed maximum cross-correlation is always >0.75, with small val-ues of Vc (≤15 m s−1) and Vo also shows less variability
compared to other events discussed above. At around the time of the disappearance of radar echoes, scintillations also disappeared briefly, but later, strong and weak scintillations were observed periodically after the disappearance of radar echoes, and this continued until 01:00 IST.
1424 D. Tiwari et al.: Simultaneous radar and spaced receiver VHF scintillation observations
Figure 4a
Figure 4b
Figure 4a
Figure 4b
Fig. 4. (a) Same as Fig. 3a but for 14 March 1999 for bottomside ESF structure. (b) Same as Fig. 3b but for 14 March 1999 for bottomside ESF structure.
3.2 Bottomside ESF structures 14 March 1999 (Ap=15)
Figure 4a depicts the HTI, HTV and HTW maps for this day. The radar echoes were observed during 19:40– 21:20 IST. Note that the layer does not expand significantly in height with time. The HTV map shows the upward flow in the bottomside F region with maximum velocities up to 50 m s−1during the initial phase of the bottomside ESF struc-ture. A rising plasma structure, detached from the bottomside structure, with an upward flow velocity in the range of 50 to 100 m s−1 and extending a little beyond 700 km, could be seen during 20:12–20:42 IST. The decay phase is predomi-nantly associated with a downward velocity smaller in mag-nitude (30 m s−1)at about 300 km. The thickness of the bot-tomside backscattering layer was of the order of 100 km with a weak SNR (0–10 dB). Observed spectral widths on this day are mostly <50 m s−1.
Four panels of Fig. 4b, from top to bottom, present the temporal variations of CI,Vc, Vo, and the S4index, respec-tively. On this day no VHF scintillation data were available until 20:32 IST. From the available data, maximum cross-correlation CI was found to fall to about 0.5 at 20:40 IST,
with Vc showing higher values and Voshowing some
vari-ability around this time. Weak scintillations (S4 <0.25) were associated with the bottomside ESF structures seen af-ter 20:45 IST. Both strong and weak scintillations were
ob-served periodically after the disappearance of radar echoes and continued until 01:00 IST.
3.3 General features
In order to compare the ESF related parameters estimated from 18-MHz radar and 251-MHz scintillation observations, the composite scatter plots of CI, obtained from the
scin-tillation observations; maximum height of 18-MHz radar echoes; and maximum spectral widths estimated from the radar observations; versus IST, for all 10 days of observa-tions, are exhibited in Figs. 5a–c. For Figs. 6a–b, the radar derived parameters for the initial phase of bubble develop-ment have been time shifted, to take into account the time delay introduced by the movement of the sunset termina-tor. However, for CI values pertaining to IST later than
21:00 IST, it is assumed that the irregularities, which produce the observed scintillation, were generated earlier to the west of the FLEETSAT-Tirunelveli signal path, and then drifted onto this signal path with an average eastward drift speed of 150 m s−1. Hence, in Figs. 6a–b, C
I values have been
plot-ted against radar derived parameters time shifplot-ted by 5.44 min to a later time, to match the time of the CI values. From
the temporal variations of CI, as well as the radar measured
maximum height of the radar echoes and maximum spectral width shown, respectively, in Figs. 5a–c, it can be seen very clearly that the rapid decrease in CI, during the initial
devel-opment of ESF, also has a counterpart in rapidly increasing
D. Tiwari et al.: Simultaneous radar and spaced receiver VHF scintillation observations 1425
Figure 5abc
Figure 6ab
Fig. 5. Composite scatter plot of temporal variation of (a) CI, (b) maximum height, and (c) maximum spectral width of the radarbackscat-tered echoes.
Figure 5abc
Figure 6ab
Fig. 6. Composite scatter plot of (a) maximum height of the radar backscattered echoes versus CIand (b) spectral width versus CI.
spectral widths derived from radar echoes at this stage. The maximum height for the radar echoes also shows a similar pattern of variations with IST.
Figures 6a–b show the scatter plots of radar estimated maximum height versus CI, and radar estimated maximum
spectral width versus CI, where, as mentioned above, the
time for the radar parameters has been shifted to take into ac-count (a) the movement of the sunset terminator, (b) the east-ward drift of the irregularities. From Fig. 6a it is clear that for the values of CIless than 0.5, the maximum height of the
ESF irregularities is always more than 600 km. This supports the idea that during the period when the nonlinear evolution of the GRT-instability into plasma bubbles occurs resulting in topside structures, the spaced receiver signals are highly decorrelated and this fact can be used independently as an in-dicator of the scintillations being caused by freshly generated
plasma bubbles or by plumes. The plot of spectral width ver-sus CI (Fig. 6b) shows that values of CI≤0.5 are generally
associated with spectral widths exceeding 50 m s−1, indicat-ing the role of increased turbulence in causindicat-ing greater decor-relation of the spaced receiver scintillation signals. Lower values of spectral widths and higher values of CI are
gener-ally associated with the decay phase of plasma bubbles which drift onto the signal path from the west or with the bottom-side ESF structure.
4 Discussion
The general features of parameters derived from 18-MHz radar backscatter and spaced receiver scintillations on a 251-MHz signal reveal that in the case of bottomside ESF
1426 D. Tiwari et al.: Simultaneous radar and spaced receiver VHF scintillation observations
structures, generally the maximum cross correlation between the spaced receiver signals does not fall below 0.75, which is distinct from the case of the topside structures. A high degree of correlation found between spaced receiver records of scintillations have been shown to arise from the bottom-side equatorial F-region irregularities layers, indicating the absence of random changes in these irregularities or their drift velocities, which would imply that the steady, nonlin-ear states reached are stable in this case (Bhattacharyya et al., 2001; Bhattacharyya, 2004). Some of the weaker echoes associated with bottomside structures have not been detected regularly using the 18-MHz radar system, due to low sen-sitivity of the system (Tiwari et al., 2004). These echoes have been observed regularly using the Jicamarca radar with SNR exceeding 30 dB (Woodman and La Hoz, 1976). Thus, the small plume structure seen detached from the bottomside structure in Fig. 4a may indeed have a neck attaching it to the bottomside structure which may not be seen due to low sensitivity of the radar.
The duration of the observed 251 MHz scintillations was generally seen to be longer than that of radar backscatter echoes, similar to observations reported elsewhere (Basu et al., 1978; Rodrigues et al., 2004). These observations in-dicate that in the initial phase, the kilo and meter-sized irregularities evolve and exist together because meter scale size irregularities are generated due to nonlinear evolu-tion and growth of secondary plasma instabilities (Haerendel, 1974; Chaturvedi and Kaw, 1976; Costa and Kelley, 1978). In the decay phase, the meter-sized irregularities decay much more rapidly due to diffusion, whereas large-scale irregulari-ties responsible for scintillations continue to retain their high spectral intensities (Basu et al., 1978).
The relation between CI and the maximum height of the
ESF structure shows that lower values of CI (<0.5) in the
initial phase of irregularity generation can be used as a tracer for the evolution of plasma bubbles to topside, thus extending the usefulness of the inexpensive scintillation technique in studies of ESF irregularities. E×B drifts, due to perturbation electric fields associated with the GRT instability, give rise to the large random fluctuations in the irregularity drift at this time.
5 Summary
Generally, it is not possible to determine the vertical extent of ESF irregularities from scintillation data, except in the case of weak scintillations, when the presence of Fresnel oscilla-tions in the power spectrum of amplitude or phase scintilla-tions indicates a relatively thin (thickness <100 km) layer of irregularities (Yeh and Liu, 1982). In these special cases, the well-defined Fresnel minima also allow fot the estimation of the average distance of the irregularities from the ground re-ceiver, and hence of the average height of the irregularities, provided that the drift speed of the scintillation pattern on the
ground is available from spaced receiver measurements. The recently floated idea that, in the case of ESF irregularities, decorrelation of the scintillating signals recorded by spaced receivers is due to the presence of significant fluctuating per-turbation electric fields associated with the GRT instability in the initial phase of its nonlinear evolution into a plasma bubble (Bhattacharyya et al., 2001), is supported by the fol-lowing results derived from simultaneous observation of 18-MHz radar backscatter from a volume of ionosphere located about 50 km west of the ionospheric region, encountered by the signal from the FLEETSAT satellite to Tirunelveli.
1. In the initial phase of plasma bubble developments (top-side ESF), as seen in the radar HTI map, the maximum cross-correlation CI falls much below 1, due to large
decorrelation of the 251-MHz signals recorded by the two spaced receivers.
2. Vc and the spectral width tend to have higher values
in the early phase of the development of irregularities, because of the presence of perturbation electric fields associated with the GRT instability.
3. There is large variability in Voat this stage in the
de-velopment of the ESF irregularities. At the same time, radar measured irregularity vertical drift velocity has large values with the corresponding spectral widths be-ing higher.
4. After about 21:00 IST when the perturbation electric field associated with the GRT instability is eroded, it is seen that the maximum value of CIincreases, and Vc
becomes smaller, due to the decrease in the height of the irregularities as seen from the radar observations. 5. It is observed that plasma bubbles in the decay phase
and bottomside ESF structures are generally associated with high CI values.
Acknowledgements. We are grateful to the engineering staffs at Space Physics Laboratory, Vikram Sarabhai Space Centre, Trivan-drum and EGRL, Tirunelveli without whose support the observa-tions presented here would not have been made possible. This work was supported by Department of Space and Department of Science & Technology.
Topical Editor M. Pinnock thanks two referees for their help in evaluating this paper.
References
Aarons, J.: The longitudinal morphology of equatorial F-layer ir-regularities relevant to their occurrence, Space Science Reviews 63, 209–243, 1993.
Aarons, J.: Global Positioning System phase fluctuations at auroral latitudes, J. Geophys. Res., 102, 17 219–187 232, 1997. Aarons, J., Lin, B., Mendillo M., K., and Condrescu, M.: Global
Positioning System phase fluctuations and ultraviolet images from the Polar satellite, J. Geophys. Res., 105, 5201–5214, 2000.
D. Tiwari et al.: Simultaneous radar and spaced receiver VHF scintillation observations 1427
Basu, S., Basu, S., Aarons, J., Maclure, J. P., and Cousins, M. D.: On the coexistence of kilometer- and meter-scale irregularities in the nighttime equatorial F region, J. Geophys. Res., 83(A9), 4219–4226, 1978.
Basu, S., MacKenzie, E., and Basu, S.: Ionospheric constraints on VHF/UHF communications links during solar maximum and minimum periods, Radio Sci., 23(3), 363–378, 1988.
Basu, S., Kudeki, E., Basu, C. E., Valladares, C. E., et al.: Scintil-lations, plasma drifts, and neutral winds in the equatorial iono-sphere after sunset, J. Geophys. Res., 101(A12), 26 795–26 809, 1996.
Bhattacharyya, A., Franke, S. J., and Yeh, K. C.:Characteristic velocity of equatorial F-region irregularities determined from spaced receiver scintillation data, J. Geophys. Res., 94, 11 959– 11 969, 1989.
Bhattacharyya, A., Basu, S., Groves, K. M., Valladares, C. E., and Sheehan, R.: Dynamics of equatorial F region irregularities from spaced receiver scintillation observations, Geophys. Res. Lett., 28, 119–122, 2001.
Bhattacharyya, A. and Basu, S.: Space weather effects on transiono-spheric radio wave propagation, in: The Review of Radio Sci-ence 1999–2002, edited by: Ross Stone, W., New Jersey, IEEE Press, Chapter 26, 569–596, 2002.
Bhattacharyya, A.: Role of E region conductivity in the develop-ment of equatorial ionospheric plasma bubbles, Geophys. Res. Lett., 31, L06806, doi:10.1029/2003GL018960, 2004.
Briggs, B. H.: The analysis of spaced sensor records by correlation techniques, Handbook of MAP, Vol. 13, 166–186, 1984. Chaturvedi, P. and Kaw, P. K.: An interpretation for power
spec-trum of spread F irregularities, J. Geophys. Res., 81, 3257–3260, 1976.
Costa, E. and Kelley, M. C.: On the role of steepened structures and drift waves in equatorial spread F, J. Geophys. Res., 83, 4359– 4364, 1978.
Engavale, B., Jeeva, K., Nair, K. U., and Bhattacharyya, A.: So-lar flux dependence of coherence scales in scintillation pattern produced by ESF irregularities, Ann. Geophys., 23, 3261–3266, 2005.
Haerendel, G.: Theory of equatorial spread F, unpublished report, Max Planck Institut fur Physik und Astrophysik, Garching, Ger-many, 1974.
Hysell, D. L.: An overview and synthesis of plasma irregularities in the equatorial spread F, J. Atmos. Terr. Phys., 62, 1037–1056, 2000.
Hysell, D. L., Chun, J., and Chau, J. L.: Bottom-type scattering layers and equatorial spread F, Ann. Geophys., 22, 4061–4069, 2004.
Hysell, D. L. and Kudeki, E.: Collisional shear instability in the equatorial F region ionosphere J. Geophys. Res., 109, A11 301, doi:10.1029/2004JA010636, 2004.
Janardhanan, K. V., Ramakrishna Rao, D., Viswanathan, K. S., Kr-ishna Murthy, B. V., Shenoy, K. S. V., Mohankumar, S. V., Ka-math, K. P., Mukundan, K. K., Sajitha, G., Shajahan, M., and Ayyappan, C.: HF backscatter radar at the magnetic equator: System details and preliminary results, Indian J. Radio & Space Phys., 30, 77–90, 2001.
Kelley, M. C.: The earth’s ionosphere: Plasma physics and electro-dynamics, Academic Press, San Diego, Calif., 1989.
Rodrigues, F. S., de Paula, E. R., Abdu, M. A., Jardim, A. C., Iyer, K. N., Kintner, P. M., and Hysell, D. L.: Equatorial spread F irregularity characteristics over S˜ao Lu´ıs, Brazil, using VHF radar and GPS scintillation techniques, Radio Sci., 39, RS1S31, doi:10.1029/2002RS002826, 2004.
Sekar, R. and Raghavarao, R.: Role of vertical winds on the Rayleigh-Taylor mode instabilities of the night-time equatorial ionosphere, J. Atmos. Terr. Phys., 49, 981–985, 1987.
Sultan, P. J.:Linear theory and modeling of the Rayleigh-Taylor in-stability leading to the occurrence of equatorial spread F, J. Geo-phys. Res., 101, 26 875–26 891, 1996.
Tiwari, D., Patra, A. K., Devasia, C. V., Sridharan, R., Jyoti, N., Viswanathan, K. S., and Subbarao, K. S. V.: Radar observations of 8.3 m scale equatorial spread F irregularities over Trivandrum, Ann. Geophys., 22, 911–922, 2004.
Woodman, R. F.: Spectral moment estimation in MST radars, Radio Sci., 20, 1185–1195, 1985.
Woodman, R. F. and La Hoz C.: Radar observations of F region equatorial irregularities, J. Geophys. Res., 81, 5447–5466, 1976. Yeh, K. C. and Liu, C. H.: radio wave scintillations in the iono-sphere, Proceedings of the IEEE, vol 70, No. 4, 324–360, 1982.