HAL Id: hal-01980206
https://hal.sorbonne-universite.fr/hal-01980206
Submitted on 14 Jan 2019HAL is a multi-disciplinary open access
archive for the deposit and dissemination of sci-entific research documents, whether they are pub-lished or not. The documents may come from teaching and research institutions in France or abroad, or from public or private research centers.
L’archive ouverte pluridisciplinaire HAL, est destinée au dépôt et à la diffusion de documents scientifiques de niveau recherche, publiés ou non, émanant des établissements d’enseignement et de recherche français ou étrangers, des laboratoires publics ou privés.
Prediction of line shape parameters and their
temperature dependences for CO 2 –N 2 using
molecular dynamics simulations
H. Nguyen, N. Ngo, H. Tran
To cite this version:
H. Nguyen, N. Ngo, H. Tran. Prediction of line shape parameters and their temperature dependences for CO 2 –N 2 using molecular dynamics simulations. Journal of Chemical Physics, American Institute of Physics, 2018, 149 (22), pp.224301. �10.1063/1.5063892�. �hal-01980206�
Prediction of line shapes parameters and their temperature dependences for CO2-N2 using molecular dynamics simulations
H. T. Nguyen1,2,3, N. H. Ngo1,* and H. Tran2,†
1 Faculty of Physics, Hanoi National University of Education, 136 Xuan Thuy, Cau Giay,
Hanoi, Viet Nam
2 Laboratoire de Météorologie Dynamique, IPSL, CNRS, Sorbonne Université, École normale
supérieure, PSL Research University, École polytechnique, F-75005 Paris, France
3 REMOSAT, University of Science and Technology of Hanoi (USTH), Vietnam Academy of
Science and Technology (VAST)
Abstract
We show in this paper that requantized classical molecular dynamics simulations (rCMDS) are capable to predict various refined spectral-shape parameters of absorption lines with high precision. These simulations were performed for the CO2-N2 system. Combining classical
molecular dynamics simulations and a requantization procedure, we computed the auto-correlation function of the CO2 dipole moment responsible for the absorption transition. Its
Fourier-Laplace transform directly yields the spectrum. Calculations were made for two temperatures, 200 and 296 K, at 1 atm and for a large range of the Doppler widths, from the near-Doppler regime to the collision-dominant regime. For each temperature and each line, the spectra calculated for various Doppler widths were simultaneously fit with the Hartmann-Tran (HT) profile. This refined profile, which takes into account the effects of the speed dependent collisional line broadening, the Dicke narrowing and the collisional line mixing, was recommended as a reference model to be used in high-resolution spectroscopy (instead of the simplified Voigt model). The HT parameters retrieved from rCMDS-calculated spectra were then directly compared with those deduced from high-precision measurements [Wilzewski et al, JQSRT, 206, 2018, 296-305]. The results show a very good agreement, even for those parameters whose influence on the spectra is very small. Good agreement is also obtained between measured and predicted temperature dependences of these parameters. This demonstrates that rCMDS is an excellent tool, highly competitive with respect to high quality measurements for precise line-shape study.
1. Introduction
It is now widely known that accurate line-shape modeling is essential to meet the precision requirements of laboratory measurements and a wide variety of applications such as atmospheric remote sensing (e.g.1–4), Doppler thermometry (e.g.5–7), amount of gas metrology
(e.g.8–10) (see also Ref. [11] and references therein). To this aim, it is recommended12 that the *Corresponding author: [email protected]
Hartmann-Tran (HT)13,14 profile be used to replace the usual Voigt model. The HT profile
accounts for various collisional effects affecting the spectral line shape: the collision-induced line broadening and shifting and their speed dependences; the velocity changes due to collisions and the temporal correlation between changes of the translational and rotational motions. It was shown that this profile can model measured spectra of various molecular systems to within a few 0.1 % (e.g.15–23). The international spectroscopic database HITRAN24 now provides
parameters for this profile when available. However, addressing the precision and accuracy requirements of wide-ranging applications as well as populating spectroscopic databases with HT parameters constitutes a huge amount of experimental and data analysis effort. Indeed, line-shape parameters are usually obtained from fits of laboratory measured spectra. The correct use of the HT profile for spectra analysis requires two key conditions. First, because of the large number of parameters involved and searched for, a multi-spectrum fitting technique applied to spectra measured over a large pressure range must be used12. Second, high signal-to-noise ratio
spectra are needed. Both conditions are not easily met for many molecular systems, over wide spectral ranges and for various pressure and temperature conditions. Furthermore, even experimental multi-spectrum fits could also suffer from correlations. Independent theoretical predictions can thus be very helpful.
In this paper, we show that requantized classical molecular dynamics simulations (rCMDS) can predict many line-shape parameters with high accuracy. Previously, CMDS were shown to be a powerful tool for the prediction of various characteristics of a gaseous medium. For instance, CMDS were successfully used to calculate the mass diffusion coefficient (e.g.25– 29), the collisions-induced line broadening26, the collisions-induced velocity changes rates25,30.
Starting from an accurate intermolecular potential and using first principle equations, CMDS provide the time evolution of the considered molecular system. The Fourier-Laplace transform of the auto-correlation function (ACF) of the dipole moment (or of the polarizability) computed by CMDS, then directly yields the infrared (or Raman) spectra. In this manner, CMDS were used to predict the absorption in the far wing of the 3 band of CO226,31, absorptions induced by
collisions in the far infrared for pure CO232, pure N233 as well as for N2 and CO2 in collision
with H2O34. Furthermore, when an appropriate requantization procedure35 is used, CMDS can
even predict the shapes of isolated transitions29,35–39. Indeed, fits of measured spectra and
rCMDS-calculated ones with the Voigt profile showed that the obtained collisional (Lorentz) line widths are in good agreement and that the Voigt-fit residuals are also very consistent29,35– 39. In this work, a more advanced step in the use of rCMDS to study spectral line shapes is made
by directly predicting the HT profile parameters. For that, we first use rCMDS to calculate absorption spectra. The latter are then fit to deduce all the HT parameters. This was done for CO2 diluted in N2 for two different temperatures and from the near Doppler to the practically
purely collisional regimes. The quality of the prediction is examined by directly comparing the obtained parameters with those determined from fits of high quality measurements using the same profile40.
This paper is organized as follows: In Sec. 2, we describe the rCMDS. The analysis procedure of the simulated spectra is presented in Sec. 3. The results are presented and discussed in Sec.4 while the conclusion and perspectives of this work are summarized in Sec. 5.
2. Requantized classical molecular dynamics simulations (rCMDS) for CO2-N2
CMDS were performed for the first time for the CO2-N2 system using equations
described in41. CO
2 and N2 molecules are considered as rigid rotors. A site-site functional form
between CO2 and N2 molecules. For that, the molecular geometries, the charges and sites were
taken from Ref.42 and Ref.43 for CO2 and N2, respectively. The atom-atom contribution was
calculated as a 12-6 Lennard-Jones potential whose parameters were deduced using usual combination laws44 and parameters for CO2-CO242 and N2-N243 interactions. The latter were
successfully used to predict non-Voigt effects on the line shapes of pure CO229 and H2O-N245.
The molecules were considered as rigid rotors and all the effects of vibrational motion were disregarded in the calculations.
Calculations were made for the temperatures of 200 K and 296 K at 1 atm for CO2-N2
mixtures with 50 % of CO2, using the IBM Blue Gene/P computer of the Institut du
Dévéloppement et des Ressources en Informatique Scientifique. Since only CO2-N2 interactions
were taken into account, this is equivalent to a mixture of CO2 infinitely diluted in 0.5 atm of
N246. For each temperature, a total number of about 6 × 10⁸ molecules was considered. This is
the first time that such a large number of molecules were considered in this type of calculations, leading to a high signal-to-noise ratio of the calculated spectra (see Fig. 1, for instance). The molecules were treated in parallel in more than thirty thousand boxes, each containing 20 000 molecules. Note that to make these calculations, an equivalent of 270 000 hours on a single computer was needed. We therefore limited the calculations to 200 K and 296 K only. The molecules were initialized in the boxes as follows: For each molecule, the center-of-mass position was randomly chosen with the constraint that molecules should be separated from each other by distances of at least 9 Å. This ensures that no situation involving pairs of unphysically strongly interacting molecules is generated. This condition thus imposes the use of a temporization time in the calculations, which is about 20 ps. Translational and angular speeds verifying the Maxwell-Boltzmann distribution were initialized. Random center-of-mass velocity vector and molecular axis orientation were attributed. The parameters (center-of-mass position, velocity, angular momentum, and molecular orientation) describing the classical state of each molecule were then computed for each time step (up to 900 ps). A requantization procedure, as done in Ref.[35] for pure CO2, was applied to the classical rotation of the
molecules. Specifically, for a molecule of rotational angular momentum , we find the (even) integer for which / , where is the moment of inertia, is the closest to . This corresponds to matching the classical rotational frequency with the quantum position of the P branch lines. Once is found, is requantized by applying the change / while its orientation is kept unchanged. This P branch requantization implies that the calculated R branch spectrum will be the exact symmetric of the P branch. The auto-correlation function of the dipole moment, assumed along the molecular axis (as the case for the asymmetric stretching absorption bands of CO2, for instance), was then calculated during the rCMDS. The Doppler effect associated to
the translational motion was taken into account in this auto-correlation function35. For each
temperature, eight values of the Doppler width Γ (e.g. ranging from 0.0028 cm-1 to 0.28 cm-1
at room temperature) were used in the calculations. This provided a large set of values of the ratio Γ /Γ (e.g. from about 0.13 to 13, at room temperature, Γ being the Lorentz width), covering a range from the near purely Doppler to collision-dominant regimes. Note that since all the effects of vibrational motion were disregarded in our rCMDS, this corresponds to eight calculations at eight values of pressure with a unique Doppler width. Finally, the normalized absorption coefficient was obtained as the Fourier-Laplace transform of the auto-correlation function of the dipole moment. The spectra were thus calculated without the use of any adjustable parameter. Note that our rCMDS do not take into account the dephasing of the dipole, which is associated with the fact that the effects of intermolecular interactions for molecules in the upper and lower states of the optical transitions are different. Consequently, the calculated spectra do not show any pressure shift.
3. Analysis procedure
Spectra calculated by rCMDS for each temperature were fit with the Hartmann-Tran (HT) profile13,14 including the first order line-mixing47. Within this approach, the absorption
coefficient versus wavenumber (cm-1) is expressed as13,14
Re Im . (1)
In Eq. (1), Y is the first-order line-mixing parameter where is the pressure-normalized coefficient, which accounts for the coupling between the considered line and other lines. is the line area. The area-normalized line shape, , is, in general, a function of eight parameters13,14, i.e.,
, , , , , , , , (2)
with 0 the unperturbed position of the line. The HT model takes into account four main
processes affecting the shape of an isolated line in the binary-collision regime13,48. The first
one is the Doppler broadening, taken into account through the Doppler width . The second effect is the collision-induced velocity changes (VC) (Dicke narrowing), which is described through the hard-collision model49,50 in terms of the rate of velocity-changing collisions (or
the Dicke narrowing frequency). This model also takes into account the speed dependences of the collisional half-width and shift , modeled by the quadratic law51,52, i.e.
⁄ 3 2⁄ in which 2 ⁄ is the most probable speed for an absorbing molecule of mass . Finally, the temporal correlation between velocity-changing and internal-state-velocity-changing collisions is accounted for through the correlation parameter . The parameters of the HT profile vary simply with the total pressure : , and are constant while , , , and are proportional to (with the corresponding
pressure-normalized coefficients: / , / , / , / and / ).
In this work, we used a (multi-fitting) procedure in which spectra of the same line, calculated for various Doppler width values, were simultaneously adjusted. In the fits, the Doppler widths were fixed to values used in the simulations. For each line, the area , the position and a linear base line were adjusted individually while the line-shape parameters were constrained to be the same for all spectra. The pressure-shifting coefficients and were fixed to zero since no pressure shift was taken into account in our CMDS. Several tests showed that we cannot retrieve all the remaining parameters of the HT profile. This is probably due to the limited signal-to-noise ratio of the rCMDS-calculated spectra (i.e. from 500 to 5000, depending on the line and on the considered Doppler width). We therefore chose to fix the correlation parameter to zero (=0) and the HT profile thus corresponds to the qSDHC (quadratic speed dependent hard collision)53 limit. Note that this approximation can be safely
used for systems for which the frequency of velocity-changing collisions (characterized by the Dicke narrowing parameter) is much smaller than that of the internal-state changing collisions (represented by the line-broadening coefficient). This condition is fully satisfied for the CO2/N2
system, as can be observed in Table 1.
For each line, the line-broadening coefficient 0, its speed dependence component 2,
the Dicke narrowing parameter and the first-order line-mixing coefficient were retrieved for each temperature. Their temperature dependences were then represented, as also done in the experiment40, by the usual power law:
with T0 = 296K and is either , , or and the temperature dependence exponent.
From the values of obtained at 200 K and 296 the temperature exponent was obtained for each line. The obtained results are presented in the next section.
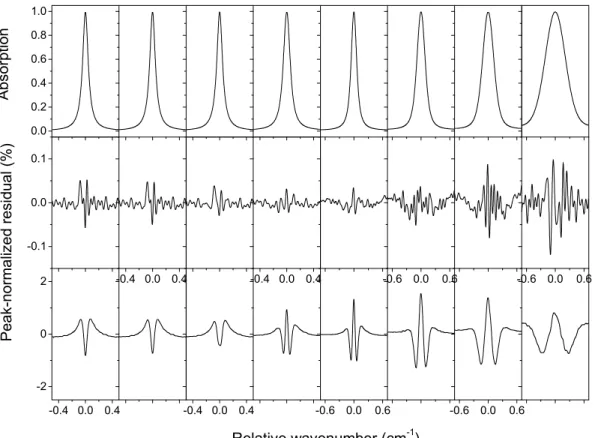
Examples of spectra of the P(10) line, calculated by rCMDS at T=200 K, PN2=0.5 atm
and for various Doppler widths are shown on Fig. 1 together with the residuals obtained from their multi-fits with the qSDHC model. This shows that the qSDHC profile leads to very good fits (within 0.1 %) of the rCMDS-calculated spectra, the remaining residuals are mostly due to numerical noises of the calculations and not to the used line shape. For comparison, fit residuals obtained with the Voigt profile are also presented where large signatures (up to 2 %) can be observed.
Fig. 1: Example of rCMDS-calculated spectra for N2-broadened CO2 (top panel) and the
corresponding residual obtained from multi-fits of these spectra with the qSDHC profile (middle panel) and with the usual Voigt profile (lowest panel). The example given here is for the P(10) line calculated at T=200 K, PN2=0.5 atm. From the left to the right, the Doppler width
is 0.0023, 0.0046, 0.0091, 0.0274, 0.0382, 0.0764, 0.1145 and 0.2291 cm-1. 4. Results and discussions
In this section, we present the line-shape parameters obtained from fits of the rCMDS-calculated spectra using the qSDHC profile and compare them to those obtained from analyses of measured spectra using the same profile. Since it is well known that spectroscopic parameters depend on the line shape used to model the measured (or calculated) spectrum, it is very
0.0 0.2 0.4 0.6 0.8 1.0 Ab so rp tion -0.1 0.0 0.1 Peak -normal ize d resi dual (%) -0.4 0.0 0.4 -0.6 0.0 0.6 -0.6 0.0 0.6 -0.4 0.0 0.4 -2 0 2 -0.4 0.0 0.4 -0.6 0.0 0.6 Relative wavenumber (cm-1) -0.6 0.0 0.6 -0.4 0.0 0.4
important that we compare parameters obtained with the same profile. To this aim, we used the measured results in the 3 band presented in Wilzewski et al40 since it is, to the best of our
knowledge, the only one using the qSDHC profile for N2-broadened CO2 lines. Furthermore, it
considered wide pressure and temperature ranges (see Table 1 of Ref. [40]), the instrumental influence on the measured spectra was carefully taken into account and a detailed analysis of the uncertainties was conducted40.
Note that, as in29,35, our requantization scheme was based on a matching of the classical
rotational frequency with the quantum position of the P branch lines. As a result, we consider here P branch lines only. The obtained results are listed in Table 1 and presented and discussed in the following sub-sections.
4.1 The line-broadening coefficient and its temperature dependence
Fig. 2: Comparison between line broadening coefficients deduced from fit of rCMDS-calculated spectra (present study-PS, black squares) with the qSDHC profile and those of Ref.[40] (blue triangles), obtained from fits of FTS measurements with the same profile. In the lower and upper layers are results at 296 K and 200 K, respectively.
Figure 2 shows comparisons between the N2-broadening coefficient, , of CO2 lines
obtained from our calculations and those retrieved from experimental spectra40 versus the
rotational quantum number | | ( and 1 for P and R branches lines,
respectively, with the rotational quantum number of the lower level of the line), for 200 K and 296 K. For lines with | | greater than 40, due to their weak signal-to-noise ratio, it was impossible to fit the rCMDS-calculated spectra with the qSDHC profile. As mentioned in the previous section, the values at a given temperature were obtained directly from fits of rCMDS-spectra calculated at the same temperature. The uncertainties of the rCMDS-predicted values are not reported here since it is almost impossible to accurately determine them. Indeed, this
0 5 10 15 20 25 30 35 40 65 70 75 80 85 90 95 0 5 10 15 20 25 30 35 40 90 95 100 105 110 115 120 125 10 3 0 (cm -1 /a tm) m 296 K PS
Experimental values of Ref. [40]
would require the determination of those due to the used intermolecular potential, to the numerical approaches used in the rCMDS, to the retrieval of the parameters searched for in the fits. For the experimental data, the values of 296 and the corresponding uncertainties were directly taken from the supplementary data of Ref. [40] while 200 were calculated using the power law [Eq. (3)] with the temperature exponents, , also given in the supplementary data of Ref. [40]. As can be seen in Fig. 2, for both temperature conditions, our CMDS-deduced are in very good agreement with the experimental ones with some systematic underestimation of the measured line broadening observed for low values of | |. The averaged differences are 0.9 (±0.6) % and 1.1 (±0.8) % at 200 K and 296 K, respectively. Figure 3 shows the comparison between the temperature exponent deduced from rCMDs calculations and the experimental values40. As can be observed, for | | 20, the
predicted values of is smaller than the experimental value while it is larger for | | 20. The “non-smooth” behavior of rCMDS-deduced with | | is probably due to the limited signal-to-noise ratio of the calculated spectra but also to the limited values of temperature considered in the calculations (i.e. at 200 and 296 K only). They also give an idea about the uncertainty of our predicted values. Overall, the average difference between the rCMDS-deduced values and those of Wilzewski et al40 is 2.9 (±1.5) %. Starting from the same values of
the line-broadening coefficient at reference temperature (i.e. 296 K), this difference in corresponds to a mean difference of about 1 % on the values of at 200 K, for instance.
Fig. 3: The temperature exponent parameter [see Eq. (3)] for the broadening coefficient of N2
-broadened CO2 lines, predicted from rCMDS and comparison with measured values of
Wilzewski et al.40
The results presented in Figs. 2 and 3 show that our rCMDS calculations can predict the line broadening coefficients for various temperature conditions with a precision of a few percent. Although such an agreement is exceptional for a classical treatment of molecular rotation, it
0 5 10 15 20 25 30 35 40 0.66 0.68 0.70 0.72 0.74 0.76 0.78 0.80 0.82 PS
Experimental values of Ref. [40]
Te mp er at ur e e xp on en t of 0 , n 0 m
may be not sufficient for the rCMDS-predicted to be directly used in precise spectra modeling. In fact, a 1% of difference in the collisional broadening can lead to up to 1% of difference in absorption, thus beyond the precision requirement of many applications. Therefore, precise laboratory measurements are still needed for the determination of . As shown in Refs. [46,54,55] and later in this paper, if we can predict all the higher-order line-shape parameters (e.g. , or ), the value of can be easily and accurately determined using measured spectra.
4.2 The speed dependence of the line width and its temperature dependence
The rCMDS-predicted values for the speed dependence parameters are plotted in Fig. 4a for the two considered temperatures. Experimental values of Ref. [40] are also reported. As can be observed, a very good agreement between the predicted and experimental values of is obtained. Their average difference is only 5 and 10 % at 296 K and 200 K, respectively. This is the first time that this high-order line-shape parameter is predicted from purely theoretical calculations with this precision. From the values of obtained at 200 K and 296 K, we then computed the temperature exponent [see Eq .(3)] which are plotted in Fig. 4b, together with those deduced from measured spectra40. As can be seen, the theoretical and experimental results
are in rather good agreement, with mean values (averaged over all the considered rotational quantum numbers) of 0.51 and 0.46, respectively. Again, recall that the part of the line-to-line variations of the predicted parameters is not physically meaningful and results from the noise on the calculated spectra, as obvious for .
Fig. 4: In the left panel is the comparison between the speed dependence parameter , predicted from rCMDS and the experimental values of Wilzewski et al40 for 296 (top) and 200 K (bottom).
0 5 10 15 20 25 30 35 40 4 5 6 7 8 9 0 5 10 15 20 25 30 35 40 5 6 7 8 9 10 11 m 10 3 2 (c m -1 /a tm) 296 K 200 K PS
Experimental values of Ref. [40] (a) 0 5 10 15 20 25 30 35 40 -0.2 0.0 0.2 0.4 0.6 0.8 1.0 n 2 m (b)
In the right panel is the same comparison but now for the temperature exponent of this parameter, i.e. .
Both the predicted and experimental values of and , plotted in Figs. 3 and 4b show that, within the quadratic speed dependence model for the line width, the temperature dependences of and are different. This is in opposition with the often-used approximation in which the temperature dependences of and are assumed to be the same56–59. The mean
values of our rCMDS-predicted and are 0.73 and 0.52, respectively, leading to a difference of about 30 %. Starting from the same value of at 296 K, this difference, although large, leads to less than 10 % of difference in the values of at 200 K only. Therefore, the approximation in which the temperature dependences of and are equal is nevertheless acceptable and can be rather safely used for measured spectra analysis.
In Fig. 5, we compare the rCMDS-predicted values for the ratio 2/0 and the
corresponding ones obtained from measured spectra by Wilzewski et al40 for T = 296 K. The
values of Refs. [15,59] and [57,58] the 1.6 and 2.1 m regions and for air-broadened CO2, are
also reported for comparison. First, we can observe that the experimental values of Bui et al15
and Ghysels et al59 are in very good agreement with our predicted values as well as with those
of Wilzewski et al40. The results of Refs. [57,58] show large differences with the others which
may be due to the line shape used to fit the measured spectra. In fact, in Refs. [57,58], the quadratic speed dependent Voigt profile (qSDV) was used while Refs. [15,40,59] and the present study used the qSDHC model. In order to check this, we used the qSDV profile to fit the rCMDS-calculated spectra. The results show that the ratios 2/0 obtained this way are
indeed larger than those obtained with the qSDHC. This can be explained by the fact that in general, both Dicke narrowing and speed dependence effects lead to a narrowing of the line. In the qSDV profile, the Dicke narrowing effect is neglected, which is compensated by an increase of the retrieved value of . In addition of the line-shapes used, the difference between the results of Refs. [57,58] and the other studies, observed in Fig. 5 could also come from the difference in the values of the pressure of the fitted spectra, from the way that the spectra were fitted. Discussing all the possible sources of difference is beyond the scope of this paper.
0 5 10 15 20 25 30 35 40 0.04 0.05 0.06 0.07 0.08 0.09 0.10 0.11 0.12 0.13 PS Wilzewski et al [40] Devi et al [57] Benner et al [58] Ghysels et al [59] Bui et al [15] 2 / 0 m
Fig. 5: Comparison between the values of 2/0 predicted by rCMDS and the
experimentally-deduced ones by Wilzewski et al40 at 296 K. The temperature-independent values of 2/0,
deduced from measured spectra of 57 (red circles), 58 (green stars), 59 (magenta squares) and 15
(dark yellow triangles) are also reported for comparison.
4.3 The Dicke narrowing parameter and its temperature dependence
The rCMDS-predicted Dicke narrowing parameters obtained at 200 K and 296 K are presented in Fig. 6a, together with the experimental values of Ref. [40] while the corresponding temperature exponents are plotted in Fig. 6b. As can be observed in Fig. 6a, the same rotational dependence (i.e. increases with increasing rotational quantum number) is observed for the experimental and rCMDS-predicted values of . However, our calculated values are much smaller than those of Ref. [40]. In the considered pressure range, the impact of this parameter on the measured spectra is much smaller than that of other parameters such as , or . This explains that the relative experimental uncertainty of this parameter is much larger than that of the other parameters (see also Fig. 12 of Ref. [40]). We can assume that the uncertainty on the rCMDS-predicted parameters is more or less on the same order as for the experimental values40
due to similar signal-to-noise ratios of the measured and calculated spectra. Within these uncertainties, the measured and rCMDS-predicted values of (as well as the temperature dependence exponents) are rather in good agreement.
Fig. 6: The same as figure 4 but for the Dicke narrowing coefficient .
Another possible explanation for the difference between the predicted and measured values of is the correlation between the speed dependence and the Dicke narrowing parameters. In fact, the effect of speed dependent collisional width and of velocity changes due to collisions (i.e. Dicke effect) is very similar, both leading to a narrowing of the line. It is thus
0 5 10 15 20 25 30 35 40 0 2 4 6 8 10 12 0 5 10 15 20 25 30 35 40 0 2 4 6 8 10 12 296 K 200 K PS Experimental value of [40] 10 3 (cm -1 /at m ) m (a) 0 5 10 15 20 25 30 35 40 -2.0 -1.5 -1.0 -0.5 0.0 0.5 1.0 1.5 2.0 2.5 3.0 3.5 4.0 4.5 n m (b)
difficult to accurately simultaneously retrieve these two parameters from measurements. As shown in Tran et al60 for instance, the relative influence of the Dicke effect is non negligible at
pressures such that the Doppler width is larger or comparable to the collisional one. In contrast, the relative contribution of the speed dependence is non negligible for the whole pressure range. In order to minimize the correlation between the Dicke narrowing and the speed dependence effects, spectra measured in a wide pressure range are used in a multi-fitting procedure12,61 for
parameters retrieval. The difference observed for the rCMDS-predicted and measurements-deduced values of can thus result from the difference in the pressure range (or the collisional to Doppler widths ratio range) used in the fitting procedure. In Wilzewski et al40, for each
temperature condition, five spectra measured at five pressures were used in the fits while in our calculations, we considered eight values of the collisional to Doppler widths ratio. More specifically, at 296 K and 200 K, Wilzewski et al40 used pressures for which ≅
0.3; 1.0; 3.4; 10.1; 33.7 and 0.6; 1.7; 5.6; 16.9; 56.2 respectively, while we used 0.1; 0.3; 0.4; 0.8; 1.1; 3.3; 6.5; 13.1 and 0.2; 0.4; 0.7; 1.3; 1.8; 5.5; 10.9; 21.8 for at 296 K and 200 K, respectively. We thus do not have the same range and the values of in the rCMDS spectra should be more adapted for a precise determination of .
4.4 The first-order line-mixing parameter and its temperature dependence
Fig. 7: The same as figure 4 but for the first-order line-mixing parameter .
The comparison between the rCMDS-predicted first-order line-mixing parameters and the experimental values40 for T = 200 and 296 K is shown in Fig. 7a while the corresponding
temperature dependence exponents are compared in Fig. 7b. As shown in Fig. 7a, a good agreement between the rCMDS-predicted and experimental values of is observed, especially for low values of | |, for the two temperatures. Note that, in the requantization procedure used
-40 -35 -30 -25 -20 -15 -10 -5 0 -20 -15 -10 -5 0 5 10 15 20 -40 -35 -30 -25 -20 -15 -10 -5 0 -20 -15 -10 -5 0 5 10 15 20 10 3 ( a tm -1 ) m 296 K PS Experimental values of [40] 200 K (a) -40 -35 -30 -25 -20 -15 -10 -5 0 -1 0 1 2 3 4 5 6 7 n m (b)
in our CMDS, we did not take into account the centrifugal distortion effect, this can explain the large difference observed at high | |. In the resulting rCMDS spectra, the successive P(J) lines are equally spaced which is not the case in the true 3 band of CO2. This problem can be
corrected by imposing directly the true rotational line positions, taken from a spectroscopic database24, as done in Ref. [62]. However, Fig. 7a shows that, although the relative line
positions of rCMDS calculated spectra are slightly different of the true ones, the first-order line-mixing parameters47 (which depend on the relative line positions) predicted are in very good
agreement with measured values. Fig. 7b shows that the temperature dependence exponents predicted are also in good agreement with the experimental values40. This demonstrates the
capability of rCMDS to predict line-mixing effects for molecular systems like CO2.
4.5 Spectra comparison
Although the results presented in the previous sections show that rCMDS can precisely predict the various line-shape parameters for CO2 in N2, differences remain between the
calculated and measured parameters (e.g. Fig. 6). In order to evaluate the spectral consequences of these differences, comparison between the absorption spectra themselves is relevant. For this exercise, we used the experimental40 line-shape parameters ( , , , to simulate “reference
spectra” for the P(10) and P(20) lines under the pressure conditions of the measurements of Ref.40, using the qSDHC profile. These spectra are then multi-fit with the same profile in which
, , are fixed to values predicted by rCMDS (c.f. Table 1) and only is adjusted. This fitting procedure will be from now all denoted fixed_qSDHC. Fig. 8 shows the fit residuals obtained for all considered pressures. For comparison, multi-fits of the “reference spectra” with the Voigt profile were also made and presented in the same figure. As can be seen, the use of rCMDS-predicted values for , , leads to a very good agreement between the “reference” and the adjusted spectra, with residuals within 0.2 %. These are much smaller than those obtained with the Voigt profile (up to 2 %). Note that although the qualities of fit are very different for the two fitting procedures, the same number of adjustable parameters (i.e. line position, line area and line broadening) were used. Therefore, here the use of the qSDHC model to analyze measured spectra is not more complicated than with the Voigt profile.
The line broadening coefficients obtained from the fixed_qSDHC fitting procedure are 0.08232 and 0.07480 cm-1/atm for the P(10) and P(20) lines, very close to the reference
values (those of Wilzewski et al40), which are 0.08216 and 0.07486 cm-1/atm. In order to go
further, we used only one “reference spectrum” in the fixed_qSDHC fitting procedure to determine . We chose this “reference spectrum” in the collision-dominant regime for which the influence of the Dicke narrowing is negligible. “Reference spectra” at 300 and 1000 mbar were thus retained for the determination of . The obtained results of for the P(10) line are 0.08231 and 0.08234cm-1/atm at 300 and 1000 mbar, respectively. For the P(20) line, the two
“reference spectra” at 300 and 1000 mbar lead to the same value of which is 0.07481 cm -1/atm. These values of were then used together with the predicted values of , , to
compute spectra for all other pressure conditions. Direct comparisons between spectra calculated this way and the “reference” ones showed that their differences are very close to those shown in Fig. 8 (i.e. from fitting simultaneously all spectra at various considered pressures), with a maximum residual of 0.25 %, observed for the P(20) line at 30 mbar. These results demonstrate that if we can predict all the high-order line-shape, accurate value of the line-broadening coefficient can be straightforwardly obtained from only one spectrum measured in the collision-dominant regime.
Fig. 8: In the top panels are the room temperature “reference spectra”, calculated with the qSDHC model and data from Wilzewski et al40 for the P(10) (a) and P(20) (b) lines of the
3
band of CO2 in N2. Fit residuals obtained from multi-fitting these reference spectra with the
same model but fixing , or to values predicted by rCMDS are plotted in the middle panels, those obtained with the usual Voigt profile are shown in the bottom panels. In black, red, green, blue and magenta are results for = 10, 30, 100, 300 and 1000 mbar.
5. Conclusions
Precise line-shape modeling is essential for high-resolution spectroscopy and applications. We showed in this paper that requantized classical molecular dynamics simulations can be used to accurately predict molecular line shapes as well as refined line profile parameters. Starting from an intermolecular potential, rCMDS were performed to calculate N2
-broadened spectra of CO2. These spectra were then fit with the phenomenological
Hartmann-Tran profile to deduce the parameters of this line shape. The values of these parameters as well as their temperature dependences were then compared with those deduced previously from high quality measurements showing a very good agreement, even for those parameters whose influence on the spectra is very small. That is the first time that some high-order line-shape parameters such as the speed dependence, the Dicke narrowing coefficient are predicted with high accuracy from experiment-independent calculations. Furthermore, we also showed that if all the high-order line-shape parameters are predicted, the line broadening coefficient can be straightforwardly and accurately determined from only one spectrum measured in the collision-dominant regime. Using the predicted high-order line-shape values as fixed parameters in the spectrum fitting of the “reference spectra” obtained from parameters directly deduced from measurements, leads to very good fit residuals (within 0.25 %). These results show that rCMDS can be used as a powerful tool, complementary to high quality measurements, to address the
-0.15 -0.10 -0.05 0.00 0.05 0.10 0.15 -0.1 0.0 0.1 fixed_qSDHC fit -0.3 -0.2 -0.1 0.0 0.1 0.2 0.3 0.0 0.2 0.4 0.6 0.8 1.0 Absorpt ion -0.15 -0.10 -0.05 0.00 0.05 0.10 0.15 -1 0 1 2 Relative wavenumber (cm-1) P eak-absorption -n ormalized residua ls (%) (a) Voigt fit -0.10 -0.05 0.00 0.05 0.10 -0.2 -0.1 0.0 0.1 0.2 -0.2 -0.1 0.0 0.1 0.2 0.0 0.2 0.4 0.6 0.8 1.0 -0.10 -0.05 0.00 0.05 0.10 -2 -1 0 1 2 Relative wavenumber (cm-1) (b)
precision and accuracy requirements of application such as atmospheric remote sensing as well as for populating spectroscopic databases with refined line-shape parameters. Similar studies on CO2/O2 and other important atmospheric systems in which the calculation of line-mixing
effect will be improved by using another requantization scheme are under investigation.
Acknowledgments
Ha Tran thanks the Institut du Développement et des Ressources en Informatique Scientifique (IDRIS) for giving access to the IBM Blue Gene/Q parallel computer. The authors from Hanoi National University of Education (HNUE) are pleased to acknowledge the financial support of this research by the National Foundation for Science and Technology Development (NAFOSTED) of Vietnam under grant number of 103.03-2018.09.
15 Line (296 K) (296 K) (296 K) (296 K) P(2) 92.85 7.26 0.42 ‐14.41 0.739 0.529 3.746 0.847 P(4) 88.73 6.66 1.83 ‐13.18 0.734 0.619 1.513 0.622 P(6) 86.24 7.17 0.78 ‐10.33 0.727 0.378 3.777 0.644 P(8) 84.23 6.98 1.65 ‐7.58 0.718 0.421 1.839 0.604 P(10) 82.16 7.32 1.11 ‐4.81 0.718 0.473 1.696 0.830 P(12) 80.36 6.79 1.95 ‐2.75 0.718 0.540 1.240 0.007 P(14) 78.64 6.54 2.53 ‐1.41 0.723 0.675 0.395 ‐0.820 P(16) 77.14 6.75 1.59 ‐0.01 0.716 0.397 2.353 1.359 P(18) 75.92 6.23 2.90 1.58 0.719 0.547 0.850 2.582 P(20) 74.86 6.20 2.83 2.29 0.716 0.430 1.172 2.670 P(22) 74.03 6.48 2.10 4.13 0.718 0.454 1.150 2.032 P(24) 73.28 5.78 3.63 4.96 0.724 0.592 0.254 1.840 P(26) 72.64 5.76 2.99 6.44 0.727 0.744 ‐0.643 1.593 P(28) 72.15 5.28 4.03 6.99 0.731 0.612 0.482 1.454 P(30) 71.67 5.62 3.08 7.69 0.730 0.637 0.121 1.471 P(32) 71.30 5.50 3.17 8.79 0.725 0.430 0.674 1.296 P(34) 70.82 5.73 2.15 9.18 0.737 0.395 1.331 1.447 P(36) 70.55 5.10 3.52 8.79 0.737 0.532 0.526 1.441 P(38) 70.21 5.24 2.49 9.32 0.732 0.307 1.637 1.593
Table 1: Line-shape parameters for N2-broadened CO2 lines, deduced from rCMDS-calculated spectra. (296 K), (296 K), (296 K) and (296
K) are the line-broadening coefficient, the speed dependence parameter of the line broadening, the Dicke narrowing coefficients (all in 10-3 cm -1/atm) and the first-order line-mixing coefficient (in 10-3 atm-1) at room temperature while , , and are the corresponding temperature
References
1 C.E. Miller, L.R. Brown, R.A. Toth, D.C. Benner, and V.M. Devi, 6, 876 (2005). 2 J.-M. Hartmann, H. Tran, and G.C. Toon, Atmos. Chem. Phys. Discuss. 9, 7303 (2009). 3 T. Delahaye, S.E. Maxwell, Z.D. Reed, H. Lin, J.T. Hodges, K. Sung, V.M. Devi, T.
Warneke, P. Spietz, and H. Tran, J. Geophys. Res. 121, 7360 (2016).
4 M. Schneider, F. Hase, J.F. Blavier, G.C. Toon, and T. Leblanc, J. Quant. Spectrosc. Radiat.
Transf. 112, 465 (2011).
5 C. Daussy, M. Guinet, A. Amy-Klein, K. Djerroud, Y. Hermier, S. Briaudeau, C.J. Bordé,
and C. Chardonnet, Phys. Rev. Lett. 98, 250801 (2007).
6 L. Moretti, A. Castrillo, E. Fasci, M.D. De Vizia, G. Casa, G. Galzerano, A. Merlone, P.
Laporta, and L. Gianfrani, Phys. Rev. Lett. 111, 060803 (2013).
7 C.F. Cheng, J. Wang, Y.R. Sun, Y. Tan, P. Kang, and S.M. Hu, Metrologia 52, S385 (2015). 8 E.R.T. Kerstel, R.Q. Iannone, M. Chenevier, S. Kassi, H.J. Jost, and D. Romanini, Appl.
Phys. B Lasers Opt. 85, 397 (2006).
9 D.A. Long, M. Okumura, C.E. Miller, and J.T. Hodges, Appl. Phys. B 105, 471 (2011). 10 A. Castrillo, H. Dinesan, G. Casa, G. Galzerano, P. Laporta, and L. Gianfrani, Phys. Rev. A 86, 052515 (2012).
11 J.-M. Hartmann, H. Tran, R. Armante, C. Boulet, A. Campargue, F. Forget, L. Gianfrani, I.
Gordon, S. Guerlet, M. Gustafsson, J.T. Hodges, S. Kassi, D. Lisak, F. Thibault, and G.C. Toon, J. Quant. Spectrosc. Radiat. Transf. 213, 178 (2018).
12 J. Tennyson, P.F. Bernath, A. Campargue, A.G. Császár, L. Daumont, R.R. Gamache, J.T.
Hodges, D. Lisak, O. V. Naumenko, L.S. Rothman, H. Tran, J.M. Hartmann, N.F. Zobov, J. Buldyreva, C.D. Boone, M.D. De Vizia, L. Gianfrani, R. McPheat, D. Weidmann, J. Murray, N.H. Ngo, and O.L. Polyansky, Pure Appl. Chem. 86, 1931 (2014).
13 N.H. Ngo, D. Lisak, H. Tran, and J.M. Hartmann, J. Quant. Spectrosc. Radiat. Transf. 129,
89 (2013).
14 N.H. Ngo, D. Lisak, H. Tran, and J.M. Hartmann, J. Quant. Spectrosc. Radiat. Transf. 134,
105 (2014).
15 T.Q. Bui, D.A. Long, A. Cygan, V.T. Sironneau, D.W. Hogan, P.M. Rupasinghe, R.
Ciuryło, D. Lisak, and M. Okumura, J. Chem. Phys. 141, 174301 (2014).
16 D.A. Long, S. Wójtewicz, C.E. Miller, and J.T. Hodges, J. Quant. Spectrosc. Radiat.
Transf. 161, 35 (2015).
17 H. Lin, Z.D. Reed, V.T. Sironneau, and J.T. Hodges, J. Quant. Spectrosc. Radiat. Transf. 161, 11 (2015).
18 V.T. Sironneau and J.T. Hodges, J. Quant. Spectrosc. Radiat. Transf. 152, 1 (2015).
19 E. Fasci, T.A. Odintsova, A. Castrillo, M.D. De Vizia, A. Merlone, F. Bertiglia, L. Moretti,
and L. Gianfrani, Phys. Rev. A 93, 042513 (2016).
20 G. Kowzan, K. Stec, M. Zaborowski, S. Wójtewicz, A. Cygan, D. Lisak, P. Masłowski, and
21 N.H. Ngo, H. Lin, J.T. Hodges, and H. Tran, J. Quant. Spectrosc. Radiat. Transf. 203, 325
(2017).
22 T.A. Odintsova, E. Fasci, L. Moretti, E.J. Zak, O.L. Polyansky, J. Tennyson, L. Gianfrani,
and A. Castrillo, J. Chem. Phys. 146, 244309 (2017).
23 D. Lisak, A. Cygan, D. Bermejo, J.L. Domenech, J.T. Hodges, and H. Tran, J. Quant.
Spectrosc. Radiat. Transf. 164, 221 (2015).
24 I.E. Gordon, L.S. Rothman, C. Hill, R. V Kochanov, Y. Tan, P.F. Bernath, M. Birk, V.
Boudon, A. Campargue, K. V Chance, B.J. Drouin, J.-M. Flaud, R.R. Gamache, J.T. Hodges, D. Jacquemart, V.I. Perevalov, A. Perrin, K.P. Shine, M.-A.H. Smith, J. Tennyson, G.C. Toon, H. Tran, V.G. Tyuterev, A. Barbe, A.G. Császár, V.M. Devi, T. Furtenbacher, J.J. Harrison, J.-M. Hartmann, A. Jolly, T.J. Johnson, T. Karman, I. Kleiner, A.A. Kyuberis, J. Loos, O.M. Lyulin, S.T. Massie, S.N. Mikhailenko, N. Moazzen-Ahmadi, H.S.P. Müller, O. V Naumenko, A. V Nikitin, O.L. Polyansky, M. Rey, M. Rotger, S.W. Sharpe, K. Sung, E. Starikova, S.A. Tashkun, J. Vander Auwera, G. Wagner, J. Wilzewski, P. Wcisło, S. Yu, and E.J. Zak, J. Quant. Spectrosc. Radiat. Transf. 203, 3 (2017).
25 H. Tran, J.-M. Hartmann, F. Chaussard, and M. Gupta, J. Chem. Phys. 131, 154303 (2009). 26 J.-M. Hartmann, C. Boulet, H. Tran, and M.T. Nguyen, J. Chem. Phys. 133, 144313 (2010). 27 N.H. Ngo, H. Tran, and R.R. Gamache, J. Chem. Phys. 136, 154310 (2012).
28 N.H. Ngo, H. Tran, R.R. Gamache, D. Bermejo, and J.-L. Domenech, J. Chem. Phys. 137,
064302 (2012).
29 G. Larcher, H. Tran, M. Schwell, P. Chelin, X. Landsheere, J.M. Hartmann, and S.M. Hu, J.
Chem. Phys. 140, 084308 (2014).
30 H. Tran, F. Thibault, and J.-M. Hartmann, J. Quant. Spectrosc. Radiat. Transf. 112, 1035
(2011).
31 J.M. Hartmann and C. Boulet, J. Chem. Phys. 134, 184312 (2011).
32 J. Hartmann, C. Boulet, and D. Jacquemart, J. Chem. Phys. 134, 094316 (2011). 33 B. Bussery-Honvault and J.-M. Hartmann, J. Chem. Phys. 140, 054309 (2014). 34 J.-M. Hartmann, C. Boulet, D.D. Tran, H. Tran, and Y. Baranov, J. Chem. Phys. 148,
054304 (2018).
35 J.-M. Hartmann, H. Tran, N.H. Ngo, X. Landsheere, P. Chelin, Y. Lu, A.-W. Liu, S.-M.
Hu, L. Gianfrani, G. Casa, A. Castrillo, M. Lepère, Q. Delière, M. Dhyne, and L. Fissiaux, Phys. Rev. A 87, 013403 (2013).
36 J.M. Hartmann, V. Sironneau, C. Boulet, T. Svensson, J.T. Hodges, and C.T. Xu, Phys.
Rev. A 87, 032510 (2013).
37 J. Lamouroux, V. Sironneau, J.T. Hodges, and J.M. Hartmann, Phys. Rev. A 89, 042504
(2014).
38 H. Tran and J.L. Domenech, J. Chem. Phys. 141, 064313 (2014).
39 T. Le, J. Doménech, M. Lepère, H. Tran, M. Lep, and T. Le, 094305, (2017).
296 (2018).
41 M.P. Allen and D.J. Tildesley, Computer Simulations of Liquids (Oxford University Press,
Oxford, 1987).
42 C.S. Murthy, S.F. O’Shea, and I.R. McDonald, Mol. Phys. 50, 531 (1983). 43 J. Bouanich, J. Quant. Spectrosc. Radiat. Transf. 47, 243 (1992).
44 J.E. Hirschfelder, C.F. Curtiss, and R.B. Bird, Molecular Theory of Gases and Liquids
(Wiley, New York, 1954).
45 N.H. Ngo, H. Tran, R.R. Gamache, D. Bermejo, and J.-L. Domenech, J. Chem. Phys. 137,
064302 (2012).
46 N.H. Ngo and J.M. Hartmann, J. Quant. Spectrosc. Radiat. Transf. 203, 334 (2017). 47 P.W. Rosenkranz, IEEE Trans Antennas Propag 23, 498 (1975).
48 D. Hartmann, J. M. Boulet, C. Robert, Collisional Effects on Molecular Spectra:
Laboratory Experiments and Models, Consequences for Applications (2008).
49 M. Nelkin and A. Ghatak, Phys. Rev. 135, A4 (1964).
50 S.G. Rautian and I.L. Sobel’man, Sov. Phys. Uspekhi 9, 701 (1967). 51 F. Rohart, H. Mader, and H. Nicolaisen, J. Chem. Phys. 101, 6475 (1994).
52 F. Rohart, A. Ellendt, F. Kaghat, and H. Mader, J. Mol. Spectrosc. 185, 222 (1997). 53 D. Lisak, D.K. Havey, and J.T. Hodges, Phys. Rev. A 79, 052507 (2009).
54 N.H. Ngo, H.T. Nguyen, and H. Tran, J. Quant. Spectrosc. Radiat. Transf. 207, 16 (2018). 55 D.D. Tran, V.T. Sironneau, J.T. Hodges, R. Armante, J. Cuesta, and H. Tran, J. Quant.
Spectrosc. Radiat. Transf. submitted, (2018).
56 D. Lisak, A. Cygan, P. Wcisło, and R. Ciuryło, J. Quant. Spectrosc. Radiat. Transf. 151, 43
(2014).
57 V.M. Devi, D.C. Benner, K. Sung, L.R. Brown, T.J. Crawford, C.E. Miller, B.J. Drouin,
V.H. Payne, S. Yu, M.A.H. Smith, A.W. Mantz, and R.R. Gamache, J. Quant. Spectrosc. Radiat. Transf. 177, 117 (2016).
58 D.C. Benner, V.M. Devi, K. Sung, L.R. Brown, C.E. Miller, V.H. Payne, B.J. Drouin, S.
Yu, T.J. Crawford, A.W. Mantz, M.A.H. Smith, and R.R. Gamache, J. Mol. Spectrosc. 326, 21 (2016).
59 M. Ghysels, Q. Liu, A.J. Fleisher, and J.T. Hodges, Appl. Phys. B Lasers Opt. 123:124, 0
(2017).
60 H. Tran, N.H. Ngo, J.-M. Hartmann, R.R. Gamache, D. Mondelain, S. Kassi, A.
Campargue, L. Gianfrani, A. Castrillo, E. Fasci, and F. Rohart, J. Chem. Phys. 138, 034302 (2013).
61 D.C. Benner, C.P. Rinsland, V.M. Devi, M.A.H. Smith, and D. Atkins, J. Quant. Spectrosc.
Radiat. Transf. 53, 705 (1995).
![Fig. 2: Comparison between line broadening coefficients deduced from fit of rCMDS- rCMDS-calculated spectra (present study-PS, black squares) with the qSDHC profile and those of Ref.[40] (blue triangles), obtained from fits of FTS measurements with the sa](https://thumb-eu.123doks.com/thumbv2/123doknet/14768894.589928/7.918.207.688.415.793/comparison-broadening-coefficients-deduced-calculated-triangles-obtained-measurements.webp)


