HAL Id: hal-00318321
https://hal.archives-ouvertes.fr/hal-00318321
Submitted on 4 Jun 2007
HAL is a multi-disciplinary open access
archive for the deposit and dissemination of
sci-entific research documents, whether they are
pub-lished or not. The documents may come from
teaching and research institutions in France or
abroad, or from public or private research centers.
L’archive ouverte pluridisciplinaire HAL, est
destinée au dépôt et à la diffusion de documents
scientifiques de niveau recherche, publiés ou non,
émanant des établissements d’enseignement et de
recherche français ou étrangers, des laboratoires
publics ou privés.
Morphology of quantified ionospheric range spread-F
over a wide range of midlatitudes in the Australian
longitudinal sector
L. A. Hajkowicz
To cite this version:
L. A. Hajkowicz. Morphology of quantified ionospheric range spread-F over a wide range of
midlati-tudes in the Australian longitudinal sector. Annales Geophysicae, European Geosciences Union, 2007,
25 (5), pp.1125-1130. �hal-00318321�
Ann. Geophys., 25, 1125–1130, 2007 www.ann-geophys.net/25/1125/2007/ © European Geosciences Union 2007
Annales
Geophysicae
Morphology of quantified ionospheric range spread-F over a wide
range of midlatitudes in the Australian longitudinal sector
L. A. Hajkowicz
Department of Physics, University of Queensland, Qld.4072, Australia
Received: 9 November 2006 – Revised: 11 April 2007 – Accepted: 7 May 2007 – Published: 4 June 2007
Abstract. Ionograms from a standard vertical-incidence ionosonde chain (nine stations), obtained over a wide range of southern latitudes (in geom.lat. range: 23◦–52◦S), were digitally scanned at 5-min intervals at nighttime (18:00– 06:00 LT) for 13 months (January 2004–January 2005). An important parameter of the F-region, so-called range spread-F (Sr), was for the first time quantified in km. Maximum in Sr was recorded at a sounding frequency of 1.8 MHz for each night and for each ionosonde station. A distinct pat-tern in the magnitude (in km) and in the percentage occur-rence of the range spread-F was present in southern win-ter only (the June solstice). The sub-auroral region (geom. lat. ≥52◦S) is characterised by consistently high spread-F (average Sr≈100 km) on 80–100 per cent of the observed nights. There is a sharp equatorward boundary in the spread-F activity in a latitudinal range: 52◦–48◦S followed by a midlatitude region (44◦–48◦S) which exhibits a peak in Sr (≈50 km) in winter only, observed on half of the nights. The midlatitude activity reaches its minimum at 42◦–43◦S, with Sr less than 20 km on one third of the nights. The low mid-latitudes (23◦–36◦S) are characterised by a strong peak in Sr again in winter, centred at about 30◦S (average Sr≈70 km) on 80 per cent of the nights. The pattern becomes largely absent during other seasons particularly in southern summer (the December solstice) when spread-F activity shifts to sub-auroral latitudes. The pattern in the occurrence of spread-F appears to have a global character as the enhanced spread-F activity is observed in the Japanese sector in local summer (i.e. the June solstice).
It appears that the midlatitude spread-F minimum is only apparent but not real. It delineates the boundary between au-rorally generated spread-F (due to travelling ionospheric dis-turbances, TIDs) and low midlatitude spread-F whose origin is not known.
Keywords. Ionosphere (Ionospheric disturbances;
Iono-spheric irregularities; Mid-latitude ionosphere)
Correspondence to: L. A. Hajkowicz (lech hajkowicz@yahoo.co.uk)
1 Introduction
Early extensive studies of spread-F in southern midlatitudes (Brisbane) by Bowman (1960) indicate that ionosonde traces display different forms. One type observed at the low fre-quency end of ionograms is characterised by the occurrence of range spread-F (Sr) which show traces of 10 km or more over the true range of the main echo at a lower sounding fre-quency (<2 MHz). At other times the low frefre-quency spread can be small but the critical frequencies are spread, form-ing so-called frequency spread-F (Sf). Bowman (1960) con-cluded that range spread is associated with the frontal struc-ture of irregularities with a linear extent of the order of 1000 km, due to the off vertical reflections of radio waves from the extended frontal irregularities. On the other hand frequency spread is due to the ionosonde echoes coming from the parts of the ionosphere close to the zenith. King (1970) suggested, from comparison of his own studies in New Zealand with those obtained in Australia, that Sr is more fundamental in studies of F-region irregularities than Sf. He concluded that range spreading consists of ridges in the F-region ionization and “the frequency spreading is sim-ply the decay product of the range spreading”. Rastogi and Woodman (1978) reported from a study of vertical incidence ionograms, combined with the ionospheric scatter radar, that echoes due to range spread are much stronger than those as-sociated with frequency spread. They suggested that: “range spread-F is caused by the existence of very strong and irregu-lar vertical gradients of ionization at the base of the F-region including structure down to the 3 m scale length”. On the other hand frequency spread-F is due to a larger scale of ir-regularities, not conducive to the radar VHF scattering. Ex-tensive study of ionospheric scintillations, from recordings of VHF transmissions from radio-satellites, indicates that range spread-F is the main cause of scintillations (Hajkowicz, 1977, 1978). Hajkowicz (1977) concluded that a difference in the spatial configuration of irregularities causing range and frequency spread leads to the preferential effect of range spread on generation of scintillations, following the model of spread-F given by Bowman (1960). The radio-scintillation
1126 L. A. Hajkowicz: Morphology of quantified ionospheric range spread-F
Fig. 1. Geographical positions of ionosonde stations used in this
study. The solid and broken lines refer to the latitudinal maxima in Sr (MAX.1 and MAX.2) and the dotted line refers to the latitudinal minimum (MIN.).
Table 1. Ionosonde stations used in this report in the
Australian-New Zealand sector. Local midnight (LM) is shown in UT.
Geog. cord. Geom. cord. LM Station: Lat.◦S Long.◦E Lat.◦S (UT) Hobart (H) 42.9 147.3 51.6 14 Christchurch (CC) 43.6 172.8 48.0 12 Canberra (C) 35.3 149.0 43.9 14 Mundaring (M) 32.0 116.3 43.4 16 Sydney (S) 33.9 150.6 42.2 14 Brisbane (B) 27.5 152.9 35.7 14 Norfolk Is. (N) 29.0 168.0 34.7 14 Townsville (T) 19.3 146.7 28.4 14 Darwin (D) 12.3 130.5 23.0 15
method tends to detect irregularities situated well away from the zenith hence scintillations would show better correla-tion with range spread than with frequency spread. Since the midlatitude scintillation model is still inadequate (due to shortage of midlatitude scintillation data) the new finding on spread-F morphology could be used as an important contri-bution to this field of ionospheric study.
Little is known about spread-F occurrence, from the real-time ionograms, at frequent real-time intervals and over a wide range of latitudes. Previous studies of this type were based on the hourly qualifying symbols (from the tables of ionospheric parameters), thus lacking the information on the magnitude of spread-F.
2 Method and results
The standard vertical-incidence ionograms from nine sta-tions, obtained at 5-min intervals at night (18:00–06:00 LT),
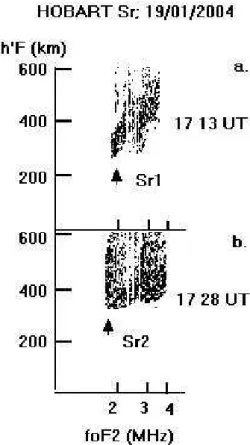
Fig. 2. Typical example of range spread-F intensified to a maximum
at 17:28 UT (03:28 LT) at a low end of the ionosonde sounding fre-quency (1.8 MHz) at a sub-auroral station Hobart; here Sr1=100 km and Sr2=200 km.
were analysed for a period: January 2004–January 2005. The digital ionosonde stations were operated and uniformly calibrated by the Australian Ionospheric Prediction Ser-vice (IPS). Figure 1 shows the geographic locations of the ionosonde stations used in this study. The geographic and geomagnetic coordinates of the stations, as well as the time of local midnight in UT, are shown in Table 1 (stations sym-bols are given in the brackets). It can be seen that the lati-tudinal coverage of the ionosphere extended from high (Ho-bart, H) to low (Darwin, D) midlatitudes. The majority of the stations have local midnight at about 14 UT (LT=UT+10 h). The solid lines and broken lines refer to the latitudinal posi-tions of maxima (MAX.1 and MAX.2) in spread-F activity whereas the dotted line (MIN.) refers to the latitudinal mini-mum in Sr.
Ionograms were digitally scanned for each station for con-secutive nights at 5-min intervals and searched for a maxi-mum in Sr. As an example Fig. 2 shows two typical iono-grams obtained on the same night at the polewardmost sta-tion Hobart. The range spread-F increased from less than 100 km at 17:13 UT (03:13 LT) to a maximum of about 200 km 15 min later (b). Note that the evaluation of Sr at
L. A. Hajkowicz: Morphology of quantified ionospheric range spread-F 1127 higher sounding frequencies might be less accurate due to a
steep rise in the virtual height (h′F ) of the F-region. Since this is the first numerical study of Sr it is impor-tant to define the reliability of this parameter. Unlike other tabulated ionospheric parameters (e.g. h′F , foF2) the calcu-lation of Sr was based on the arbitrarily chosen sounding fre-quency being at the lower end of the frefre-quency spectrum, unaffected by the frequency spread. On the whole this pa-rameter was not affected by the blanketing frequency due to sporadic-E (fbEs). The uniform part of range spread-F, as shown in Fig. 2, was used to derive a specific value of Sr from the bottom to the top of the range spread. The striated traces of spread-F, as can be seen in Fig. 2a above the main trace, were filtered out. The nature of this type of analysis would allow accuracy of about ±10 km. This is a consider-able advancement over the study based on simple absence or presence of spread-F derived from the tabulated qualifying parameters (these parameters refer to the inability to define foF2 at the high end of the frequency scale due to the fre-quency spread-F). Clearly as this is the first attempt to intro-duce the index Sr a more rigorous approach wold be requried in the future to include this parameter in the tabulated iono-spheric indices. A particular attention should be given to the uniformity of the trace at the low frequency range using a suitable alogorithm.
It became evident from the ionogram analysis that dur-ing southern winter (the June solstice) that the midlatitude ionosphere can be divided to a region of consistently high Sr (sub-auroral lat., Fig. 3a) followed by decreasing Sr towards a mid-latitude minimum (Fig. 3b) and increasing again to a distinct maximum in lower midlatitudes (Fig. 3c).The first re-gion, characteristic of a sub-auroral station Hobart, showed on the whole high average Sr during the year (a typical stan-dard error is indicated as an example), with a shallow maxi-mum (Sr=125 km) in May and a pronounced dip (Sr=20 km) in December. The auroral magnetic activity (average 6Kp for each month) is also indicated. It can be seen that the nearest stations Christchurch (only 3.6◦geom. equatorwards of H, cf. Table 1) and Canberra show a decreasing tendency in Sr, with the maxima in June–July.
Sr keeps on decreasing towards a minimum as recorded at Mundaring and Sydney where the winter maximum is barely discernable. The winter enhancement in Sr is clearly visible for the low midlatitude stations (B, N, T and D). Sr is the highest for Townsville and Brisbane (maximum in June–July reaching 70 km).
It can be seen that during other seasons, particularly dur-ing summer (the December solstice) there is little evidence of spread-F at all the stations except Hobart. It is of some inter-est that Christchurch, being the closinter-est station to sub-auroral latitudes, exhibits a submaximum in January (Fig. 3b).
The seasonal trends in the percentage occurrences of Sr is summarised in Fig. 4. The broad autumn-winter shallow maximum (almost 100 per cent occurrence) at H is followed by more selective winter maxima at CC and C for which Sr
Fig. 3. Monthly (January 2004–January 2005) variations in the
av-erage magnitude of range spread-F in the different regions of the midlatitude ionosphere. A typical standard error (the vertical bar) is shown as an example.
was recorded only on the half of the nights (Fig. 4a). Note that there is a substantial spread-F activity also in autumn for Christchurch, the midlatitude station close to sub-auroral latitudes. The first station which shows a highly selective winter enhancement in Sr is Canberra (4.1◦geom. equator-wards of Christchurch). The next midlatitude region exhib-ited only a weak winter maximum (Fig. 4b).The lowest per-centage occurrence was for Sydney, below 20 per cent. The highly selective winter occurrence of Sr was in low midlati-tudes (Fig. 4c). It can be seen that the percentage occurrence rateof Sr in winter for T and B peaks close to 80 per cent but falls dramatically during other seasons.
The summary of Sr (i.e. the average value for each season and each station) variations vs. geom. lat. is shown in Fig. 5. It can be seen that there is a sharp poleward increase in Sr (by a factor of 2) towards sub-auroral latitudes, particularly in
1128 L. A. Hajkowicz: Morphology of quantified ionospheric range spread-F
Fig. 4. Seasonal percentage occurrences of range spread-F at the
different ionospheric regions and for different stations.
autumn and winter. The midlatitude minimum (for Mundar-ing and Sydney) is consistently observed throughout the year. A pronounced lower midlatitude maximum is observed in winter only. The values of Sr for Brisbane and Norfolk Is. are very similar as these stations are separated by one degree in latitude.
3 Results and conclusions
Ionograms obtained at 5-min intervals for 9 Australian and New Zealand stations (in geom. lat. range: 23◦S–52◦S) were analysed for a period of over one year (January 2004–January 2005). For the first time a quantitative magnitude (in km) was assigned to the range spread-F (Sr) at a specific ionosonde
Fig. 5. Latitudinal cross-sections of the mean range spread-F at
dif-ferent seasons. The geomagnetic positions of the stations for which maxima (Townsville-T and Hobart-H) and a minimum (Sydney-S) were observed are shown by the arrows. A typical example of the standard error is indicated.
sounding frequency (1.8 MHz). The previous statistical stud-ies of spread-F were usually based on a qualitative approach (e.g. using qualifying symbols referring to the absence or presence of spread-F at the higher sounding frequencies).
It was found that the sub-auroral ionosphere is charac-terised by ionograms obtained at the southernmost station Hobart. This region is associated with strong and frequent Sr, occurring on about 90 per cent of nights Average Sr is about 100 km. There is a sharp decrease in the occurrence and mag-nitude of the range spread equatorwards of Hobart (51.6◦S) towards Christchurch (48.0◦S) and Canberra (43.9◦S), with a consistent minimum observed at Mundaring (43.4◦S) and Sydney (42.2◦S). There is negligible spread-F at lower lati-tude stations at all seasons except in winter when it strongly peaks at Brisbane (35.7◦S) and Townsville (28.4◦S). Thus latitudes of two spread-F maxima and a distinct minimum can be defined as shown in Fig. 1: sub-auroral ionosphere as-sociated with consistently pronounced spread-F (MAX.1), a narrow region of consistently weak spread-F activity (MIN.) and finally the low midlatitudes in which Sr has a distinct peak in winter (MAX.2). The region of diminished spread-F activity (MIN.) is a relatively new feature in the spread-spread-F morphology. Rawer and Suchy (1967) found a similar dis-tribution of midlatitude spread-F on the global scale. They found a boundary between low and high midlatitude spread-F occurrence.
It is of considerable interest that the June solstice maxi-mum in spread-F activity is also present in the Japanese sec-tor in the Northern Hemisphere during local summer. An ex-tensive study of this phenomenon, over a solar cycle, clearly indicates that both the Australian sector (Canberra, Bris-bane, Townsville) and the Japanese sector (Wakkanai, Akita,
L. A. Hajkowicz: Morphology of quantified ionospheric range spread-F 1129 Yamagawa) are characterised by a distinct solstice maximum
in this parameter (Bowman, 1964). He associated some of the reported effects with the upper atmosphere neutral parti-cle density (NPD) variations. In particular the June solstice maximum in the global spread-F seems to be inversely cor-related with NPD which is then at minimum. A similar in-crease in the June solstitial spread-F in East Asia (Japan and Taiwan) was reported by Sinno and Kan (1980), and Huang (1978). The June solstice maximum in spread-F was also reported for the South African longitudinal sector (Lambert, 1988).
Bowman (1992) found that “midlatitude spread-F is caused primarily by off-vertical reflections of radio waves from tilted isoionic surfaces produced by the passage of medium-scale travelling ionospheric disturbances (MS-TIDs)”. The global trend in NPD is such that it is small during the June solstice which provides favourable condi-tion (due to a smaller attenuacondi-tion) for the propagacondi-tion of MS-TIDs leading to the enhanced spread-F activity in both hemispheres. This is further supported by the global min-imum in midlatitude spread-F during the solar cycle maxi-mum. The increased frequency and intensity of auroral dis-turbances during sunspot maximum is also associated with an increase in the global NPD which results in greater attenua-tion of MS-TIDs hence leading to the well known spread-F minimum (Bowman, 1964, 1993). This theory can be ap-plied to the latitudinal range between sub-auroral and mid latitude stations (i.e. between 43–48◦S). However the low midlatitude winter maximum (following the deep minimum) indicate a different mechanism in generation of spread-F, in-compatible with the NPD model. Clearly, the generation of midlatitude spread-F is a complex phenomenon which has no satisfactory expalanation. It is suggested that aurorally generated TIDs are not the primary cause of spread-F in low midlatitudes. The midlatitude minimum delinates a bound-ary where the effect of aurorally generated TIDs could cause spread-F. In this sense the minimum is only apparent but not real. The following maximum is due to an entirely different phenomenon hitherto unknown.
Although it has been known for some time that the occur-rence of spread-F is larger at Hobart than at lower southern latitudes stations (cf. Bowman, 1960) the limited availability of ionosonde stations made it difficult to define a transition region between higher and lower midlatitudes. The transi-tion region between these regions can be however inferred from other ionospheric studies. In particular the well known close association between Sr and VHF ionospheric scintilla-tions may be applicable (e.g. Hajkowicz, 1977, 1982a, 1994). Kersley et al. (1975) using VHF radio transmissions from or-biting satellites concluded that a rapid scintillation increase from mid-latitudes to sub-auroral latitudes occurred over 3◦ of invariant latitude. Similar results were obtained in New Zealand where a scintillation boundary (using the same tech-nique) was found at geomagnetic latitudes 50◦–55◦S (Kaiser and Preddey, 1968).The boundary was aligned along the
ge-omagnetic latitude and was associated with a sharp scin-tillation increase from midlatitudes to sub-auroral latitudes. Preddey (1969) conducted scintillation observations in the same region using a chain of latitudinally displaced stations and found a weak maximum at 35◦S invar. lat., minimum at 45◦S and a strong scintillation increase towards higher lat-itudes. Hajkowicz (1982b) noted that the equatorwards po-sition of auroral scintillation boundary, associated with the simultaneous occurrence of range spread-F, extended at least to the latitude of Hobart during geomagnetically disturbed periods.
These results indicate the presence of a well defined small-scale irregularity boundary, deduced from VHF scintillation (caused by kilometric irregularities) and range spread-F stud-ies. The winter low midlatitude maximum in Sr can be linked with the winter maximum in ionospheric scintillations found from two-year study by Hajkowicz (1977). Hajkowicz (1994, 1997) found, from a long-term study, that a specific type of midlatitude scintillations and range spread-F both reach max-imum during sunspot minmax-imum.
The fast decline in the range spread between Hobart and Christchurch can be linked with the structure of irregular-ities linked with this phenomenon. Bowman (1981, 2001) concluded that the nighttime irregularities which produce spread-F have quasi-sinusoidal cross sections at F-region heights, with a wavelength of several tens of kilometres. This type of wave-like structure is associated with travelling iono-spheric disturbances (TIDs) which are frequently generated in the auroral zone as a result of substorm activity. It be-came evident, from a study of the spectrum of TIDs gener-ated during auroral substorm activity, that waves (with wave-lengths below about 30 km) were rapidly attenuated during their equatorward propagation (Williams et al., 1988). It fol-lows that the small latitudinal separation between Hobart and Christchurch is sufficient to produce a substantial decline in spread-F activity. This decline continues towards the midlat-itude region where a minimum is observed.
The correlation between auroral activity and spread-F oc-currence is a complex phenomenon, outside the scope of the present paper. Bowman (1982) conducted an extensive study on the occurrence of spread-F following the magnetic storms. He noted a substantial delays (days) between auroral sub-storms onsets and the resulting midlatitude spread-F. It can be seen from comparison of sub-auroral Sr with mean 6Kp (Fig. 3a) that there is little evidence on day-to-day correlation between Sr and substorm activity.
There is possible link between simultaneous occurrences of mid-latitude spread-F and sporadic-E. Haldoupis et al. (2003) noted that mesoscale midlatitude spread-F is closely linked with patchy sporadic-E layers due to gravity wave-induced large-scale electric fields mapping the E re-gion to the F-rere-gion. This is however may be less common since the southern winter maximum in Sr coincides with the seasonal minimum in sporadic-E (Hajkowicz, 1977, 1978).
1130 L. A. Hajkowicz: Morphology of quantified ionospheric range spread-F The existence of a distinct minimum in the midlatitude
spread-F is a relatively new aspect in this study hitherto re-ported only by Rawer and Suchy (1967) and indirectly from the results obtained by Preddey (1969) from a scintillation study. It creates a clear midlatitude ionospheric boundary between sub-auroral and low midlatitudes.
The study of midlatitude ionosphere is gaining popularity in recent years. Kelley and Miller (1997) pointed out to “a growing awareness of the interconnections between gravity waves, travelling ionospheric disturbances, elongated bands of raised ionosphere density depletions, and the recently dis-covered turbulent upwelling of midlatitude plasma”. The Perkins instability has been widely used to explain midlat-itude spread-F. Huang et al. (1994) suggested that seeding by atmospheric gravity waves is an important factor in the generation of midlatitude spread-F irregularities. They ex-panded the Perkins linear instability which become signifi-cantly enhanced due to gravity waves seeding of midlatitude ionosphere.
Acknowledgements. The ionosonde data were supplied by G. Pat-terson of the Australian Ionospheric Prediction Service. I am grate-ful to K. Lynn for discussion on some aspects of this report.
Topical Editor M. Pinnock thanks two referees for their help in evaluating this paper.
References
Bowman, G. G.: Further studies of spread-F at Brisbane-I, Planet. Space Sci., 2, 133–149, 1960.
Bowman, G. G.: Spread-F in the ionosphere and the neutral particle density of the upper atmosphere, Nature, 201, 564–566, 1964. Bowman, G. G.: The nature of ionospheric spread-F irregularities
in mid-latitude regions, J. Atmos. Terr. Phys., 43, 65–79, 1981. Bowman, G. G.: Spread-F occurrence in mid- and low-latitude
re-gions related to various levels of geomagnetic activity, J. Atmos. Terr. Phys., 44, 585–589, 1982.
Bowman, G. G.: Upper atmosphere neutral-particle variations com-pared with spread-F occurrence rates at locations around the world, Ann. Geophys., 10, 676–682, 1992,
http://www.ann-geophys.net/10/676/1992/.
Bowman, G. G.: The influence of the upper-atmosphere neutral par-ticle density on the occurrence of equatorial spread-F, Ann. Geo-phys., 11, 624–633, 1993,
http://www.ann-geophys.net/11/624/1993/.
Bowman, G. G.: A comparison of nighttime TID characteristics between equatorial-ionospheric-anomaly crest and midlatitude regions, related to spread-F occurrence, J. Geophys. Res., 106, 1761–1769, 2001.
Hajkowicz, L. A.: Multi-satellite scintillations, spread-F and sporadic-E over Brisbane-1, J. Atmos. Terr. Phys., 39, 359–365, 1977.
Hajkowicz, L. A.: Multi-satellite scintillations, spread-F and sporadic-E over Brisbane, J. Atmos. Terr. Phys., 40, 99–104, 1978.
Hajkowicz, L. A.: Topside and ground ionosonde observations of a mid-latitude scintillation region, J. Atmos. Terr. Phys., 44, 173– 178, 1982a.
Hajkowicz, L. A.: Equatorwards limits of the southern scintillation oval, J. Atmos. Terr. Phys., 44, 539–545, 1982b.
Hajkowicz, L. A.: Types of ionospheric scintillations in southern mid-latitudes during the last sunspot maximum, J. Atmos. Terr. Phys., 56, 391–399, 1994.
Hajkowicz, L. A.: Characteristic types of ionospheric scintillations at VHF for a typical mid-latitude station over a sunspot cycle (1988–1996), J. Atmos. Terr. Phys., 59, 1901–1907, 1997. Haldoupis, C., Kelley, M. C., Hussey, G. C., and Shalimov,
S.: Role of unstable sporadic-E layers in the generation of midlatitude spread F, J. Geophys. Res., 108(A12), 1446, doi:10.1029/2003JA009956, 2003.
Huang, Y. N.: Ionospheric scintillations at Lunping, J. Chineese Inst. Eng., 1, 81–84, 1978.
Huang, C.-S., Miller, C. A., and Kelley, M. C.: Basic properties and gravity wave initiation of the midlatitude F-region instability, Radio Sci., 29, 395–405, 1994.
Kaiser, A. B. and Preddey, G. F.: Observations of transition in satel-lite scintillation, J. Atmos. Terr. Phys., 30, 285–291, 1968. Kelley, C. M. and Miller, C. A.: Mid-latitude thermospheric plasma
physics and electrodynamics: A review, J. Atmos. Terr. Phys., 59, 1643–1654, 1997.
Kersley, L., van Eyken, A. P., and Edwards, K. J.: Ionospheric mid-latitude trough and the abrupt scintillation boundary, Nature, 254, 312–313, 1975.
King, G. A.: Spread-F on ionograms, J. Atmos. Terr. Phys., 32, 209–221, 1970.
Lambert, S.: Frequency and duration of disturbances in the mid-latitude region F region of the ionosphere, Radio Sci., 23, 693– 707, 1988.
Preddey, G. F.: Mid-latitude radio-satellite scintillation: the varia-tion with latitude, Planet. Space Sci., 17, 1557–1561, 1969. Rastogi, R. G. and Woodman, R. F.: VHF radio wave scattering due
to range and frequency types of equatorial spread-F, J. Atmos. Terr. Phys., 40, 485–491, 1978.
Rawer, K. and Suchy, K.: Radio observation of the ionosphere, in: Encyclopedia of Physics, edited by: Flugge, S., vol. XLIX/2, Geophysics III, part 2. Springer, Berlin-Heidelberg, 1967. Sinno, K. and Kan, M.: Ionospheric scintillation and fluctuation
of Faraday rotation caused by spread-F and sporadic-E over Kokobunji, Japan, J. Radio Res. Lab. (Japan), 27, 53–77, 1980. Williams, P. J. S., Crowley, G., Schlegel, K., Virdi, T. S., McCrea,
I., Watkins, G., Wade, N., Hargreaves, J. K., Lachlan-Cope, T., Muller, H., Baldwin, J. E., Warner, P., van Eyken, M. A., Hap-good, M. A., and Rodger A. S.: The generation and propagation of atmospheric gravity waves observed during the Worldwide At-mospheric Gravity-wave Study (WAGS), J. Atmos. Terr. Phys., 50, 323–338, 1988.