HAL Id: hal-00316942
https://hal.archives-ouvertes.fr/hal-00316942
Submitted on 1 Jan 2002
HAL is a multi-disciplinary open access
archive for the deposit and dissemination of
sci-entific research documents, whether they are
pub-lished or not. The documents may come from
teaching and research institutions in France or
abroad, or from public or private research centers.
L’archive ouverte pluridisciplinaire HAL, est
destinée au dépôt et à la diffusion de documents
scientifiques de niveau recherche, publiés ou non,
émanant des établissements d’enseignement et de
recherche français ou étrangers, des laboratoires
publics ou privés.
Synoptic conditions leading to extremely high
temperatures in Madrid
R. Garcia, L. Prieto, E. Hernández, T. del Teso, J. Diaz
To cite this version:
R. Garcia, L. Prieto, E. Hernández, T. del Teso, J. Diaz. Synoptic conditions leading to extremely high
temperatures in Madrid. Annales Geophysicae, European Geosciences Union, 2002, 20 (2), pp.237-245.
�hal-00316942�
Received: 12 March 2001 – Revised: 19 September 2001 – Accepted: 20 September 2001
Abstract. Extremely hot days (EHD) in Madrid have been analysed to determine the synoptic patterns that produce EHDs during the period of 1955–1998. An EHD is defined as a day with maximum temperature higher than 36.5◦C, a value which is the threshold for the intense effects on mor-tatility and it coincides with the 95 percentile of the series. Two different situations have been detected as being respon-sible for an EHD occurrence, one more dynamical, produced by southern fluxes, and another associated with a stagnation situation over Iberia of a longer duration. Both account for 92% of the total number of days, thus providing an efficient classification framework. A circulation index has been de-rived to characterise and forecast an EHD occurrence. This paper shows that EHD occur in Madrid during short dura-tion events, and no long heat waves, like those recorded in other cities, are present. Additionally, no clear pattern can be detected in the EHD frequency; the occurrence is tied to changes in the summer location of the Azores high.
Key words. Meteorology and atmospheric dynamics (Cli-matology; synoptic-scale meteorology; general or miscella-neous)
1 Introduction
The interest in the study of extremely hot temperature events has increased in the last few years due to a number of fac-tors. There is wide evidence that temperature extreme val-ues show significant trends, either positive or negative, in different regions of the planet (Karl, 1996; Plummer, 1999; Easterling, 2000). Those changes detected in the actual ob-served extreme temperatures seem likely to continue in the future (IPCC, 1995; Ungar, 1999). Although there is no gen-eral agreement, most of the models forecast scenarios where more hot summer days and higher maximum temperatures are very likely to occur (Easterling, 2000). The most rele-vant direct impact of these extremely hot events is the
in-Correspondence to: L. Prieto ([email protected])
crease in mortality, primarily associated with cardiovascular diseases among the elderly (Pan, 1995; Woodhouse, 1994). Kalkstein and Greene (1997) consider that “heat waves” are the most important cause of death due to natural hazards. In fact, they seem to be one of the few meteorological hazards whose associated mortality is increasing during the last few years (Changnon et al., 1996).
Most of these studies consider the association between mortality and heat through the use of different types of statis-tical models to identify the effects that are really associated with hot temperature and to evaluate those effects due to dif-ferent air pollutants. There have been attempts to include variables associated with atmospheric circulation (Gonz´alez et al., 2001). In some cases (Kalkstein, 1991; Kalkstein et al., 1996) a different approach is used by considering the weather types that cause these extreme values through the use of ob-jective schemes.
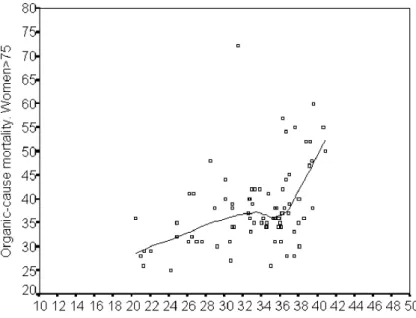
In Madrid, the association between temperature and mor-tality shows an V-shape, similar to that found in different cities (Alberdi et al., 1998; S´aez et al., 1995; Kunst et al., 1993), with minimum mortality for a daily maximum tem-perature of 30.8◦C. However, Madrid shows a summer in-crease in mortality which is higher than that evidenced in other areas with intense thermal extremes (Greenberg et al., 1983; Lye and Kamal, 1997; Macey and Schneider, 1993). Figure 1 shows the association between mortality (organic-cause in women over 75) and daily maximum temperature for the period. It is evident that a sharp increase occurs in the slope of the adjusted regression line for temperatures above 36.5◦C. Therefore, this value can be considered as a
threshold for the occurrence of “heat waves” or high mortal-ity episodes. This is a value similar to those found for Japan (Nakai, 1999) or Chicago (Whitman et al., 1997), but lower than those found for St. Louis (Smoyer, 1998). It is interest-ing to note that humidity does not seem to play a relevant role in this type of episode in Madrid (Alberdi et al., 1998; D´ıaz et al., 1999; Gonz´alez et al., 2001). A complete description of the association between extreme temperature and mortality can be found in D´ıaz et al. (2001).
238 R. Garc´ıa et al.: Synoptic conditions leading to extremely high temperatures in Madrid
Fig. 1. Association between daily mortality (number of deaths) among women over 75, due to a organic causes and the daily maximum
temperature in Madrid (◦C).
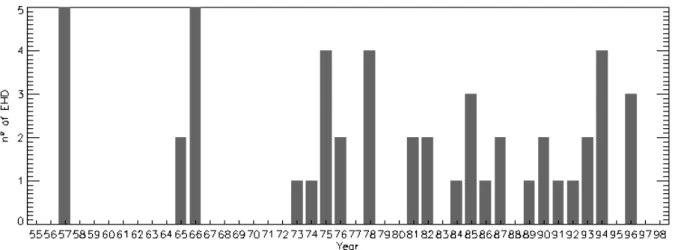
Fig. 2. (a) Annual EHD frequency in Madrid during the period of 1955–1998. Frequency is expressed as the number of days with a maximum
temperature above 36.5◦C per year. (b) Histogram of the duration of EHD periods.
The main objective of this paper is to identify the syn-optic patterns leading to extreme temperature values in Madrid; among similar previous studies, those by Karl and Quayle (1981) and Chang and Wallace (1987) can be cited. The paper is organized as follows: Sect. 2 provides a statisti-cal analysis of the occurrence of extremely hot days (EHD), Sects. 3 and 4 describe the synoptic patterns leading to the occurrence of very hot days. The final remarks are included in Sect. 5.
2 Occurrence of very hot days
Maximum daily temperature in the summer months (June, July, August and September) have been analysed to char-acterize heat wave occurrence in Madrid. According to the previous section, those days with temperatures above 36.5◦C
have been considered as very hot days. The study covers the period of 1955–1998. The daily temperature series has been taken from the Spanish Meteorological Service (INM), in the observatory of Madrid-Retiro. Data used in the syn-optic analysis and other calculations have been taken from NCEP/NCAR reanalysis (Kalnay et al., 1996), available for the whole study period on a 2.5◦×2.5◦grid.
Figure 2 shows the number of heat days per year (panel (a) and the histogram of the duration of the heat day runs (i.e. number of consecutive days exceeding the threshold value; panel (b). Panel (a) shows that the occurrence of tem-perature in excess of the threshold value is a very rare phe-nomenon in Madrid; in fact, it is also the 95 percentile of the daily temperature series. Great interannual variability is also evident, with 10 years (22%) without a day containing values above the threshold. The 1990s shows a higher in-cidence of very hot days, but the difference with the rest is
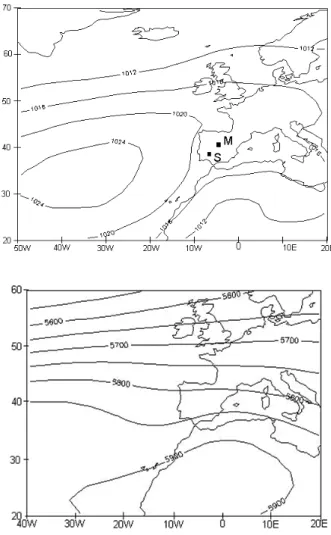
Fig. 3. (a) SLP average for June to September during the 1955–
1998 period. M and S indicate the respective location of Madrid and Seville. (b) Similar to (a), but for Z500.
not statistically significant when a student t-test is applied. After investigating the relationship between the seasonal fre-quency and the variables, such as average summer temper-ature, average annual temperature and the different circu-lation indices relevant for the atmospheric circucircu-lation over the Iberian Peninsula, no significant driving variable could be detected, nor could any regular time pattern be identified. However, it can be seen that there is a nonlinear association between the monthly average maximum temperature and the monthly EHD frequency. Months with average maximum temperature higher than 32.1◦C (which correspond to the ex-pected value plus the standard deviation for the daily maxi-mum temperature) show an average EHD frequency of 2.82 (± 2.43) days/month (sigma values between brackets), while the rest show an average EHD frequency of 0.36 (± 0.84) days/month. The difference is significant (p < 0.01) after a two-tailed student t-test.
From panel (b), it is evident that for most of the time (50% of the cases), the occurrence of temperatures in excess of the threshold occurs in isolation, with one single day above 36.5◦C. Additionally, the duration of the periods only
ex-Fig. 4. (a) SLP and Z500field for 19 July 1989, corresponding to a
selected southern flux situation. (b) Similar to (a), but for the wind at 850 hPa.
ceeds 5 days in two cases. This lack of persistence in the extreme hot days is rather characteristic of Madrid, where no long, extreme hot periods have occurred during the study period. The maximum length (8 days) is similar to that recorded in Athens during 1987 (Katsouyanni et al., 1993). On the contrary, there are abundant references in the liter-ature on the occurrence of prolonged heat waves in differ-ent cities (Smoyer, 1998; Smoyer et al., 2000; Greenberg et al., 1983), with a maximum length for that recorded in Bel-gium in 1994 (42 days, above 27.5◦C; Sartor et al., 1995). However, one must be cautious when making a comparison to other studies, since there does not exist a homogeneous way to define an EHD, as can be seen in the cited references, where the threshold is fixed depending on the value of the effect produced by the apparent temperature (Smoyer, 1998; Smoyer et al., 2000), which represents the occurrence of a certain impact on a case-control study (Sartor et al., 1995).
240 R. Garc´ıa et al.: Synoptic conditions leading to extremely high temperatures in Madrid
Fig. 5. Annual frequency for EHD occurring under southern flux conditions.
Fig. 6. Evolution of maximum daily temperature during the
stagna-tion period that occurred between 3 and 6 August 1991.
A first approach for the analysis of these extreme values was the use of techniques, such as Rotated Principal Component Analysis (Richman, 1986) or Canonical Correlation Analy-sis (CCA, von Stoch and Zwiers, 1999) to identify and char-acterize the synoptic conditions associated with their occur-rence. The identification of synoptic patterns through the use of air-mass analysis was also attempted (Kalkstein, 1996). None of the previous attempts yielded efficient results. So, an alternative approach was used based on a case-by-case analysis. First, the days with a maximum temperature above 36.5◦C were selected. Next, their sea level pressure (SLP),
the 500 hPa geopotential height, the 850 hPa analyzed wind, and the surface temperature from the NCEP reanalysis were analysed through a subjective procedure, taking into account the respective anomaly fields. Figure 3 shows SLP and the 500 hPa geopotential height averages during the summer months for the considered period. It can be seen that the subtropical Azores’ high blocks the surface circulation over Iberia, while there is a zonal pattern at 500 hPa, with Iberia in its southern edge. Thus, small changes in the location of this zonal belt can lead to high variations in the circulation over
the Iberian Peninsula. After careful examination of the 151 days when the recorded maximum temperature was higher than 36.5◦C, two synoptic patterns could be identified: the southern flux situation and the stagnation situation. In the following sections, a detailed description is provided for both situations.
3 Southern flux situation
This type of situation usually occurs due to the joint effect of a trough, located between 15◦and 40◦W, with its axis di-rected north to south, and a small ridge, with its center over Iberia. Figure 4 shows a typical example of such situations (it corresponds to 19 July 1989, with a maximum temper-ature of 37.2◦C). Apparently, such a configuration should produce fresh and moist southwestern winds over the Por-tuguese coast. However, the analyzed winds at 850 hPa show that the prevailing flow injects hot and dry air from North Africa onto Iberia. An anticyclonic circulation favours this transport over North Africa that intensifies the flux over east-ern Spain. The effect of the trough is the generation of a meridian flow, which results in the transport of hot air from the south. Usually, the deeper the trough is, the hotter the air, since it comes from the more southern regions. In fact, dur-ing summer, North Africa lies in the subtropical subsidence region. Therefore, very high solar irradiance and very low latent heat fluxes lead to extreme temperatures above 40◦S. Similar conditions are recorded in southern Iberia due to the presence of the ridge.
It can be noted in panel (a), which shows the 500 hPa geopotential height, that the trough is not especially deep (5720 m), but it is enough to induce southern flows into cen-tral Iberia. Panel (b) shows the wind pattern with values above 8 m/s. The occurrence of these situations concentrates during the period between 15 June and 1 September, with maximum incidence for July. Figure 5 shows the annual fre-quency of such days (expressed as days per year). It can be seen that it is very low, with a maximum of 5 days/year for
than two consecutive days. However, it must be empha-sized that the maximum recorded temperatures have origi-nated when the pattern extended its duration up to 5 days (as was the case in July-August 1957; August 1966 and July 1978 with maximum temperatures above 39◦C). In all three
cases, the pattern showed a more stationary behaviour than usual, with a deeper and larger ridge. This produced a longer persistence, thus the southern, hotter and dryer air reached Iberia.
4 Stagnation situations
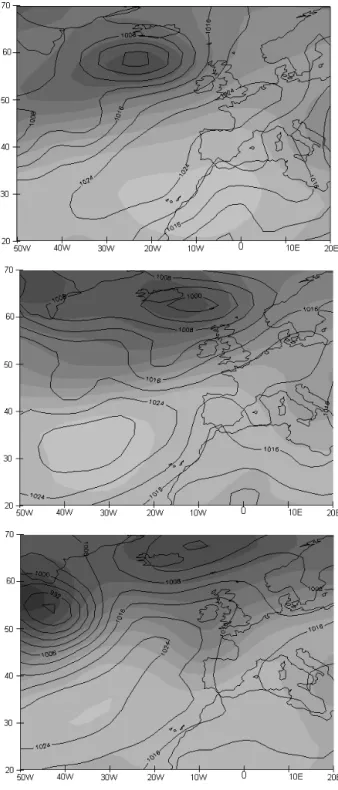
Stagnation configurations are rather different from those that originate from southern fluxes. They occur when the sub-tropical high at 500 hPa moves northward onto Iberia. This displacement produces stagnation in the middle troposphere, which extends downward to the surface when the permanent Azores’ high is displaced northeast from its usual location over western Europe. The combination of both factors, at the surface and at 500 hPa, usually leads to a calm or very weak northward wind due to the effect of the development of a thermic low over southern Iberian and northern Mo-rocco. These episodes usually last between 1 to 5 days, when the temperature rises abruptly, causing extreme values. The breakdown of this situation is primarily due to the southward displacement of the westerlies; thus, Atlantic air is injected over the area. This can be intensified by two factors, which usually occur jointly and break the surface situation. The first and the most important is the intensification of the high over the Azores Islands, which induces a northward surface wind over Iberia. The other factor is the development of a ther-mic low over southern Iberia with the reinforcements of the northern flow. Figures 6, 7 and 8 show a typical example of a stagnation episode from 3 August 1991 to 6 August 1991. Figure 6 shows the maximum temperature evolution. Fig-ure 7 represents SLP and 500 hPa geopotential height fields at 12:00 UT for 3, 5 and 7 August 1991. Figure 8 shows the 850 hPa corresponding wind fields. It can be observed that the event starts when the surface Azores’ high and the high-level subtropical high extends onto Iberia, with calm or very low winds. As days pass, a thermic low develops over the Alboran Sea. The low finally breaks the surface high and the
Fig. 7. SLP and Z500field for 3, 5 and 7 August.
configuration evolves to a trough, which injects Atlantic air over the peninsula. In the corresponding temperature field (not shown here), it can be noted how the high temperature field extends northward as the situation evolves and the ar-rival of fresh Atlantic air over the west occurs after day 6.
A total of 90 days were detected. It must be noted that 63 of them (70%) were recorded within events with a duration longer than two days. Figure 9 shows the annual frequency
242 R. Garc´ıa et al.: Synoptic conditions leading to extremely high temperatures in Madrid
Fig. 8. Similar to Fig. 7, but for the analyzed wind at 850 hPa.
Fig. 9. Annual frequency of EHD (grey) and EH events (black) for the 1955–1998 study period.
of these situations during the study period. It can be seen that there are 19 years with no occurrence of a stagnation sit-uation, while 9 years show more than one stagnation event. No clear trend is evident on the distribution, with the high-est occurrence of EHD during the 1991–1995 period, with 4 events in 1991 (16 days total duration) and two events in 1992, 1993 and 1995. No apparent relationship between the total number of EHD and the average summer temperatures during the considered period has been detected.
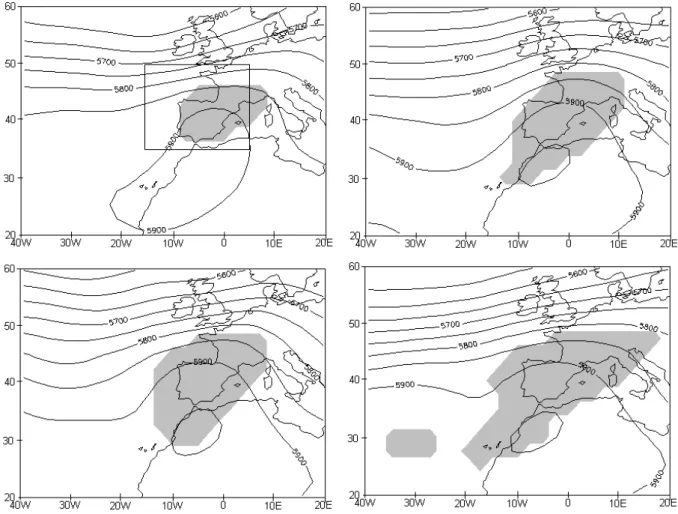
To assess the possibility of any changes that may span sev-eral decades, the study period was divided into 4, eleven year periods: 1955–65, 1966–76, 1977–87 and 1988–98. Fig-ure 10 shows the decadal 500 hPa geopotential heights for those days that belong to a heat wave event due to a stagna-tion situastagna-tion. In all of them, a ridge configurastagna-tion is evident but that is more intense at the end of the study period. This increase in the intensity is better depicted by the shadowed areas, which show geopotential anomalies higher than one
standard deviation. It is evident that the extent of the area increases as the decades pass, coinciding with a higher num-ber of events, which, in addition, last longer during the last decade.
The presence of the 500 hPa high displacement seems to be a key point for the detection of this kind of pattern. This observation has allowed one to develop a circulation index (CI) that adequately characterizes the occurrence of stag-nation episodes. For this purpose, the grid, delimited by 35.0◦N and 50.0◦N in latitude and 17.5◦W and 5.0◦E in longitude, was considered (location shown in Fig. 9a, with a 2.5◦resolution. The difference between the actual
geopo-tential height and the reference value of 5920 m is then com-puted for every gridpoint and then averaged. Thus, this mean anomaly can be expressed by:
Fig. 10. (a) Z500composites (June to September) for the period of 1955–1965. Shadowed area represents values with anomalies higher than
one standard deviation. The square shows the area used to compute CI (see text for details). (b) (a), but for the period of 1966–1976. (c) (a), but for the period of 1977–1987. (d) (a), but for the period of 1988–1998.
where ij represent the grid points. The 5920 m reference value has been chosen after different trials in order to op-timize its representativeness of the circulation (and conse-quently, stagnation occurrence) over central Iberia. Thus, high CI values are associated with the presence of a trough over Iberia and, therefore, low temperatures, while low CI values should correspond to stagnation, i.e. high tempera-tures. The effect of low CI values (stagnetion episodes) is the increase in temperature; this leads to an EHD when the initial maximum temperature is above 26◦C. If this
thresh-old is not exceeded, then high (low) CI values are associated with abrupt decreases (increases) in the temperature value. During these days of low CI, extremely high values also oc-cur in southern Spain. For example, Seville (see location in Fig. 3b can reach temperatures near 40◦C. Thus, CI is able to detect stagnation not only over Madrid, but also over most of Spain. Furthermore, CI can be used as a maximum tem-perature indicator. To test the association between CI and lagged maximum temperatures over Madrid and Seville, the cross-correlation functions have been computed for the daily values obtained for the summer months (June to September) during the 1955–1998 period. In Madrid, it can be seen that
maximum values correspond to a 1-day lag, with a Pearson coefficient value of −0.75(p < 0.01), as compared to the value of r = −0.7, (p < 0.01) for lag zero. These values indicate the excellent agreement between CI and maximum temperature, and that CI can anticipate the occurrence of ex-treme values, one day ahead in Madrid and it can be used as a local predictor of extreme temperature. In Seville, corre-lation values are very similar, r = −0.72 for lag zero and
r = −0.67 for a 1-day lag. The small differences in the correlation values can be attributed to the fact that Seville is located southern of Madrid and closer to the sea, and is more sensitive to variations in the wind configuration.
The Pearson correlation coefficient between CI and the daily maximum temperature has been computed for the whole study period. For all the cases, the correlation is sig-nificant and shows a certain trend towards more sigsig-nificant values when moving towards the end of the study period. This can be attributed to the highest frequency of stagnation situations during the end of the period; the years with few or no stagnation days correspond to lower correlation coeffi-cients.
244 R. Garc´ıa et al.: Synoptic conditions leading to extremely high temperatures in Madrid
5 Final remarks
Extreme temperatures in Madrid usually occur as short dura-tion events, with more than 45% of the events lasting from 1 to 2 days. It is interesting to note that the determination of the threshold value (36.5◦C) is chosen due to the impact of extreme temperature on mortality; however, it coincides with the 95 percentile of the daily maximum temperature distri-bution. Thus, the occurrence of a very hot day that causes a significant impact on the mortality in Madrid is a very rare event. Long heat waves, similar to those recorded in other cities (Sartor, 1995; Smoyer, 2000; Katsouyanni, 1993), have not occurred in Madrid during the period of 1955–1998. Two synoptic patterns lead to the occurrence of temperature ex-tremes:
(a) a southern flux situation with the injection of hot and dry air from North Africa onto Iberia, and
(b) a stagnation situation produced by the combination of a surface high and an upper level ridge oriented from SW to NE.
The duration of the southern flux situation is usually shorter (1.6 days) than that of the stagnation situations (2.7 days). This difference is due to the fact that a southern flux situation is more dynamical than a stagnation situation, which is characterized by weak winds or calm air allowing for its persistence for longer periods.
The southern flux and the stagnation situations account for 92% of the total number of days with maximum tem-peratures above 36.5◦C. Synoptic situations, corresponding to other hot days, are characterized by anomalies in the SLP or 500 hPa geopotential height field that drag air from North Africa onto Iberia, but there is no clear pattern associated with the generation of such southern fluxes, so that they can-not be included in any other category. They usually have a short duration (1 or 2 days), since, the anomaly weakens or moves, thus changing the wind pattern and the temperature of the air mass. Thus, this classification seems to be well adapted to encompass most EHD events.
The relationship between the annual frequency of these days and the different indices, such as major teleconnections or averaged annual temperatures, has been investigated, but none of them seem to exert any significant influence. Thus, local factors tied to the circulation anomalies associated to the southern edge of the Azores’ high seem to be the only relevant factors that explain the occurrence of thermal ex-tremes.
Middle troposphere circulation controls the synoptic pat-terns, leading to extreme temperatures over Madrid, so a cir-culation index, expressed as the mean value of the anomaly of the 500 hPa geopotential height for a referencee value of 5920 m, computed on a grid, provides a good predictor of the occurrence of EHD one day ahead.
These results provide some interesting clues on the dif-ficulties of assessing the local impact of a possible climate
change. When trying to evaluate this type of impact, the usual procedure requires the availability of:
(1) climate scenarios, usually obtained through the averag-ing of a number of runs from GCMs and expressed as monthly or higher scale means,
(2) a downscaling scheme to allow for the regional scale description of the variables, and
(3) a model to estimate the impact of climate change. In our case, the impact on mortality can be directly mea-sured and does not present any problems when accurate daily maximum temperatures are available. However, this paper shows that the frequency of EHD depends, nonlinearly, on the monthly averaged maximum temperature, but there is no significant relationship at higher time scales. Thus, only those scenarios providing maximum daily or monthly tem-perature (or daily Z500, to evaluate the CI) will be useful for
properly assessing the temperature impact on mortality. The use of scenarios expressing temperatures or Z500, as seasonal
averages will introduce additional uncertainty in the evalua-tion of these local impacts, even when these parameters can be directly estimated with a simple model from the meteoro-logical variables.
Acknowledgement. Topical Editor J.-P. Duvel thanks I. Durre and
J. Coiffier for their help in evaluating this paper.
References
Alberdi, J. C., D´ıaz J., Montero, J. C., Mir´on, I. J.: Daily mortal-ity in Madrid Communmortal-ity (Spain) 1986–1991: Relationship with atmospheric variables, European Journal of Epidemiology, 14, 571–578, 1998.
Chang, F. and Wallace, J. M.: Meteorological Conditions during Heat Waves and Drounghts in the United States Great Plains, Monthly Weather Review, 115, 1253–1269, 1987.
Changnon, S., Kunkel, K., and Reinke B.: Impacts and Responses to the 1995 Heat Wave: A Call to Acction, Bulletin of the Amer-ican Meteorological Society, 77, 1497-1506, 1996.
D´ıaz, J., Garc´ıa, R., Ribera, P., Alberdi, J. C., Hern´andez, E., and Pajares, M. S.: Modeling of air pollution and its relationship with mortality and morbidity in Madrid (Spain), International Archives Occupational and Environmental Health, 72, 366–376, 1999.
D´ıaz, J., L´opez, C., Garc´ıa, R., Jord´an, A., Hern´andez, E., Alberdi, J. C., and Otero, A.: Heat Waves in Madrid, 1986–1997: effects on the health of the elderly, International Archives Occupational and Environmental Health, On-line: Nov. 2001.
Easterling, D. R., Meehl, G. A., Parmesan, C., Chagnon, S. A., Karl, T. R., and Mearns, L. O.: Climate Extremes: Observations, Modeling and Impacts. Science, 289, 2068–2074, 2000. Gonz´alez, S., D´ıaz, J., Pajares, M. S., Alberdi, J. C., Otero, A.,
and L´opez, C.: Relationship between atmospheric pressure and mortality in the Madrid Autonomus Regio: a timeseris study, In-ternational Journal of Biometeorology, 45, 34–40, 2001. Greenberg, J. H., Bromberg, J., Reed, C. M., Gustafson, T. L., and
Bulletin of the American Meteorological Society, 77, 437–471, 1996.
Karl, T. R. and Quayle, R. G.: The 1980 summer heat wave and drought in historical perspective, Monthly Weather Review, 109, 2055–2073, 1981.
Karl, T. M, Knight, R. W., Easterling, D. R., and Quayle, R. G.: Indices of Climate Change for the United States, Bulletin of the American Meteorological Society, 77, 279, 1996.
Katsouyanni, K., Pantazopoulou, A., Touloumi, G., Tselepidaki, I., and Moustris, K., et al.: Evidence for interaction between air pol-lution and high temperature in the causation of excess mortality, Archives of Environmental Health, 48, 235–242, 1993. Kunst, A. E., Looman, C. W. N., and Mackenbach, J. P.: Outdoor
air temperature and mortality in the Netherlands: A time-series analysis, American Journal Epidemiology, 137, 331–341, 1993. Lye, M. and Kamal, A.: Effects of a heatwave on mortlity-rates in
elderly inpatients, Lancet, 1, 529–531, 1997.
Macey, S. M. and Schneider, D. F.: Deaths from excessive heat and excesive cold among the elderly, The Gerontologist, 33, 497– 500, 1993.
Nakai, S., Itoh, T., and Morimoto, T.: Deaths from heat-stroke in Japan: 1968–1994, International Journal of Biometeorology, 43, 124–127, 1999.
weather confound or modify the association of particullate air-pollution with mortality? An analysis of the Philadelphia data, 1973–1980, Environmental Research, 77, 9–19, 1998.
Smoyer, K. E.: A comparative analysis of heat waves associated mortality in St. Louis, Missouri - 1980 and 1995, International Journal of Biometeorology, 42, 44–50, 1998.
Smoyer, K. E., Rainham, D. G. C., and Hewko, J. N.: Heat-Stress-related mortality in five cities in Southern Ontario: 1980–1996, International Journal of Biometeorology, 44, 190–197, 2000. Ungar, S.: Is Stange Weather in the Air? A Study of U.S. National:
Network News Coverage of Extreme Weather Events, Climatic Change, 41, 133–150, 1999.
Von Storch, H. and Zwiers, F. W.: Statical analzsis in climate re-search, Camebridge University Press, 1999.
Whitman, S., Good, G., Donoghue, E. R., Benbow, N., Shou, W., and Mou, S.: Mortality in Chicago attributed to the July 1995 Heat Wave, American Journal of Public Health, 87, 1515–1518, 1997.
Woodhouse, P. R., Khaw, K. T., Plummer, M., Foley, A., and Meade, T. W.: Seasonal variation of plasma fibrinogen and fac-tor VII activity in the elderly: winter infections and death form cardiovascular disease, Lancet, 343, 435–439, 1994.