Differences in Neighborhood Characteristics and Capabilities to Move among Families with and without Health Challenges: A Case of Monterrey
By
Javier Leal Navarro B.A. in Architecture
Instituto Tecnol6gico y de Estudios Superiores de Monterrey Monterrey, Mexico (2011)
Submitted to the Department of Urban Studies and Planning in partial fulfillment of the requirements for the degree of
MASSACHUSETTS INSTITUTE
Master in City Planning OF TECHNOLOGY
at the
JUN
2
3
2016
MASSACHUSETTS INSTITUTE OF TECHNOLOGY
LIBRARIES
June 2016
ARCHIVES
2016 Javier Leal Navarro. All Rights Reserved
The author hereby grants to MIT the permission to reproduce and to distribute publicly paper and electronic copies of the thesis document in whole or in part in any medium now known or hereafter
created.
Author
Signature
redacted
Department of Urban Studies and Planning
Signature redacted
Certified by _________
Assistant Professor Mariana C. Arcaya Department of Urban Studies and Planning Thesis Supervisor
Accepted by
Signature redacted
- - sociate Hfofessor P. Christopher Zegras Chair, MCP Committee Department of Urban Studies and Planning
Differences in Neighborhood Characteristics and Capabilities to Move among Families with and without Health Challenges: A Case of Monterrey
By Javier Leal Navarro
Submitted to the Department of Urban Studies and Planning on May 19h 2016
in partial fulfillment of the requirements for the degree of Master in City Planning
ABSTRACT
This study positions health as a risk factor for neighborhood selection into poor neighborhoods, and overviews the possible mechanisms that constrain sick people from living in low poverty neighborhoods. Most of the literature on health and place focuses on the unidirectional relationship from place to health, supporting the argument that one's environment affects one's health. However, there is limited research on the causal direction of this association. I compare a group of households with a child with Cerebral Palsy to a group of households that do not have children with special health care needs. I developed a cross sectional analysis, using survey data, geospatial analyses, and a series of statistical tests to compare differences between the two groups. I complemented this research with 16 in-person interviews to get additional information about their environment and daily routine experiences. I find that families with a sick child live in poorer neighborhoods overall. Possible pathways that explain the reason why sick households might live in relatively poorer neighborhoods in comparison to the non-sick households are lower economic productivity, relatively worse mental health, and lack of time due to special caregiving needs and distant living locations.
All pathways might potentially operate in conjunction to negatively impact the material, social,
psychological, and time resources needed in order to improve neighborhood choice. The results suggest that health places families at peril by decreasing their ability to live in better neighborhoods and increasing their exposure to stressors that could potentially reinforce their poor health.
ACKNOWLEDGMENTS
I would like to thank DUSP and MIT for giving me the opportunity to be part of the great group of
people that makes up the department and institution. I am grateful for the financial support received
by the department and CONACYT that made my time here possible. It is an experience that I will
carry forever and hope to share in the future places I will be.
This last semester has been one of the most demanding both intellectually and emotionally I've experienced in my life. I would like to thank Mariana and Chris for their support, motivation, patience, and passion shared along the course of this semester throughout their classes and thesis advice. I would also like to extend my gratitude to Eran for his caring advice during these past two years.
This thesis would not have been possible without the support from personnel at Instituto Nuevo Amanecer, as well as the knowledge and inspiration they transmit throughout their amazing work day by day. Thank you Lily, Marco, Lupita, and Zulema for letting me be part of the substantial work that you and the rest of the team do for the past 4 years.
I am forever grateful for the love and moral support from my family and friends from Mexico,
especially from my parents Javier and Maruca, my sisters Pia and Regina, and my twin sister Fernanda who helped me navigate the last weeks of this thesis adventure. I would also like to extend my gratitude to my grandmother Alicia who supported me to live in Cambridge and stay healthy. Finally, I would like to thank my friends at MIT and Harvard who shared with me a piece of their lives during this time. Especially, I am forever grateful with Lindiwe, Jenny, and Teddy for their friendship and support in finishing this thesis. And also with Santiago and Fernando who shared their passion, knowledge, and friendship, and helped turn our apartment into a warm Mexican home for these past two years. I am truly excited about the future that awaits for all of you, and hope to keep being a part of it.
TABLE OF CONTENTS
ABSTRACT 3 ACKNOWLEDGMENTS 5 TABLE OF CONTENTS 7 FIGURES 9 TABLES 9 INTRODUCTION 11FOCUS OF THIS STUDY 12
1 CONTEXT 14
2 LITERATURE REVIEW 18
2.1 HEALTH SELECTION INTO NEIGHBORHOODS 18
2.2 HEALTH IMPACT ON HOUSEHOLD'S CAPABILITIES 21
3 METHODS 23
3.1 DATA COLLECTION 24
3.1.1 Qualitative Interviews 24
3.1.2 Survey 25
3.1.3 GIS based measures 27
3.2 ANALYTIC STRATEGY 33
3.2.1 Neighborhood Characteristics 35
3.2.2 Household characteristics 37
3.2.3 Mechanisms linking sick households to poor neighborhoods 38
4 FINDINGS 40
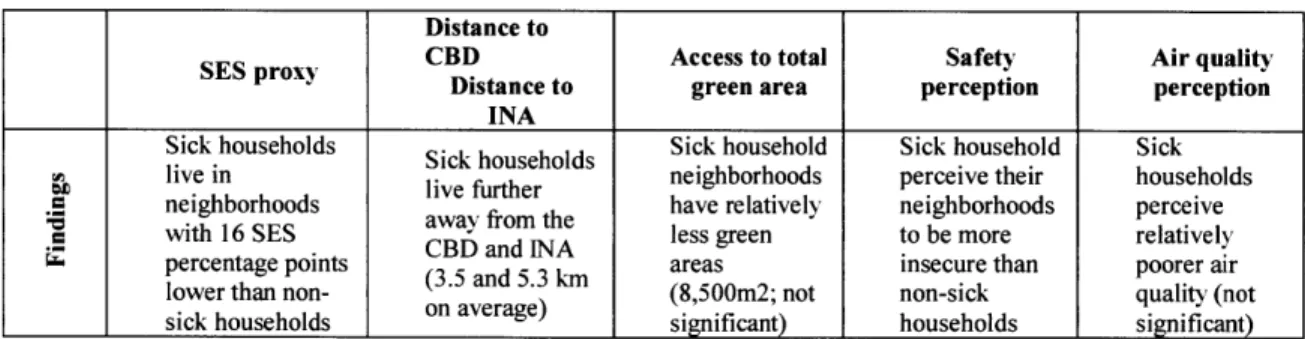
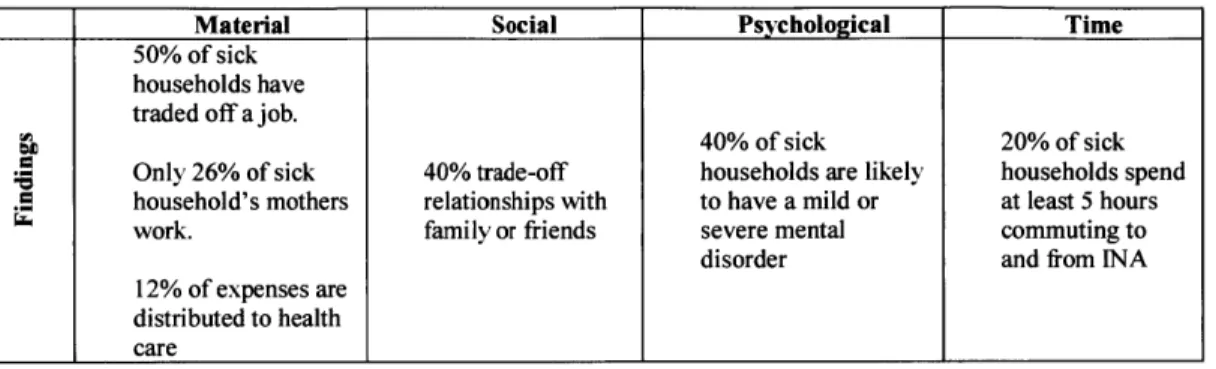
4.1 SUMMARY OF FINDINGS 40
4.2 DEMOGRAPHICS 41
4.3 NEIGHBORHOOD CHARACTERISTICS 42
4.3.1 Neighborhood socio-economic status 42
4.3.2 Distance to CBD and INA 42
4.3.3 Access to green area 45
4.3.4 Safety perception 45
4.4 HOUSEHOLD CHARACTERISTICS 46
4.4.1 Household Income 46
4.4.2 Employment and Education 46
4.4.3 Homeownership and household size 47
4.5 MECHANISMS LINKING SICK HOUSEHOLDS TO POOR NEIGHBORHOODS 48
4.5.1 Material 49 4.5.2 Social 50 4.5.3 Psychological 51 4.5.4 Time 52 5 DISCUSSION 54 6 CONCLUSION 57 RECOMMENDATIONS 58 FURTHER RESEARCH 61 LIMITATIONS 62 REFERENCES 63 APPENDIX 67 INTERVIEW QUESTIONS 67 SURVEY 69
FIGURES
FIGURE 1 METROPOLITAN AREA OF MONTERREY (IMAGE TAKEN FROM GOOGLE EARTH, 2016) 16
FIGURE 2 SAMPLE'S RELATIONSHIP WITH INA 26
FIGURE 3 NEIGHBORHOOD POLYGONS AND CENTROIDS EXAMPLE 28
FIGURE 4 RESIDENTIAL LOCATIONS COLORED BY GROUP. 28
FIGURE 5 SOCIOECONOMIC STATUS PROXY MEASURED AT THE AGEB LEVEL 29
FIGURE 6 ACCESS TO TOTAL GREEN AREA IN AN 800 METER WALKSHED 30
FIGURE 7 CBD -NUMBER OF JOBS OVER HECTARES 32
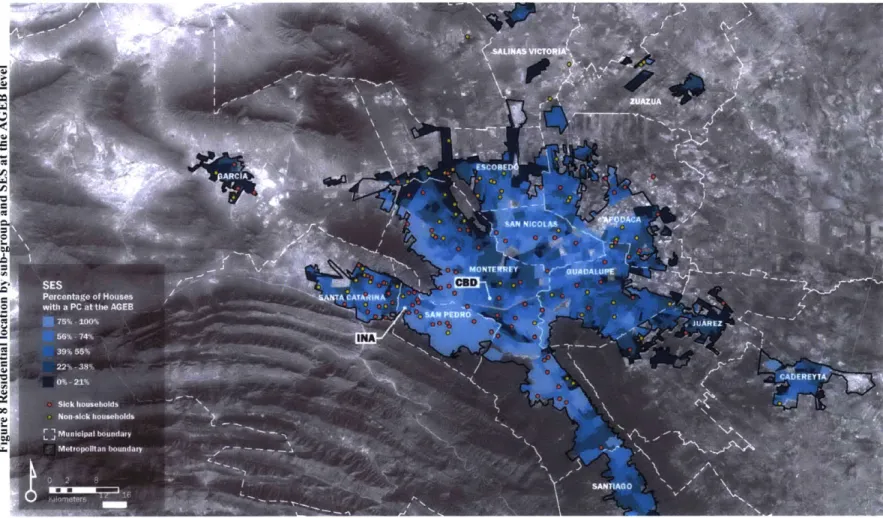
FIGURE 8 RESIDENTIAL LOCATION BY SUB-GROUP AND SES AT THE AGEB LEVEL 43
FIGURE 9 "LA INDEPENDENCIA" NEIGHBORHOOD (IMAGE BY AUTHOR, 2015) 53
TABLES
TABLE 1 ANALYTIC FRAMEWORK TO ASSESS NEIGHBORHOOD QUALITY BASED ON REVIEWED NEIGHBORHOOD
IMPACTS ON HEALTH 34
TABLE 2 ANALYTIC FRAMEWORK TO IDENTIFY POTENTIAL MECHANISMS FROM POOR HEALTH TO POOR
NEIGHBORHOODS 34
TABLE 3 NEIGHBORHOOD CHARACTERISTICS FINDINGS 40
TABLE 4 POTENTIAL MECHANISMS TO POOR RESIDENTIAL ENVIRONMENTS FINDINGS 41
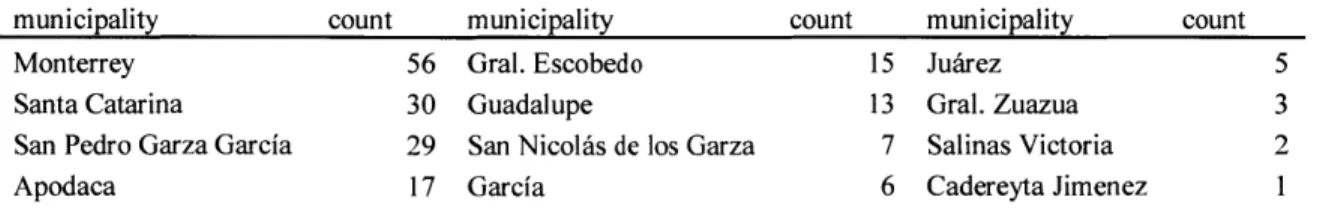
TABLE 5 RESIDENTIAL LOCATION: MUNICIPALITIES 42
TABLE 6 CONTINGENCY TABLE BETWEEN SUBGROUPS 44
TABLE 7 CAPABILITIES CONTINGENCY TABLE 48
INTRODUCTION
Previous research has shown that poor health impacts a household's material and psychological resources due to the uneven distribution of time, money, and psychological resources needed to effectively manage the illness of the sick person's condition while completing the activities of everyday living (Kuhlthau et al., 2005) (Raina et al., 2005). This positions health as a risk factor for residential selection into poor areas by limiting the resources that families have to either leave or avoid being forced into them. Studies have supported this argument by identifying poor baseline health status as a predictor of poor residential outcomes, where people receiving financial aid to move into better neighborhoods have been less likely to do so because they are taking care of a sick child (Arcaya et al., 2014) (Pashup et al., 2005).
Previous literature reviews links between poverty and health (Glymour, Avendano, & Kawachi, 2000) (Link & Phelan, 1995); health and economic productivity (Kuhlthau et al., 2005) (Merlis, 2002) (Kim, Nam-Hyeon, Sohn, Dong-Won, Wall, 1999); the reproduction of health (Raina et al., 2004) (Parminder Raina; Maureen O'Donnell; Peter Rosenbaum; Jamie Brehaut et al., 2005); social
and built environment and health (Painter & Waters, 2013) (Ellen, Mijanovich, & Dillman, 2001)
(Frank et al., 2006) (Pope et al., 2009) (Cubbin, LeClere, & Smith, 2000) (Sallis, Floyd, Rodriguez,
& Saelens, 2012); and health and neighborhoodselection (Arcaya et al., 2014) (Sampson & Sharkey, 2008) (Pashup et al., 2005). The range of interactions between health, place, and wealth that these
studies review illustrates the complexity of determining the causal direction of the relationship between health and the resources people have available. This problem reinforces the need to understand the role that health plays in limiting a sick household's ability to improve its residential
location as a step to better life conditions.
A major implication for this study is the potential re-production of health, whereby baseline health
problems could reinforce poverty and residential selection into poor environments that in turn would potentially increase household's exposure to health risks found in the social and built environment.
FOCUS OF THIS STUDY
This study investigates a population based in Monterrey, Mexico that has a child with Cerebral Palsy in their household. Cerebral Palsy' (CP) is a health condition that, in most cases, inhibits patients from controlling voluntary bodily movements, which in turn make them dependent on a caregiver to do basic daily activities such as eating, walking, or bathing. As I have noted, this caregiving process is normally associated with negative impacts on parental employment and increased financial costs (Kuhlthau et al., 2005) which could limit household's ability to improve their living conditions.
I collaborated with Instituto Nuevo Amanecer (INA), a local non-profit organization that provides
health and education services to children and youngsters with CP in conjunction with their families. This collaboration provided me with access to speak with the members of this specific population and to and survey the specific individual and household characteristics that could potentially limit living in particular places throughout the city.
The setting for this thesis is Monterrey, the third largest city in Mexico, located in the northeastern part of Mexico. The importance of developing this type of study in Monterrey is grounded in three main aspects: first, there is limited research on public health outside of Mexico City, the capital of the country; second, research on neighborhood environment in Monterrey has been mostly focused on residential segregation as a product of urban expansion and market forces(Fitch Osuna & Soto Canales, 2005; Gonzilez & Villeneuve, 2007; Sousa, 2010). While others that have looked at residential selection have only focused on basic preferences such as municipality, architectural style, house dimensions, amenities, building density, and price, without assessing specific health or wealth selection into neighborhoods (Fitch Osuna & Soto Canales, 2012). Third, the relatively poorer health of the population in Monterrey, compared to national averages, might be a manifestation of the city's urbanization over the past decade. Monterrey has recently received attention as the city with most days with poor air quality in Latin America (Green & Sinchez, 2012), and is above the national average in diabetes and arterial hypertension detection for adults over 20 years old (ENSANUT, 2012).
Although this thesis will not address these specific health and urban topics, it is important to acknowledge the consequences of poor health on families, and how poor health reproduces poverty
' I would like to caution that even though CP is not considered a sickness, but a health condition, I use the term
and illness due to the places where sick people are limited to live. This study identifies health as a risk factor of neighborhood selection into poor areas and overviews at the possible mechanisms that hinder people from living in high poverty neighborhoods. I define poor neighborhoods as places where people reside and perform their basic activities and have a relatively low neighborhood socioeconomic status.
In order to make sense of this relationship, my thesis will answer the following questions:
1. Are sick households living in poor neighborhoods?
2. What limitations prevent sick households from improving residential selection?
To answer these questions, this thesis takes on the following structure:
Chapter
1
introduces the background of this research. It contextualizes the problem in the city of Monterrey and illustrates the need for this research.Chapter 2 reviews relevant literature from two viewpoints: The first is how health is a risk factor for residential selection into poor areas, while the second reviews how health difficulties impact a household's wealth.
Chapter 3 presents the methods used to answer the questions. It describes the theoretical reasons why each methodology was applied along with the selected variables and the analytical strategy to prove the hypothesis.
Chapter 4 illustrates and discusses the results in three categories: first, the neighborhood characteristics, followed by the household characteristics and ending with an assessment of the potential mechanisms by which poor health might lead to poor residential environments.
Chapter 5 presents a final discussion of the results based on theoretical expectations.
Chapter 6 reviews the results in relation to the research questions, as well as a brief description of study limitations, and recommendations for future work.
1
CONTEXT
The key problem that this thesis addresses is the impact of health on a household's capabilities to improve its neighborhood choices. Specifically, I evaluate the resources that could potentially limit household's upward residential mobility. I focus on a population of families who have a child or youngster with Cerebral Palsy, who largely depend on a caregiver to complete basic tasks such as eating, walking and bathing, which could turn into a full time dependence. The foregone income, in addition to limited productivity of the caregiver, could increase the long-term impact that poor health has on families and could potentially reduce said family's resources to find better places to live. The following pages describe the overall context where the study is based and the key characteristics that make it an important study to pursue.
Cerebral Palsy
Theories have developed the relationship between poverty and poor health, showing that no matter where in the world, poor populations are exposed to higher health risks than more affluent ones (Glymour et al., 2000). Cerebral palsy is no exception. Research indicates that low socioeconomic status is a primary indicator of developing CP. This is explained by the relationship between low birth weight and prematurity, which are both correlated with low socioeconomic status (Sundrum, Logan, Wallace, & Spencer, 2005).
One of the main clinical features of Cerebral Palsy is the impairment of voluntary movements, which depending on the severity of the condition, inhibits patients from walking, holding objects, and sitting straight (Krigger, 2006). This represents a major challenge for parents because it makes the patient almost 100% dependent on them to function. Moreover, there is no cure for CP, but patients can improve their physical conditions through physical therapy (Rosenbaum et al., 2007). This turns into a main challenge for parents because they must balance their daily activities with the need to supervise their child's health difficulties in the best way possible (Parminder Raina; Maureen O'Donnell; Peter Rosenbaum; Jamie Brehaut et al., 2005). In addition to a negative impact on parental employment, parents also face the risk of suffering higher rates of stress and poor mental health (Kuhlthau et al., 2005) which can in turn reduce their capabilities to access more resources or give proper attention to their child with special health care needs, not to mention the rest of the family.
The population sample being studied attends INA on a regular basis. It is comprises both INA's clients and employees. Clients can be both parents who receive special training and psychological support, as well as children who attend INA to receive special education and therapy. All employees work at INA on a daily basis, and half of the clients receive treatment nearly every day, though a few attend only once every two weeks or up to once a month.
Monterrey
All of the selected participants reside in the twelve municipalities that constitute the metropolitan
area of Monterrey (MAM, Figure 1)2. As I will describe later, there is no pattern of where both clients and employees of INA live, although there is a significant difference in the distance between the city
center and their residential locations, with the clients group living farther out.
An important aspect about setting this study in the city of Monterrey is that in spite of its relatively high average income and education levels compared to national averages (Imco, 2012), there is little to no interest in addressing the preventive factors that could reduce the health risks that a large share of its population are currently exposed to (ENSANUT, 2012). Studies have looked extensively at the relationship between the built and social environment and health, where the land use and street patterns tend to influence physical activity through travel behavior. Poor areas tend to have higher rates of exposure to violence and pollution, or lower access to green areas and walkable environments which in turn may have worse mental and cardiovascular disease outcomes (Cerin, Saelens, Sallis,
& Frank, 2006; Ellen et al., 2001; Handy, Boarnet, Ewing, & Killingsworth, 2002).
These risk factors are not extraneous to the places where the population being studied lives. If we follow the urban development patterns that the city has experienced, together with the high rates of crime in the previous years, we can assume that a large portion of the population is being exposed to such health risk factors. Mexican cities have gone through a particular process of suburbanization over the past 10 years due to massive development of affordable housing in the peripheries of the cities, and Monterrey has not been an exemption (Gonzilez & Villeneuve, 2007). An important concern, is that many of these relatively new housing developments, which initially helped reduce the critical housing shortage, are now being abandoned due to the distance from the city center and jobs, as well as overall poor infrastructure and construction quality (OCDE, 2015). Another health risk that inundated the city over the last decade was the wave of violence. Near the end of the last decade, and up to 2014, the AMM, together with many other places in Mexico, experienced extremely high rates of violence and criminal activity partly due to the confrontations with the drug
2 MAM is the third largest city in Mexico with a total population of 4,106,054 persons, after Guadalajara (4M)
cartels in the country. By 20 10, the city had one of the highest insecurity perception rates in the country: 60% of the population perceived the city to be unsafe, while the national average was 49% (Irmco, 2012). Based on my experience living in the city while this was happening, different populations experienced crime, insecurity, and urban violence differently, and most of it depended on the places where they lived.
While the city has been facing such pressing challenges, there has been little to no research on how this is affecting the population, and hox people are being lorced to live in such risky places. Urban studies in the city have been mostly focused on higher level studies on residential segregation as a product of urban expansion and market forces (Fitch Osuna & Soto Canales, 2005) (SoLIsa, 2010) (Gonzdlez & Villeneuve, 2007). While others that have looked at residential selection have only focused on basic preferences, such as municipality, architectonic style, house dimensions, amenities, building density, and price, without assessing specific health or wealth considerations as part of selection into neighborhoods (Fitch Osuna & Soto Canales, 2012).
FigLIeC I Mietropolitan area of NMonterreN (image taken from Google Earth, 2016)
ow Z77:s&
LS' .'
How did they end up living there?
Living in poor places can have severe health outcomes. For poor and sick families, this can be catastrophic due to the latent risk of having to manage the emotional, physical and financial burden of dealing with two persons in the family with ill health. Literature reviews that this possibility is latent (Arcaya et al., 2014) (Pashup et al., 2005), because poor and sick households might have relatively lower capabilities to acquire wealth (Kuhlthau et al., 2005; Parminder Raina; Maureen O'Donnell; Peter Rosenbaum; Jamie Brehaut et al., 2005), which can in turn restrict them to live in poor neighborhoods, or are sorted into them longitudinally, and in times in a "multigenerational" manner (Sharkey, 2013).
The research presented at the beginning of this chapter regarding the unidirectional relationship between place and health represents the status quo of the studies on the relationship between the built and social environment and health. It essentially positions the environment as the risk factor to poor health, but it avoids addressing the problem of causality, which means that perhaps these poor places show poor health because it is unhealthy people that end up living there, and not vice versa (Arcaya et al., 2014). There are other researchers who have looked at health as a risk factor to poor neighborhood outcomes, and have found that, in fact, unhealthy people tend to live in poor places, however, the mechanisms by which this occurs are as of yet unknown (Arcaya et al., 2014). Explanations on why this might occur will be further discussed in the literature review.
My motivation
Four years ago, I co-founded an organization, Mas Libertad Menos Barreras (MLMB), which works with these same families to transform their houses into places by making them handicap accessible, where both the child with CP and the caregiver can be as independent as possible and free from any health risks. My intention with this thesis is to understand the levels of accessibility that go beyond the physical barriers and understand how poor health is in itself a risk to accessibility.
In addition, I think that inequities in health should not be an overlooked topic. It is unfair that the population that faces more challenges to become economically stable, to access education, to live in safe places, are the same one that is at higher risk of having poor health outcomes. Cities are going to keep growing, population will migrate, inequalities might turn into despair, violent conflicts continuously arise, and, in the meantime, our planet is overheating. The future health challenges are beyond our imagination, and understanding how health itself is a risk factor to other exposures is key in creating urban policies with the potential to generate health equity.
2 LITERATURE REVIEW
I hypothesize that poor health acts as a risk factor that limits households from living in more affluent
neighborhoods, which literature defines as health selection into neighborhoods. I review literature on health selection into neighborhoods, together with the impact of health on household's resources.
2.1 HEALTH SELECTION INTO NEIGHBORHOODS
"People may be sorted into neighborhoods according to individual characteristics, and these individual characteristics may be related to outcomes" (Diez Roux, 2001)
Studies on the relationship between health and place have focused mainly on the unidirectional impact of poor places on health, where places with limited resources, or high exposure to risks disproportionally impact a population's health. For example, studies have focused on the association between access to parks and physical activity, which could potentially impact cardiovascular diseases (Brownson, Hoehner, Day, Forsyth, & Sallis, 2009) and mitigate stress through social support (Painter & Waters, 2013). In other cases, studies of the relationship between the social dynamics of places and health, such as exposure to violence, have identified an impact on smoking prevalence and poor birth outcomes (Ellen et al., 2001), however, there is limited research on the reverse causation of this phenomenon, where unhealthy people might be living in economically deprived areas due a complex set of characteristics (Arcaya et al., 2014).
There have been two major public programs that intend to help families move from high to low poverty neighborhoods: Moving to Opportunity (MTO) and Gautreaux Two. Many researchers have been interested in looking at the changes in health outcomes of families that relocated successfully. However, some studies have focused on the reasons why some failed to move, or relocated to higher poverty areas. Studies based out of the MTO experiment, discovered that households with baseline health problems were less able to move and predicted moves to a higher neighborhood poverty rate
(38% compared to 50%). Whereas no relationship was found between neighborhood poverty and
health status (Arcaya et al., 2014) (Arcaya, Waters, & Subramanian, 2015). Another study found an association between child health problems and relocations to lower income neighborhoods (Dunn,
Winning, Zaika, & Subramanian, 2014), even when all families had equal financial support to relocate to more affluent neighborhoods.
Pashup et al. assessed the Gautreaux Two housing mobility program, and found that of the enrolled families, only about one-third relocated successfully to lower poverty neighborhoods. They found that there were two main barriers to moving, and defined them as external (rental market, discrimination and bureaucratic delays), and internal (health problems, a large household size, and limited experience in managing the program requirements). In addition, they found that "non-movers" had little time to deal with the complicated process to find a new place because they were too busy with work or school (Pashup et al., 2005).
These studies support the evidence that health is a risk factor for poor neighborhood attainment, not just by limiting people to choose lower income neighborhoods, but by limiting their capabilities to move.
The empirical evidence showing that health plays a role in neighborhood selection confirms that the pure desire to move or live in particular places is not enough to let people relocate. Decisions that people make are influenced by a complex set of factors operating at the same time, such as resources, preferences, and changing life circumstances (Sampson & Sharkey, 2008). These factors might limit people to stay in the places they live, or sort them into particular neighborhoods.
Other studies based in Chicago identified a set of variables that influence neighborhood selection. They found an association between such variables and the relative advancement or regression in neighborhood outcomes. Sampson and Sharkey found that characteristics that predicted mobility to higher income neighborhoods were household income and education, together with higher education of caregivers. Other characteristics that also influenced a positive move were buying a home and getting married. Social support from friends and family to caregivers was another characteristic related to higher income neighborhoods (Sampson & Sharkey, 2008).
Moreover, the study identified household characteristics that were associated with lower mobility and higher poverty outcomes. First, even though homeownership was associated with higher neighborhood incomes, baseline homeowners had lower rates of mobility out of Chicago. Similarly, compared to marriage as a factor that predicts positive neighborhood attainment, cohabiting was associated with an inverse outcome.
Such findings are backed up by two other studies, where they identify that higher education and getting married increased the probability of moving out of low income neighborhoods, while older age, and homeownership reduced it (South & Crowder, 1997). Van Lenthe et al identifies that women's education level increased the probability of upward mobility, while lower education showed an increased probability in moving downwards (van Lenthe, Martikainen, & Mackenbach,
2007).
Arcaya et al propose a set of material, social and psychological pathways by which poor health might influence residential selection into poor neighborhoods. Material pathways are produced by the disproportionate distribution of health related expenses that lead to poverty and least expensive neighborhoods; social pathways develop through dependence on social support for caretaking, which motivates moves closer to family or relatives; and psychological pathways are a product of the impact that health has on parents' well-being due to stress and unexpected expenses, which might "reduce mental energy to seek, move to, and stay in new neighborhoods". (Arcaya et al., 2014)
2.2 HEALTH IMPACT ON HOUSEHOLD'S CAPABILITIES
Possible causes for the incidence of health on poor neighborhood selection are related to the impact that a sick child has on parents by limiting their capabilities to access key resources. Access to opportunities is essential for well-being and human development, especially in countries in a developing phase (Zegras, 2011). In my reviewing of the literature on mobility and accessibility, authors have defined three components by which we can measure and understand the distribution of resources available for people to benefit from and achieve well-being: the land-use component (amount and distribution of resources spatially); transportation component (time, cost, and effort of using the transportation system, together with its location and characteristics); temporal component (availability of resources at specific times, and time available for individuals to access them); and individual component (needs, abilities, and opportunities of persons) (Geurs & van Wee, 2004). Capabilities are conceptualized by Amartya Sen as the "freedom to achieve the 'functionings' that individuals have reason to choose (Zegras, 2011). One could suggest that there is a reciprocal relationship between each accessibility component in impacting such capabilities that could contribute to residential selection into poor neighborhoods.
Two of the capabilities at the household level that could potentially provide access to resources, are good mental health and economic productivity. Studies show that caregiving not only plays a role in producing poor mental health for parents, but also in limiting economic productivity due to reduced employment and higher costs both "out of pocket" and special care needs. (Kuhlthau et al., 2005). This implies that parents with sick children have to make trade-offs that reduce their opportunities to access income, employment or the financial security to make future plans or investments.
Previous studies have found that 40% of families with a special care needs child experienced financial burden (Kuhlthau et al., 2005), which could be explained by the higher out-of-pocket spending by sick households on average (Hwang, Weller, Ireys, & Anderson, 2001). It has been found that some families with sick children have up to 20 times higher uncompensated health care costs than families without sick children (Kim, Nam-Hyeon, Sohn, Dong-Won, Wall, 1999). An important implication that could balance this financial situation is that mothers who usually are the primary caregivers have high rates of unemployment or unpaid employment. Studies have found that close to 75% of mothers who have a sick child are enrolled in unpaid work activities (Curran, Sharples, White, & Knapp, 2001) or have to quit employment to take care of a child at home (Kim, Nam-Hyeon, Sohn, Dong-Won, Wall, 1999). Some are experiencing an even more challenging
situation because of their marital status. Comparing single caretakers with mothers in two-parent families, single caretaker are 15 times more likely to quit their jobs (Kim, Nam-Hyeon, Sohn, Dong-Won, Wall, 1999). In addition, many family-related problems are related to financial issues (Kuhlthau et al., 2005), and many caregivers have little to no extended family support (Curran et al., 2001).
As I mentioned before, there is a risk of producing poor mental health outcomes due to the complications of having to manage the illness of a sick child, while simultaneously having to complete daily activities. Studies find that stress is more prevalent in parents of children with special care needs relative to parents whose children do not need special care attention (Dyson, 1996; Parminder Raina; Maureen O'Donnell; Peter Rosenbaum; Jamie Brehaut et al., 2005).
A last important thing to consider, is that the opportunity cost for a family that has to distribute
important significant resources into attending to special care needs of a sick member can have lagged effects on the household across generations. Research has looked at the persistence of poor neighborhood attainment as a "multigenerational nature", which parallels persistent income and education inequality across multiple generations (Sharkey, 2013). Persistent health inequality is a potential risk of developing a poor-residential environment trap due to the impact between the reinforcing mechanisms of health, income, and poor residential environments.
3 METHODS
In this section, I describe the methods used to answer the thesis questions:
1. Are sick households living in poor neighborhoods?
2. What limitations prevent sick households from improving residential selection?
In order to respond these questions, I developed a cross sectional analysis, using survey data, geospatial analyses, and a series of statistical tests to compare differences between the two groups. I complemented this research with 16 in-person interviews to get additional information about their environment and daily routine experience.
In summary, the analytical strategy was the following:
a. I first compared the neighborhood characteristics between sick and non-sick households. I estimated the quality of the neighborhood based on risk factors to health that previous research has identified at the neighborhood level. These risk factors are led by neighborhood socioeconomic status along with distance to the Central Business District (CBD) and INA, access to green spaces, and the perception of safety and air quality.
b. Second, I compared the socio-demographic profile of both groups. I acknowledge that the sample
is not random, but this process aims at understanding the main socio-demographic differences between sick and non-sick households that, according to the literature, have a relationship with living in poor neighborhoods.
c. I then assess the potential mechanisms by which poor health leads to poor residential environments. I do so by comparing the availability of four resources between sick and non-sick households.
3.1 DATA COLLECTION
3.1.1 Qualitative Interviews
I conducted 16 semi-structured interviews with INA clients this January in Monterrey. The purpose
of carrying out the interviews was to have a sense of the experience these families have navigating the city, how living in different places has helped or affected them in accessing the resources they need, and what are their limitations or desires to find a better place to live.
Qualitative research enables the study to capture the perspectives of the participants, understand the meaning of real-life events, and more importantly, discover the contextual conditions - the social, institutional, and environmental conditions that define people's lives (Yin, 2011). Conducting the interviews helped me identify multiple circumstances related to how the places where people live have an impact on their lives (i.e. discrimination, house quality, marital status, residential ownership) and the complications of navigating the city, both on a daily basis and on residential re-location. Interviews lasted approximately 40 minutes on average, and they took place at INA's center. The criteria for selection was random. INA has a client dataset organized by each child's last name. The first twenty numbers were invited to participate. Eighteen of them were available and willing to participate, however, due to time constraints only 16 families were interviewed. There was no type of compensation for the participants.
The interview questions were addressed to understand three main things:
1. The places they've lived. One question this thesis aims to answer is how sick households are
limited to live in relatively lower poverty neighborhoods. As discussed earlier, having a sick child within the families puts an extra burden on them, and some might have to adapt their living styles in order to cope with the change (Parminder Raina; Maureen O'Donnell; Peter Rosenbaum; Jamie Brehaut et al., 2005).
2. How they access their resources. Every person's journey to work, run errands, buy food, and get to the health center is unique and presents costs that have a quantitative and qualitative significance (Curran, Sharples, White, & Knapp, 2001).
3. Desire to move. The final part of the interview questions was focused on understanding future
residential expectations. Hypothetically or not, understanding people's willingness to achieve their intentions, desires and limitations, is a key question that could help assess a potential "self-selection" conflict in the data (Sampson & Sharkey, 2008).
3.1.2 Survey
After conducting the interviews, I realized there was the need and research potential to distribute a survey with an aim to descriptively collect the population's characteristics. But rather than focusing on the population that has a child with CP, the survey aimed at collecting sufficient data and create two sub-groups: households that have a sick child and households that don't, which for the purpose of this study I call sick households (for households who stated living with a child or youngster with
CP) and non-sick households (for the remaining part of the sample who stated not living with a child
or youngster with CP). The intention in doing so is to be able to compare their differences and assess whether health impacts the possibilities for families to live in lower poverty neighborhoods.
Sample
The intended sample size was 200 persons to ensure a response variety, with an intention to keep a balanced ratio of the two household sub-groups mentioned earlier. The inclusion criterion is every person that has a relationship with INA, meaning that attends daily or at least once a month. The survey was designed and distributed using the online survey software provided by MIT: Qualtrics.
INA personnel were in charge of distributing the survey and granted me access to the results.
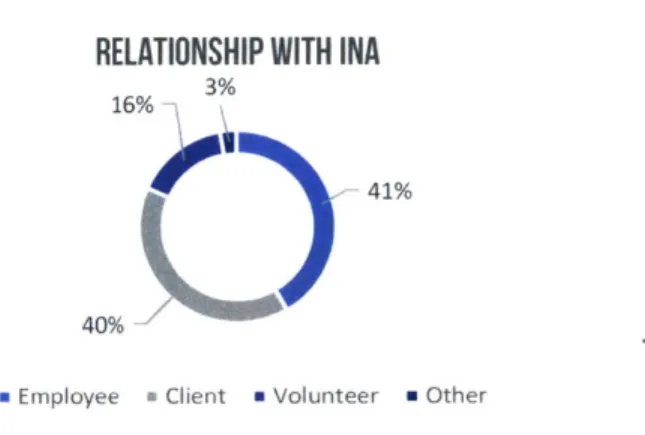
There are three main groups of people that attend INA on a daily basis: employees, clients, and volunteers. Figure 2 describes the distribution of the sample according to their relationship with INA. Employees: Due to the variety of services that INA provides, the demographics of its population are varied. Teachers, doctors, occupational therapists, social workers, administrative personnel, gardeners, and bus drivers are some job types. According to my conversations with INA's director, the population's gender share is close to half and half.
Clients: The population that attend INA to receive some type of service is mostly comprised of low income parents who bring their child with CP to receive any of the services described before. Volunteers: There are three main types of volunteers that attend INA: medical students (i.e. dental, physical therapy, nutrition, etc), high school and undergrad students doing hours of service, and volunteers from the community at large.
Not all of the responses were used for this study. The total bulk of responses by April 6 of 2016 was 210, however, the database had to be cleaned to end with a total number of 185 due to various reasons:
- Some addresses could not be located in the metro area, or belonged to another city. - Not all sections of the survey were answered, or the survey was left incomplete.
- Responses were difficult to analyze (i.e. respondents misunderstood open questions and the answer could not be interpreted).
Figure 2 Sample's relationship with INA
RELATIONSHIP WITH INA
3% 16%
41%
40%
m Employee Client m Volunteer n Other
Description of the Survey
The survey included 74 questions that looked at the categories presented below. It is important to note that the extension and coverage of the survey was decided in order to be able to develop further studies. The full survey can be found in the appendix. These are the categories and examples of questions that the full survey addressed:
- Respondent's individual characteristics (e.g. age, sex, marital status)
- Household level characteristics (e.g. child with CP in the household, average monthlv income,
average weekly expenses, education level of both parents, employment status of both parents, household size, homeownership, access to vehicle)
- Quality of the housing (e.g. house type, construction materials, quality satisfaction,
overcrowding)
- Neighborhood quality (using the NEWS instrument which looks at land use diversity, land use
accessibility, street configuration, walking quality, neighborhood aesthetics, traffic safety, and crime safety)
- Travel experience (e.g. travel mode, travel times, transportation quality);
- Time allocation (i.e. time spent on different activities such as sleeping, taking care of kids,
physical activity, work, etc)
- Neighborhood Social Capital (using 10 questions that ask about interactions between neighbors) - Neighborhood Selection (e.g. previous residential location, residential preference)
- Individual trade-offs that the respondent has had to make in order to take care of child's health needs (e.g. relationships with family andfriends, a good job, school, etc)
- Physical and Mental Health (self-assessment of health status)
- Financial Security (security offuture income, and security offuture expenses)
3.1.3 GIS based measures
In order to measure the neighborhood level characteristics that the survey could not address, I used the residential location obtained from the neighborhood name, postal code, and municipality, to geo-locate every response. The variables calculated are neighborhood socioeconomic status, number of jobs in the neighborhood, distance to INA, and the Central Business District (CBD) of the MAM.
The calculation of such variables was developed following the process I detail below.
Geocoding locations
Survey data provided the neighborhood names, postal code, and municipality from each response. I used
INEGI's
neighborhood and postal code georeferenced database to match responses.Not all respondents' "neighborhood name" matched perfectly. I had to manually confirm the accuracy by matching their input name to the database's neighborhood's name, using the municipality and postal code as a guide in case there was more than one neighborhood with the same name. This process was the main criterion to clean and discard respondents. An iterative process of joining the respondent's addresses with INEGI's database was done to be able to localize them
spatially. Those whose addresses were not identified were removed from the sample.
The final step was to calculate the centroid of each neighborhood's polygon, and use that as the point of reference for each response. The outcome of this process is seen in detail in Figure 3, while Figure 4 shows all the respondents distributed across the city divided by the sick households and non-sick households groups.
-11.6U.-Figure 3 Neighborhood polygons and centroids example a ii 1~ N.Ighborhoods 0 Sick households
Non sick households Neighborhood .Kiometers Reeldeutial Location S Sick households Non-sick households Metropolitan boundary
0
1.2525 5 75 10 - - - K019=Z=K
'sho HERE DeLame Mapn"ndta 'penStreetMw a -Contr a, h. ,V e
Figure 4 Residential locations colored by group.
*
'
Ya
Kilometers
Esi HERE Detl ome Mapmylndia penStree ap ciotributors and the GIS user community
I
| .
Neighborhood Socioecononic Status
Matching the neighborhood socioeconomic status (SES) with each respondent is the first step to answer question 1: Are sick households
living
in poor neighborhoods? And as I reviewed earlier, there are many negative social and health implications in living in a low socioeconomic status or poor neighborhood. Studies find a strong relationship between low SES and risk of homicide or crime (Cubbin et al., 2000), and residents might be exposed to higher levels of pollution and relatively lower places to be physically active (Arcaya et al., 2014).In order to calculate the socioeconomic status (SES), I developed a proxy measure using the total number of occupied houses with a computer in the AGEB3 over the total number of occupied houses in the AGEB (see formula below). This creates a ratio of houses with a computer which previous measurements (ITDP, 2014) confirm is a reliable measure considering its strong and positive correlation with education and income level. Following this, I matched the obtained AGEB value to each residential location to assign an SES value per household. Figure 5 illustrates the process.
Computer proportion Number of inhabited houses at the AGEB with a computerTotal number of inhabited houses at the AGEB
Figure 5 Socioeconomic status proxy measured at the AGEB level
I
Residential Location and SES Sick bousetlolds N'kn sCk house.holas 75% 100% 56% 74% 56% 22% 38% 0% 21 %AGEB is the "Area Geoestadistica Basica"; the spatial unit of measure that INEGI uses by grouping census blocks. This unit is comparable to the "census tract" from the US census.
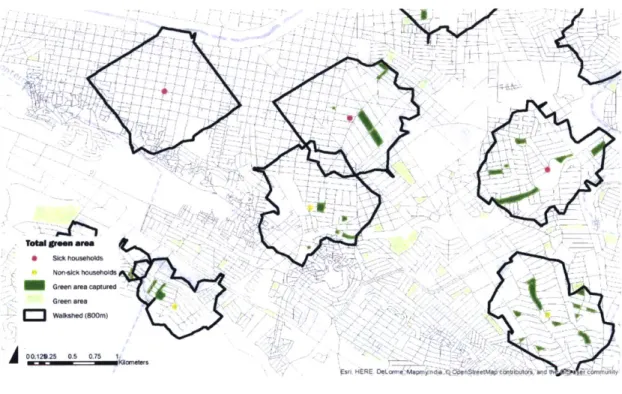
Access to total green area
The first step to measure the total green area accessible by each residential location, an 80Gm (0.5 mile) street network buffer zone using the street network4 was calculated using GIS on every respondent's neighborhood centroid. These calculations were done using ESRI ArcGIS software. The 800m distance is used as the standard for the planning of U.S. transit oriented developments, which is calculated as the distance that people are willing to walk to transit. I used this measure to maintain consistency with other data and to be able to compare for future studies (Guerra, Cervero,
& Tischler, 2012).
Green space was characterized as total public green area" with an area larger than 25 square meters.
GIS techniques were used to calculate the total green area available at 800m Euclidian distance buffer
from each neighborhood centroid. Previous research has measured green space access by similar modes; total green space vs. usable green space in a 300m and 3km Euclidian distance buffer. Measures include distance to usable green space, distance to total green space, proportion of usable green space over total green space, and proportion of total green space (both proportions calculated for 300m and kin) (Nutsford, Pearson, & Kingham, 2013). Figure 6 illustrates the procedure taken.
Figure 6 Access to total green area in an 800 meter walkshed
N
C
Total green area
SICk vousehuods
Non-sick househoi
Green area captured
Green area
3
Walk'shed (800m4
29 25 05 0 7Esr, HERE DeLorr Mape r ndia OperStreetMap ConUutr 9
The vector street network for Monterrey was provided by INEGI's website. Green area shapefiles per city are available at INEGI's webpage:
http://www.iiiegi.org.mx/geo/conteni dos/urbana/default.aspx
30
Distance to CBD and INA
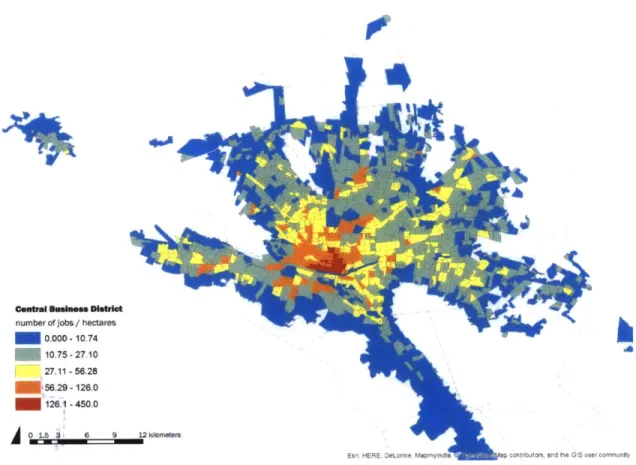
The Central Business District (CBD) in the AMM plays a key role in the daily functioning of the city. Besides hosting commercial and office activity, it informally operates as the transportation transfer zone. Most of the bus routes have the CBD as either the origin or the destination of a trip, so getting easy access to this area is key to improving accessibility to the wider metropolitan area. I chose the center of the main plaza - "La Alameda" as the location of the CBD geo-located point. This was not arbitrary. Based on the interviews, this is the point where most of the people transfer bus routes. A job density map was developed to confirm that this was the right location using block data from INEGI and a deconstructed measure of number of jobs from DENUE, calculating the number of jobs over hectares (see Figure 7). I used the Origin Destination Matrix tool from ESRI ArcGIS to calculate the distance in meters from every residential location (origins) to the CBD point (destination) using the street network.
In a similar matter and of equal importance, the relation between the location where these families live and INA is essential because it is the the primary daily destination of the majority of the sample. According to my conversations with the department of social work at INA, not every member of INA's community attends daily, specifically INA clients. Nearly half of INA's clients visit the institution on a daily basis either for therapy, special education or medical attention. The other half varies. Some visit INA on a weekly basis, others just once every two months for regular medical check-up. But even though not every person has INA as their daily commute, based on my interviews, commuting here was one of the heaviest burdens for mothers, both because of the cost in time and money, and because of the difficulties to carry their son or daughter when they use public transportation. The distance between INA and the residential locations was calculated using the same technique I used with the distance to CBD calculation.
Figure 7 CBD - number of jobs over hectares
4
Central Business District
number of jobs / hectares
0 000 -10 74 10 75 -27 10 27.11 -56.28 5629 -126.0 126.1 -450.0
0
1.3 3 6 9 12 ,6meters3.2 ANALYTIC STRATEGY
As I described before, the purpose of this study is to first determine whether sick families are living in relatively poorer neighborhoods, and then assess the capabilities they have to leave or avoid living in such poor places. Studies widely identify the impact that low SES neighborhoods have on their residents: relatively higher exposure to air pollution (Harlan & Ruddell, 2011; Kan, Huang, Chen, & Zhao, 2009; Pope et al., 2009); fewer places to be physically active (Frank et al., 2006; Painter & Waters, 2013; Sallis et al., 2012); and higher exposure to crime (Ellen et al., 2001; Hammal et al.,
2005). Whereas other studies address the possibility that poor areas host sick populations because
they are systemically sorted into living in them (Arcaya et al., 2014; Sampson & Sharkey, 2008) (Arcaya et al., 2014) (Arcaya, Waters, & Subramanian, 2015). The importance in understanding this relationship is that poor and sick households might be vulnerable to reproducing their illness and poverty status due to their limitations to avoid health exposures or access to resources in the city. In order to assess the possibility that this is happening among the sick population in Monterrey, I divided the analysis in three parts:
a. I first compared the neighborhood characteristics between sick and non-sick households to assess
whether sick households live in relatively poorer neighborhoods. I estimated the quality of the neighborhood based on risk factors to health that previous research has identified at the neighborhood level. These factors are led by an estimation of neighborhood socio-economic status, followed by access to green spaces, distance from the Central Business District (CBD) and INA, and the perception of safety and air quality. Table 1 illustrates the relevance of each exposure according to previous literature together with the selected variables to assess the quality of the environments the studied population lives.
b. Second, I compared the household characteristics of both groups. I acknowledge that the sample
is not random, but this process attempts to understand the main socio-demographic differences between sick and non-sick households to identify potential limitations for neighborhood selection improvement.
c. I then assess the potential mechanisms by which poor health leads to poor residential environments. I do so by building from potential mechanisms identified by previous literature (Arcaya et al., 2014) compared among sick and non-sick households. Table 2 illustrates the theoretical framework and variables chosen to assess the hypothesis being tested
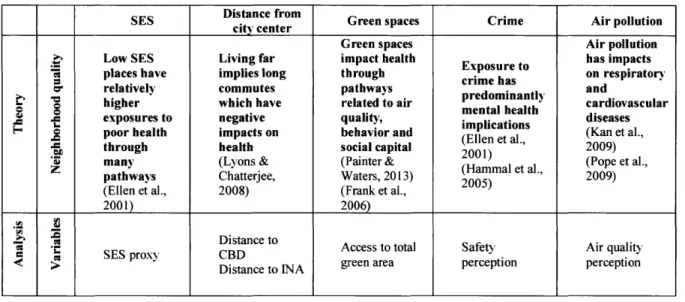
Table 1 Analytic framework to assess neighborhood quality based on reviewed neighborhood impacts on health
SES Distance from Green spaces Crime Air pollution
city center
Green spaces Air pollution
Low SES Living far impact health Exposure to has impacts
places have implies long through ciehson respiratory
r relatively commutes pathways .nand
higher which have related to air mental heanl cardiovascular
exposures to negative quality, diseases
poor health impacts on behavior and (Ellen et al (Kan et al.,
through health social capital 2001) e ' 2009)
many (Lyons & (Painter & 2001) (Pope et al.,
pathways Chatterjee, Waters, 2013) (Hammal et al., 2009)
(Ellen et al., 2008) (Frank et al., 2005)
2001) 2006)
SE Distance to Access to total Safety Air quality
Distance to INA green area perception perception
Table 2 Analytic framework to identify potential mechanisms from poor health to poor neighborhoods
Material Social Psychological Time
E E Moves to placesMovs t plcesMental health Time to deal with
Large households closer to family or mpats selti Ting oesses
preictloer riedsimpacts selection moving processes
S predict lower friends (apo Psu ta.
- mobility (Sampson & Sharkey, (Sampson & (Pashup et al.,
(Pashup et al., 2005) 2008) Sharkey, 2008) 2005)
Low parental employment (Kim, Nam-Hyeon, Sohn, Dong-Won, Wall, 1999)
(Curran et al., 2001) Risks of poor
(Parminder Raina; mental health
Maureen O'Donnell; (Parminder Raina;
Peter Rosenbaum; Maureen O'Donnell;
Jamie Brehaut et al., . Peter Rosenbaum; Caregiving has
2005) aretakng impacts Jamie Brehaut et al., high time costs (Raina et al., 2004) on mental health and 2005) (Raina et al., 2004)
(Kuhlthau et al., productivity (Kuhlthau et al.,
2005) (Raina et al., 2004). Poor mental health 2005)
and poor work (Curran et al., 2001)
Sick households performance
have larger out of (Blank, Peters,
pocket expenses Pickvance, Wilford,
(Kuhlthau et al., & MacDonald, 2008)
2005) (Merlis, 2002) (Hwang, Weller, Ireys, & Anderson, 2001)
Trade-off ajob
(self-reported) Trade-off relationships Mental Health
estimation by Health expenses ratio with friends and/or (K-10 self-assessed stimationdet (percentage of total family (self-reported) survey)
3.2.1 Neighborhood Characteristics
I estimated the quality of the neighborhood based on risk factors to health that previous research has
identified at the neighborhood level. These factors are led by an estimation of neighborhood socio-economic status, followed by access to green spaces, distance from the Central Business District (CBD) and INA, and the perception of safety and air quality. The following pages describe the theoretical relevance of each measure along with an explanation of how each variable was constructed
Neighborhood socio-economic status
The leading question to answer is whether families that have a sick member live in relatively poorer neighborhoods. Studies widely identify the impact that low SES neighborhoods have on its residents due to several factors such as relatively higher exposure to air pollution (Kan et al., 2009) (Pope et al., 2009)(Harlan & Ruddell, 2011); lower places to be physically active (Sallis et al., 2012) (Painter
& Waters, 2013)(Frank et al., 2006); and higher exposure to crime (Ellen et al., 2001) (Hammal et
al., 2005). As I described earlier in this chapter, I calculated the neighborhood SES using a proxy of computer access in the house relative to access to a computer of the rest of the population at the same
AGEB.
Distance to CBD and INA
Living far from the city center or primary destination might imply longer commutes. Studies identify that long commutes might impact health by creating stress, but also by increasing the exposure to accidents or air pollution (Lyons & Chatterjee, 2008). In addition, commute time might further constrain the scarce time resources available to parents with sick children (Curran et al., 2001). The distance to both locations was a GIS calculation using the street network of Monterrey.
Access to green area
As discussed in previous chapters, there are two major links between access to green areas and health. First, urban green spaces provide a place for both social and recreational opportunities, which encourages physical activity, and also enhances social ties serving as a place of encounter. Research also suggests that there is a positive relationship between mental health and observable green space at the neighborhood environment (Nutsford et al., 2013). The second is by mitigating air pollution, noise, and heat exposure (Painter & Waters, 2013). This variable was calculated via the GIS analysis described before, where a total area in the 800 meters walkshed is used to estimate the accessibility to total green area for each household.
Safety perception
Living in places with high crime rates can have negative consequences on health. Beyond the probability of being physically affected by violence, there are repercussions on mental and cardiovascular health. Exposure to violence can increase stress which may impact hypertension and influence negative behaviors in order to cope, such as smoking (Ellen et al., 2001). To develop this variable, I look at the only measure from the NEWS section of the survey that I'm using for the study, which is the "exposure to violence" category. This question includes of five Likert type questions that assess the perception of safety that people have in their neighborhood. The questions asked are:
- "The streets in my neighborhood are well lit"
- "It is easy to see pedestrians and cyclists from the inside of homes" - "I usually talk with other people when I'm walking in my neighborhood" - "There is a high crime rate in my neighborhood"
- "The crime rate in my neighborhood makes it unsafe to go on walks during the day" - "The crime rate in my neighborhood makes it unsafe to go out on walks at night"
Air quality perception
This final neighborhood characteristic variable is also extracted from the NEWS section, though it is the Likert score of only one question which asking about the "pollution while walking due to car exhaust". Even though this might not represent the overall air quality of the local environment, it helps to make an assessment of the perception of what each respondent is breathing in his or her neighborhood streets. In addition, previous research has identified a relationship between traffic-related air pollution and illness (Ponce, Hoggatt, Wilhelm, & Ritz, 2005). Also, studies review how reductions in air pollution are related with an increase in overall life expectancy (Pope et al., 2009).


![[PDF] Cours d'informatique gratuit en ligne](data:image/gif;base64,R0lGODlhAQABAIAAAP///wAAACH5BAEAAAAALAAAAAABAAEAAAICRAEAOw==)