HAL Id: hal-03225169
https://hal.archives-ouvertes.fr/hal-03225169
Submitted on 15 May 2021
HAL is a multi-disciplinary open access
archive for the deposit and dissemination of
sci-entific research documents, whether they are
pub-lished or not. The documents may come from
teaching and research institutions in France or
abroad, or from public or private research centers.
L’archive ouverte pluridisciplinaire HAL, est
destinée au dépôt et à la diffusion de documents
scientifiques de niveau recherche, publiés ou non,
émanant des établissements d’enseignement et de
recherche français ou étrangers, des laboratoires
publics ou privés.
Distributed under a Creative Commons Attribution - NonCommercial - NoDerivatives| 4.0
International License
The influence of technological changes in energy
efficiency on the infrastructure deterioration in the
energy sector
M.Yu. Shabalov, Yu.L. Zhukovskiy, A.D. Buldysko, B. Gil, V.V. Starshaia
To cite this version:
M.Yu. Shabalov, Yu.L. Zhukovskiy, A.D. Buldysko, B. Gil, V.V. Starshaia. The influence of
techno-logical changes in energy efficiency on the infrastructure deterioration in the energy sector. Energy
Reports, Elsevier, 2021, 7, pp.2664-2680. �10.1016/j.egyr.2021.05.001�. �hal-03225169�
Contents lists available atScienceDirect
Energy Reports
journal homepage:www.elsevier.com/locate/egyr
Research paper
The influence of technological changes in energy efficiency on the
infrastructure deterioration in the energy sector
M.Yu. Shabalov
a, Yu.L. Zhukovskiy
a, A.D. Buldysko
a, B. Gil
b, V.V. Starshaia
a,∗aEducational Research Center for Digital Technologies, Saint Petersburg Mining University, 2, street 21st Line, 191106 Saint Petersburg, Russia bLaboratoire Charles Coulomb UMR 5221 CNRS-Université de Montpellier, 34095 Montpellier, France
a r t i c l e i n f o
Article history:
Received 18 November 2020 Received in revised form 2 April 2021 Accepted 3 May 2021 Available online xxxx Keywords: Infrastructure deterioration Technological changes Digital technologies Global challenges Sustainable energy Sustainable development a b s t r a c t
The energy and its entire related infrastructure are the main drivers for a economic development and for ensuring a good level of employment. As part of a global study about international energy sector, we evaluate here the impact of technological changes on the state of the energy infrastructure. This study includes a detailed analysis of the global challenges facing the energy industry. We propose scenarios for the development of a modernized energy infrastructure with an assessment of the entire energy system. Our evaluation indicators are chosen in terms of the reliability of the energy infrastructure, of its quality, of the accidents that may happen and of the consequent environmental risks. This study is particularly adapted for forecasting the necessary measures (of technical nature, of governance kind) that have to be implemented to reduce the acceleration of the infrastructure deterioration rate. Our results reveal that the use of digital and information technologies has many positive impacts on the development and on the control of an efficient consumption of energy. In addition, our predictions, due to the further modernization of the energy sector, can contribute and help in the creation of preconditions that will be highly stimulating and profitable to the growth of investments in the energy infrastructure.
© 2021 The Author(s). Published by Elsevier Ltd. This is an open access article under the CC BY-NC-ND license (http://creativecommons.org/licenses/by-nc-nd/4.0/).
1. Introduction
The energy and the whole infrastructure surrounding it are critical for the economic and social developments of the world. At the most basic level, people need access to clean, safe water for drinking and cooking, and power for lighting and heating their homes. The infrastructure has been positioned by the World Bank Group as an essential agent of change and transformation to address the challenges of achieving a sustainable economic devel-opment and the Sustainable Develdevel-opment Goals (SDGs) proposed by the United Nations. A recent analysis established that 72% of the SDG’s targets require the modernization of infrastructures (ei-ther directly or indirectly) for their attainment (Lezak et al.,2019). Nowadays, to implement the government plans for decarboniza-tion while maintaining a sustainable power supply, an energy transition is being implemented, requiring large investments in the modernization of the energy infrastructure (Szado and Fabok,
2020;Jones,2015;Festel and Wurmseher,2014).
The existing markets for transport and energy sales, as well as the energy infrastructure, have been previously developed during the era of the second industrial revolution until the middle of
∗
Corresponding author.
E-mail address: lerastarshaya@gmail.com(V.V. Starshaia).
the 20th century. In the era of the third industrial revolution, the energy sector is the most conservative constraint on national economy (Zhong,2017;Guerado,2017;Clark and Cooke,2010). Under the dual tasks of economic growth and environmental protection, works ofWang et al.(2020a,b) andSoares et al.(2018) confirmed the importance of developing infrastructures, due to the fact that this affects the energy efficiency and as a straight-forward consequence, the sustainable economic development in the world.
However, providing the capacity of the energy infrastructure to meet the unmanaged growing demand is ultimately unsustain-able, both in environmental and economic terms (Knoeri et al.,
2016). For developing countries, this issue is becoming more urgent than before, due to growth of population (O’Sullivan,
2020; Wilson, 2020; Bucci et al., 2019); due to the increase in urbanization (Mahmood et al.,2020;Wang et al.,2020a,b;Ahmed et al.,2020;Zhou et al.,2020;Xie et al.,2020;Adams et al.,2020;
Shahbaz et al.,2017); due to the exponential increase in amounts of information that require an increased electricity consumption (Dogaru, 2020; Huynh et al.,2020; Bahga and Madisetti,2016;
Clark and Cooke, 2010). In line with the elements given above, the requirements for economy, energy security, environmental friendliness, energy efficiency and adaptability of the energy in-frastructure will be tightened (Soares et al., 2018; Clarke and Wigan,2018;Blum and Legey,2012;Kessides and Wade,2011). https://doi.org/10.1016/j.egyr.2021.05.001
2352-4847/©2021 The Author(s). Published by Elsevier Ltd. This is an open access article under the CC BY-NC-ND license ( http://creativecommons.org/licenses/by-nc-nd/4.0/).
In many developed countries, the deterioration of the energy infrastructure also remains an urgent problem and it requires even more maintenance expenses. The asset renewal due to the deterioration of the habitat and anthropogenic alterations of the climate may change (Wang et al.,2020a,b;Shakou et al.,2019;
Mikellidou et al.,2018;Wright and Batel,2017;Matthews et al.,
2015). Also, the depreciation of fixed assets increases, due to the underfinancing of renovation programs and to the lack of a systematic approach to the replenishment of the material and technical base from the responsible government agencies (Wang et al.,2020a,b).
Every year, the problem of the aging of the equipment is increasing in volume (IRENA, 2019). The problem of the dete-rioration of the energy infrastructure is receiving an increased attention from the governments, the public and the media. This is due to the fact that the main factor that determines the devel-opment of economic indicators of enterprises for all industries, including the energy ones, is the capacity of reconstruction and technical re-equipment of enterprises that are simultaneously modernized (Ginters et al.,2013;European Commission,2020).
In addition, in modern infrastructure, there is a lack of inte-gration of end users, together with the diversity of their needs and behaviors. Access to adequate, reliable and affordable energy remains a major challenge. In many cases, the demand grows much faster than the increase in energy supply, due to the time required to create a new infrastructure, due to the lack of enough funding and sometimes, socio-political reasons (Roelich et al.,
2015).
Our study identifies five main regions, the quality of the en-ergy infrastructure of which was assessed: The European Union, The United States, Asia, Russia and Africa. The quality factor of the energy infrastructure in the world was determined, according to theGlobal Infrastructure Hub(2020). It takes values ranging from 1 to 7. The quality of infrastructure of the energy sector is estimated as follows: 0–2 critical; 2–4 unsatisfactory; 4–6 normal; 6–7 favorable. Results are shown inFig. 1.
Based on the analysis of results regarding the condition of the world energy infrastructure, we can note that this problem is of a global scale. Moreover, even despite a high quality of infrastruc-ture in a number of EU countries, the problem of a premainfrastruc-ture aging of the infrastructure still remains unsolved. Recent societal and technological changes require an infrastructure that supports and enables new technologies (Linzenich et al.,2020).
Besides, the absence or an inefficient use of digital and in-formation technologies leads to a lack of enterprise flexibility. It drastically reduces the ability to respond more effectively to market requirements changes (Dehgani and Jafari Navimipour,
2019; Balogun et al., 2020). The introduction of modern digital and technological solutions can improve decision-making pro-cesses and the efficient management of energy in real time and thus, it can improve relevant indicators of a performance.
The largest number of problems are observed in countries with a transitional economy. According to the International Monetary Fund (IMF, 2018), the Russian Federation belongs to this type. In this case, the reasons of worn-out infrastructures of the de-veloping and developed countries are combined together. The fall-down in oil prices, as well as the 2014 sanctions and subse-quent geopolitical tensions raised a substantial uncertainty and dampened domestic and foreign private investments. All these factors are the causes of the highest degree of depreciations of the infrastructure in the energy sector (Tcvetkov et al., 2020;
Nevskaya et al.,2019;Zhukovskiy and Malov,2018;Lavrik et al.,
2018;Pashkevich and Petrova,2017;Bazhin et al.,2017). There are in addition many specific additional problems re-lated to the geography of the country and temperature fluctu-ations, which in some regions can reach up to 60 ◦
C between
summer and winter (Belsky et al.,2016). Although these problems pose significant risks for the Russian society, the economy and the public administration system, they simultaneously represent an important factor for the emergence of new and challenging opportunities and prospects for the modern scientific and techno-logical developments of regions and countries (Litvinenko,2020;
Dvoynikov et al.,2020;Tcvetkov et al.,2020).
The degree of the depreciation of the equipments in the energy industry is the worst of all the industry branches in Russia. Since the Russian Federation possesses one of the most vulnerable energy infrastructure, the analysis of the state of equipment in the energy industry of this country was made with more details, in order to prove the need to search for new approaches to modernizing its energy industry. The current rate of introduction of new capacity is insufficient to ensure the growth of electricity needs, and the reliable stable power supply at this level of in-efficient equipment output, and for full-filling the demand, and the need of consumption of costumers. Every year, the state of fixed assets becomes worse than it was the years before. The electricity consumption has been actively growing since 1995 (Fig. 4). However, the use of an outdated technology does not allow for high intensity and real efficiency in the production of electricity and in terms of its transmission to consumers (see
Fig. 2) (Global Infrastructure Hub,2020; EIA, 2020).
The depreciation of equipment in the energy sector has almost approached 70% in 2019 (Global Infrastructure Hub, 2020). In the specific case of the oil and gas industry, one reaches 57% of the infrastructure deterioration: it requires more advanced methods of preventing accidents, a much more timely fixing of the depreciation operations (repair, replacement, modernization) (Zhukovskiy et al.,2019).
In the power supply systems, one reaches 60% of deterioration of the infrastructure.
- High-voltage lines and cable lines 0.38–20 kV are 65% dete-riorated (Smolovik and Khalilov,2017).
- High-voltage and cable lines 35–110 kV are 60% deteriorated (Ministry of energy of Russia,2020).
- More than half of 0.38–110 kV transmission lines were de-signed and built more than 40 years ago (Zhukovskiy et al.,
2019).
- Among the groups of main equipment and transmission lines, the 220 kV transformers are in better technical con-dition than the 110 kV transmission lines.
Thus, it follows that the level of physical wear and tear of the main equipment of power plants in general corresponds to the type of technical condition ‘‘unsatisfactory’’, which requires an enhanced monitoring of the technical condition and overhaul. This situation reduces the reliability and the safety of operation of many electrical networks, many buildings, many structures, many equipment, many devices, many control systems and many communications. It increases the risk of dramatic emergencies in the power grid complex. In addition, one of the main indicators of distribution networks is the loss of electricity. Analysis of the loss structure showed that the total loss of electricity in networks at 0.38–110 kV varies from 10 to 15%. The real evaluated losses in Russia are 130 billion kWh (13.6% of supply to the grid). Accord-ing to the Energy Strategy until 2035, electricity losses should be at a level of no more than 8% of supply to the grid, which indicates the need for technical and organizational measures aimed at reducing losses (Ministry of energy of Russia,2020).
The assessment of wear of heat and water supply systems:
- 75% of heat-only boiler stations have been operating for over 40 years with a service life of 30 years (Tcvetkov et al.,
Fig. 1. The quality of the energy infrastructure in the world (1–7 points).
Fig. 2. The growth of energy consumption and deterioration of energy infrastructure in the Russian Federation (Global Infrastructure Hub,2020; EIA, 2020).
- The water supply network is 60% of the deterioration ( Min-istry of energy of Russia,2020).
- 35% of the equipment of hydroelectric power plants and 20% of the equipment of thermal power plants have already entered their end-of-life time periods (Ministry of energy of Russia,2020).
- 28.8% of the heat pipes in the heat supply systems need to be replaced (Rosseti, 2020).
The low level of investment reduces the operating conditions of the equipment. This leads to an increase in the risk of accidents up to 80% by 2030. No less than 16 thousand accidents in electric networks of 110 kV and 5 thousand accidents at heat and water supply systems were registered in 2019 (Ministry of energy of Russia, 2020). It also substantially affects the socio-economic sphere, leads to an increase in tariffs, which should be limited to the planned indicator of inflation set by the Central Bank of Russia. However, today there is no systematic approach to solving the problem of these deteriorations of the infrastructure and for restoring the material and technical base, even despite the increase in tariffs, in funding from the state, as well as via the launching of developed investment programs. This is one of the most important problems for the energy complex of the Russian Federation.
Moreover, the investment in the infrastructure has been rec-ognized by governments as a key driver of the economic pros-perity. The lack of investment is one of the main reasons for the depreciation of the energy infrastructure (Paschke,2017).Table 1
presents data on the state of the global energy infrastructure for 2018, the forecast data up to 2030, and the necessary investments as well. The investments that are allocated by the regions to solve this problem are insufficient, compared to the necessary ones, which causes the appearance of an investment gap. That is why the deterioration of the infrastructure becomes stronger every
year. For 2018, investments in the infrastructure are 1.7 trillion dollars, while the necessary investments locate in contrast near up to 2.1 trillion dollars.
The United States is one of the world leaders in financing the research in the field of energy and innovative technologies (World Energy Investment, 2019). However, investments in the development and modernization of the infrastructure are still insufficient and depreciation continues to increase. Russia has the largest investment gap of 41% compared with other regions. It is expected that, by 2030, investments will increase by only 15%. However, to cover the costs of infrastructure reconstruction, investments should increase by more than 1.7 times and should reach an amount to at least 58.8 billion dollars annually.
In addition, the economic crisis amid the coronavirus pan-demic in 2020 affects the entire life cycle of facilities through the energy sector. Production chains are cut off, effective demand falls, investments are postponed, and the potential damage to the hydrocarbon energy industry from an economic standpoint is colossal.
In this regard, a unified investment strategy is needed. A num-ber of policies and Government interventions are currently being developed to reduce or safely manage the investments. These include the use of regulatory measures as well as public finance mechanisms and public–private partnerships (Jones,2015). How-ever, this is not enough to overcome the deterioration. Measures for the reduction of the deterioration of the infrastructure should be carried out by introducing advanced technical solutions that fulfill economic and environmental requirements. Besides them, a modern technical level of energy distribution has to be conceived and achieved in accordance with the requirements of consumers. New business models are needed that are more likely to meet the environmental and social goals of transformation of the infrastructure and open the door to new entrants. When risks and opportunities are quantified, they are well received
Table 1
Required investments in infrastructure and infrastructure deterioration until 2030.
Region Deterioration of energy infrastructure (%) Required investments (billion dollars) Investment gap, billion dollars (%)
2018 2025 2030 2030a 2018 2025 2030 2030 EU 25 28 30 27 256.7 268.8 326.7 19.7 (6%) USA 56.6 59 64 44 314.1 359.5 394.2 124.6 (31%) Asia 48 54 55 30 1231.8 1462.8 1616.7 154 (9%) Russia 66.6 75.7 84 49.5 45.4 51.7 57 23.1 (41%) Africa 65 70 73 53 137 170.1 194.8 53.9 (27%) All regions 52.2 57.3 61.2 42 2096.7 2368.1 2589.4 375.2 (15%)
aPercentage of depreciation of the infrastructure that should to be achieved by 2030.
by stakeholders, including investors. So, strategy and timing are
both important, in addition to quantification. In this regard, it is
mandatory to determine what global challenges will affect the deterioration of the infrastructure over the next ten years, and it is also necessary to develop a methodology for predicting the state of infrastructure assets until 2030, both being realized taking into account the impact of technological changes in the energy sector.
Nowadays, the fourth industrial revolution based on the in-formation and digital technologies, is often called the Digital Revolution (Dogaru,2020;Zhong,2017;Guerado,2017). Digital-ization is a key enabler for the sustainable development of cities having socio-economic dynamics, with the potential to simulta-neously foster climate-friendly urban environments and societies (Balogun et al.,2020). The technological development in the field of digital and information technologies creates fundamentally new opportunities for increasing the efficiency of analysis, and for forecasting in various activity, and for helping to decision-making, based on the processing of extremely large arrays and data streams (Dehgani and Jafari Navimipour,2019).
Accordingly, at the scale of the next 20 years, the energy sector of various regions and countries must cope with the issues of ensuring the energy security. It must become a guarantor of the sustainable development as the basis for meeting the needs for future generations through the introduction and the development of digital technologies in the energy sector (Annual statistics of world energy,2018).
Despite the critical role that the infrastructure plays in the ability of a global society to face climate challenges, scientists are just beginning to explore the role of digitalization in improving the quality of the energy infrastructure to ensure a safe and reliable energy supply. The book ‘‘The Third Industrial Revolution (Clark and Cooke, 2010) suggested that the countries, states, regions, and communities of all kinds must embrace the reality of smart grids, emerging storage technologies, and renewable energy generation.
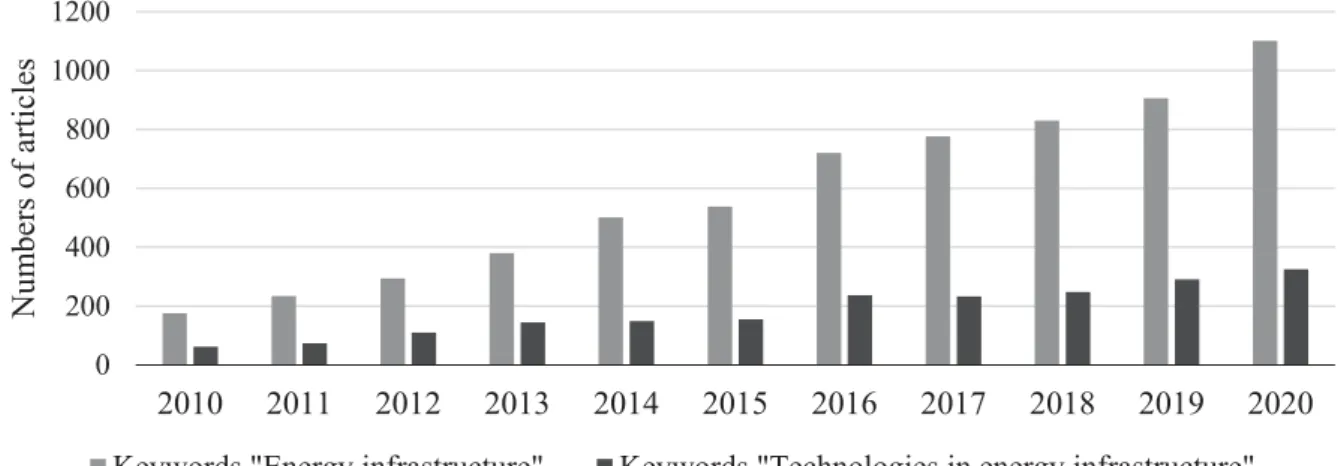
We analyzed big amounts of qualified literature, which con-firm the relevance of the studying of energy infrastructure for last 10 years (Fig. 3). Most of a complementary scientific literature focuses on the calibration of the role of politics and of the gov-ernment in the modernization of the infrastructure. In addition, it also analyzes the sustainable consumption and production.
Previous studies confirm the lack of information regarding new technologies that can be specifically applied to the energy infrastructure. However, the need for technological changes for the infrastructure is confirmed by many authors (Bayramov et al.,
2018;Clark and Lund,2008). In the work ofSoares et al.(2018), a wide literature review was carried out on improving the en-ergy efficiency and the environmental efficiency of systems, on developing new technologies, on increasing the use of renew-able energy sources. Their paper confirmed that it is important to jointly improve information and communication technologies that both contribute to a better monitoring and to enhance con-trol capabilities. The papers of Wu et al. (2021), of Teng et al.
(2021) and of Ali et al.(2020) present broad overarching ratio-nales that digitalization and decentralization are the key enablers to achieve a sustainable infrastructure.
In this regard, a new approach to research is required to gain a more systematic understanding of the role of energy, of all its related infrastructure and of their impacts on the sustainable economic development of the countries of the world.
The research presented in this article focuses on the tech-nologies that are mandatory for the sustainable development the energy infrastructure. We forecast the state of the energy infrastructure until 2030. Results determine which technologies have the greatest impact on the energy infrastructure. We also describe in detail how digitalization will affect the properties of the energy infrastructure in conditions of specific scenarios and how it will enable the achievement of SDGs. Based on our findings, we propose development programs for the sustainable development of the infrastructure.
Our paper has a specific emphasis towards the needs of the end user in the spirit of the work previously done byRoelich et al.
(2015). However, in this paper it is worthwhile having in mind that offering the ad-hoc answer to all the needs of the present time requires finding a reliable, sustainable balance between the needs of all stakeholders.
Our review and analysis has five objectives:
(a) the identification of global trends and the determination of their degree of influence on the deterioration of the energy infrastructure and equipment;
(b) proposing the development of a methodology adapted to accurately evaluate the impact of technological changes on the rate of infrastructure renewal in the power industry;
(c) the forecasting of the infrastructure condition, taking into account the impact of global challenges and the development of technology;
(d) the identification of the key technologies that are needed to reduce the negative effect of aging on the equipment;
(e) the identification of key technologies, the development of which will cause accelerated attraction of investments in the energy industry.
Results of our study will allow:
(1) to help and enable decision-makers in energy policy to evaluate a wide range of infrastructure solutions and innovative technologies;
(2) to estimate the impact of technologies on the properties of the energy system as a whole and on its sustainability;
(3) to provide steps in the development of methods for as-sessing and for choosing the directions of investments in the energy sector. This sector is a complex infrastructure system that includes public and private actors along with a high degree of infrastructural changes and market uncertainty.
The complexity and the interdependence (both technically and socio-economically) of infrastructure systems require that any intervention or influence must carefully take into account both the historical co-evolution of the systems and their dependence on scenarios of development that could limit the potential for infrastructure aging. According to the co-evolutionary theory, it is
Fig. 3. The relevance of the research about energy infrastructure (Science Direct,2020).
not possible to simply alter the technological basis of the society, from dirty to green, or unsustainable to sustainable, without severely altering the fundamental social, economic and institu-tional relations, that regulate our everyday lives (Knoeri et al.,
2016).
Thus, this article describes an approach to modernizing the energy infrastructure through the development of digital and information technologies. The goal of this approach is to ensure controlled and long-term sustainable energy consumptions, tak-ing into account the needs of the consumers. Section2describes the approaches and methods used in the present research and it assesses the contribution of digital and informational technolo-gies to the improvement of the quality of the infrastructure. The subsequent discussion of the results in Section 3 provides the basis for the conclusions addressed in Section4.
2. Methodology
The methodological approach in this research is based on several scenarios for forecasting. Scenario planning or analysis is a consolidated and structured process of generating future possibilities which have social-economic and environmental im-plications.
Forecasting by using scenarios is one of the most effective tools for predicting trends and options for the development of certain socio-economic phenomena. Scenarios are not intended to be predictions of likely future events or outcomes and in-vestors thus should not rely on them when making an invest-ment decision. Scenarios are based on plausible assumptions and quantifications. They are designed to force the management to consider, even events that may only be remotely possible (Hew et al.,2020).
In this paper, the scenario planning began with an analysis of the external environment of electric power enterprises and was followed by the identification of the main factors affecting the enterprises and the industry.
The analysis of the external environment of the industry re-sults in the compilation of a list of macroenvironmental fac-tors that, in the considered time period, have the greatest im-pact on the activities of the organization. The next step is the
development of scenarios. This stage includes:
- the selection of influencing factors;
- the forecasting of the various potential outcomes of scenar-ios;
- a combination of significant factors leading to the formation of scenarios.
To select the pertinent factors, it is recommended to rely on the results of the analysis of the external environment in order to identify the most significant factors that will form the consoli-dated basis of the scenarios. We chose the brainstorming method in order to optimize the identification of the most significant fac-tors, with the utilization of cause–effect diagrams (Mercer,1995;
Al-Samarraie and Hurmuzan,2018). The result of this should be the one selection of several of the most significant and inde-pendent factors. The stage of forecasting various outcomes of scenarios is based on the analysis of the identified factors and on the compilation of several of their outcome options. The purpose of the combination of the most significant factors is to establish the interdependence between the predicted outcomes of the fac-tors under consideration, as well as to write scenarios. Next, it is required to combine the resulting mini-scripts into several large scripts. At the same time, as the opinions of researchers differed regarding the question of the required number of scenarios, we proposed to develop two main scenarios, including all favorable outcomes of key factors in one scenario (positive), and negative outcomes in another one (pessimistic scenario).
This having being done, it becomes then mandatory to assess the plausibility of the scenarios and, if necessary, to eliminate options for outcomes that are not possible. We will also have to assess the resulting scenarios from the point of view of the main stakeholders and of employees of the companies.
This paper proposes to use the Delphi survey (Chen et al.,
2020;Jones,2015). This method is widely used in planning sce-narios in the energy sector. It involves the generalization of all individual expert assessments regarding one situation. The Delphi process was split into three phases and five steps. The different steps of our research method through the Delphi process are presented inFig. 4.
On the basis of the results of the first survey, we developed weights to calibrate quantitatively the relationship between the characteristics of the infrastructure and global challenges and technologies. The second round of the survey allowed discussion of the results. We received comments during the analysis results and continued the study using additional opinions.
Thus, the forecasting of the mutual influence of global chal-lenges and key technologies on the deterioration of the infrastruc-ture of the energy sector is based on the survey over a large set of professional workers and teachers of specialized universities familiar with this topics, and selected worldwide.
An expert group is composed of 82 experts in our research. Based on the results of this survey, we identified key technologies to improve the efficiency of the energy sector.
The volume of work devoted to this study is considerable and each step has been very carefully done, from the evaluation of
Fig. 4. Steps of our research method through the Delphi process.
today’s situation in the energy infrastructure, to the method of investigation we chose, to the conception of a questionnaire, to the selection of the evaluators of this questionnaire, to the data analysis, up to the formulation of the solution we discovered.
2.1. The description of scenarios
Each scenario presents a different set of strategic objectives and core capabilities that achieve the most thorough exploration of the process of decision making (Postma and Liebl,2005; Schoe-maker,1995).
The scenarios combine vast amounts of data on an eclectic variety of issues such as global economic growth, political factors and environmental issues, and they illustrate the relationship be-tween the main driving forces in interesting or provocative ways (Coates,2000). It is proposed to solve the problem of determining the degree of influence of global challenges on the infrastructure conditions in the energy sector by forecasting on the basis of an extensive utilization of the scenario approach. At the initial stage of the Delphi method, a small group of 10 experts was assembled. This group of experts was mandated for choosing, from a wide matrix of all scenarios for the development of the energy sector, only two extreme scenarios for the development of the state of the energy infrastructure by the method of brainstorming. These scenarios were formed as the best-case or worst-case scenarios. As a result of the study, two scenarios were formed that deter-mine the possible state of the economic situation. The assessment of the plausibility of the scenarios was made on the basis of a expert survey of the second group of experts in the framework of the Delphi method.
The negative scenario. The rates of economic growth in the world will continue to slow down; the dynamics of world indus-trial production will be deteriorating. World trade in monetary terms and in physical volumes will be declining. The growth of internal crisis phenomena in real economy will be based on the high volatility of prices of energy resources with a general trend being inclined towards a decrease in their value. The growing unemployment of citizens will lead to massive non-payments for energy and an outflow of investments from the energy in-frastructure, which will contribute to the accelerated aging of infrastructure assets, will worsen the environmental situation
and will contribute to an increase in the risks of man-made accidents. There will be a decline in investment demand and uneven investment in the fuel and energy complex, which will lead to an increase in the energy intensity of the Gross Domestic Product (GDP). Attraction of international investment projects will become unlikely, because potential investors will be mostly concerned about the lack of transparent regulation and certainty in the prospects for the development of the fuel and energy industry.
The positive scenario. The globalization of the world and the launch of large-scale supranational infrastructure and en-ergy projects will lead to a worldwide increase in trade, both in monetary and physical volumes. The storm associated with the crisis and quarantine measures will be gradually fading away. The temporarily destroyed global supply chains of energy, ma-terials and goods, in an effort to reduce costs, will be restored in a supranational circuit and they will become more efficient, due to the elimination of political influences. Investment activity will lead to a significant renewal of fixed assets in the energy industry and network infrastructure. Due to moderately high prices for hydrocarbons, the demand for new technologies and equipment, including the renewable energy, will increase. Large-scale introduction of Industry 4.0 and the Internet of Things (IoT) will significantly reduce the cost and personalize most types of products and services, and they will enhance the role of energy-saving technologies and environmentally friendly energy sources. The growth in the global standard of living will become more sustainable. On the basis of digital technologies, organizational and structural optimization will be carried out in the life cy-cles of all energy hydrocarbons and final forms of energy. In-ternational planning and financing, as well as the regulatory framework, will create the prerequisites for integration into the coordinated development of energy infrastructure for sustainable development.
These two kinds of scenario conditions are transformed into sets of coefficients and they are used in the forecasting model for global infrastructure indicators.
2.2. Modeling the impact of global challenges on the deterioration of the infrastructure of the energy industry
For the first time ever, a scenario modeling of the impact of the global challenges on the deterioration of the energy infras-tructure across the technological and socio-economic spheres is performed. The analyzed problems are presented inTable 2.
Thus, the underfunding of modernization programs, environ-mental and climatic changes, in line with the increase in the density of energy consumption associated with the urbanization of the population, with the digitalization and with the smar-tification, as well as scientific and technological progress, all of them being more energy demanding do contribute and do add more weight to the already existing problem of infrastruc-ture deterioration. By 2030, the impact of such challenges as ‘‘Growth of population’’, ‘‘Urbanization’’ and ‘‘Growth of Energy Consumption’’ will only increase, which will affect the aging of infrastructure assets that require large investments to maintain environmental safety and ‘‘activate’’ scientific and technological progress.
To formalize and to establish the numerical values of the influ-ence of global challenges (G1–G6), it is proposed to use a model scenario of influence. The global challenge was presented to a group of experts. At this stage, an expert survey was conducted on the impact of global challenges on the state of the energy infrastructure. We distinguish three main factors:
- K1 is the speed of deterioration of the infrastructure. K1 takes values ranging from
−
1 to 1;Table 2
Global challenges affecting energy infrastructure.
Challenge Main feature of the challenge Impact on the technological sphere Impact on the socio-economic sphere G1. Growth of
population
The growth of population is projected to 9.1 billion people by 2040 (UN, 2020), requiring additional energy supply for almost 2 billion people (EIA, 2020).
The growing need to improve the quality of life, which will lead to the creation of new technological solutions and adaptation of the elderly to the digital age.
A stimulating economic growth while creating problems with food, water and energy resources.
G2. Urbanization The concentration of the population within large administrative territorial entities requires an increase in the density of energy consumption and in values of electricity consumption per person.
The need to create separate power grid structures with their own energy sources and capable of taking on the task of meeting consumer demand at a maximum peak load when the central grid cannot provide it.
The increase in specific energy consumption (kW h/m2); the further growth in the construction of buildings and structures, which will spur such an energy-intensive industry as the production of building materials. The requirements for the complexity of the energy infrastructure, the quality and customization of food, goods and services are growing every year. G3. Scientific and
technical progress
The development of digital and information technologies (end-to-end technologies covering all industries) aimed at improving the energy efficiency of production within Industry 4.0.
The development of personalized flexible infrastructure, however, increased load on energy infrastructure and increased electricity consumption.
The birth of plenty of new markets, services, business strategies and a qualitative transformation of energy markets. Creation of new professions in the field of modernization of energy generation systems, recuperation systems, energy storage, smart grids.
G4. Growth of energy consumption
The demand for energy is provided by the process of incessant human development and scientific discoveries and technological progress.
An energy efficient use of resources is needed, which in turn creates preconditions for the development of smart energy systems. An increase in requirements for the quality of electricity.
Growth of electricity tariffs and degradation of the country’s environmental situation. In this regard, there is a need to modernize infrastructure and to develop energy efficient thinking.
G5. Climate change The environmental situation affects the growth and aging of the population, increased consumption, deterioration of the energy industry infrastructure. An increase in the share of renewable energy sources, the introduction of energy-efficient equipment, the formation of prosumers.
Digital and information technologies will allow attracting investments for the implementation of environmental projects, the introduction of clean technologies and the reduction of emissions of harmful substances into the atmosphere.
Encouraging the population to sort, recycle, and reuse household waste. A rational use of non-energy resources.
G6. Economic downturn
The economic and financial downturns are forcing significant budget cuts, which is the main reason for lack of repair and reconstruction in infrastructure facilities. Increased costs for maintenance, technical upkeep, repair of outdated result, to unprofitable technologies.
The introduction of technological changes at the production facilities of the energy sector is slowing down: the risks of shutting down many production processes are increasing, where the costs of the capital and the operating expenditures become incommensurate with oil prices; construction work is suspended due to restrictions on the entry of foreign specialists.
The economic crisis affects the entire life cycle of facilities in the area of hydrocarbon energy: production chains are cut off, effective demand falls, and investments in new technologies are postponed.
- K2 is the force of the influence or of an obedience between challenges. K2takes values ranging from
−
1 to 1;- K3 is the force of influence of the global challenge for the energy infrastructure. K3takes values ranging from 0 to 1. Each of these indicators is estimated in conventional units. The assessment largely varied, depending on the infrastructure development scenario and on the availability of evidence of an impact on the infrastructure as a whole. In the course of the survey, it was analyzed how the challenge will manifest itself in negative and positive scenarios. In an attempt to make the expert’s
assessment as independent as possible, none of the selected experts participated as scriptwriters.
The application of the Method of Interaction Matrices allows, on the basis of the interaction matrix, to reveal the degree of mutual influence of the factors of the considered set and to predict their behavior in the future (Ceryan and Usturbelli, 2015). The simulation resulting of the negative scenario are pre-sented in Fig. 5. The feature of global challenges is the degree of influence (K2). It represents the force of influence (that takes values ranging from 0 to 1) or obedience (that takes values ranging from 0 to
−
1) between challenges on the horizontal axis. The other feature of global challenges is the speed of deterioration of infrastructure (K1). It represents the acceleration/deceleration of the deterioration of the infrastructure under the influence of a particular challenge in a particular scenario on the verticalaxis. The force of this influence is reflected by the diameter of the
spheres. The name of the challenge is indicated on the graph.
These scenario conditions, in the form of weight coefficients, are used in the forecasting model.
The results of modeling a positive scenario are presented in
Fig. 6.
Based on the data of positional maps, each of the scenarios can be represented in the form of a generalized coefficient of influence K, which is derived from the following formula:
K
=
((
K1+
K2) ·
K3) /
2,
(1) Based on the results of the analysis and calculations using formula(1), the final generalized influence coefficient is obtained for both scenarios, which determines the final degree of significance for three indicators of each challenge for the energy infrastructure. The result of our analysis is given inTable 3.
According to the data we obtained, it was estimated that in the case of a negative scenario, the generalized influence coefficients of the global challenges impact on the infrastructure condition will be KN
≈
0.5, while in the context of a positive scenario, this coefficient will be minimal and will be KP≈
0.1. This un-ambiguously indicates the possibility of implementing a program to develop a sustainable energy infrastructure with a minimum number of risks if all the conditions described in the positive scenario are met.Fig. 5. Results of modeling the impact of challenges on the energy infrastructure (negative forecast). The diameter of the spheres is proportional to the force of
influence of the global challenge for the energy infrastructure.
Fig. 6. Results of modeling the impact of challenges on the energy infrastructure (positive forecast). The diameter of the spheres is proportional to the force of
influence of the global challenge for the energy infrastructure.
Table 3
Generalized influence coefficients of impact of the global challenges on the infrastructure for two conditions of scenario, where KNis coefficient of influence in negative scenario; KPis coefficient of influence in positive scenario.
KN (Negative scenario) KP (Positive scenario) Growth of population 0.0808 0.0175 Urbanization 0.0120 0.0060
Scientific and technical progress 0.0140 −0.0300 Growth of energy consumption 0.0808 0.0450
Climate change 0.0480 0.0405
Economic downtime 0.2170 0.0187
The scenario conditions were compared with the results of the expert group. For the purposes of a robust testing of the validation, the expert judgment is considered as the best reflect of the reality. The expert survey is based on a more detailed evidence of the provision of the impact of global challenges on infrastructures rather than on a quick estimate based on statistics. However, the assessment of experts must be supported by rea-sonable justifications. Scores with high dissensus were considered to be unsuitable for validation. For assessments where there was moderate and high dissensus, the reasons for the dissensus were sought in the rationale provided in order to examine whether or not the variation has implications for or against the method.
For the next stage of the study, it is necessary to assess the impact of global challenges on the infrastructure conditions, in
Table 4
The weights coefficients Wij(i is the number of challenges and j is the number of characteristics) for the relationship between the infrastructure characteristics and the global challenges.
P1 P2 P3 P4 P5 P6 P7 P8 G1 0.786 0.674 0.732 0.532 0.620 0.534 0.611 0.134 G2 0.765 0.575 0.467 0.437 0.482 0.362 0.932 0.132 G3 0.880 0.945 0.834 0.760 0.832 0.782 0.901 0.822 G4 0.879 0.838 0.956 0.656 0.741 0.821 0.930 0.181 G5 0.456 0.759 0.478 0.357 0.389 0.745 0.145 0.942 G6 0.698 0.889 0.930 0.781 0.791 0.621 0.543 0.281
order to further predict the state of its energy part, taking into account the mutual influence of global challenges and technology development.
In this part of the study, indicators characteristics of the en-ergy infrastructure use eight coefficients Pj=1...8 that are estab-lished, from the results of the study and are based on the results of an expert survey. Their weights coefficients Wijwere evaluated for the connection with six global challenges Gi=1...6. For this study, we focused on 6 key challenges, 31 technologies divided into 6 blocks, and 8 characteristics that describe infrastructure conditions as a whole.
Features of infrastructure conditions are reference indicators by which a general conclusion can be drawn about structural problems and vulnerabilities of the entire energy infrastructure:
• P1 – the reliability (includes reliability, recoverability, sur-vivability, safety, controllability, preservation, stability);
• P2– the cost of ownership (for the entire period of opera-tion);
•P3– the availability (the state of the infrastructure, in which subjects with access rights can implement their work without hindrance);
• P4– the observability (the ability of the system to provide necessary information about its current conditions);
•P5– the accident rate (total number of emergency situations for the entire period of operation);
•P6– the maintenance time (equipment commissioning, op-eration, maintenance and repair, equipment removal, disposal);
•P7– the throughput (the maximum possible power that can be transmitted, taking into account the operating conditions and parameters of the infrastructure reliability);
• P8 – the environmental safety (properties of the energy infrastructure that allow to not pose a threat to human life and health, as well as to the environment, during operation and in the event of a malfunction).
The research results are presented inTable 4.
The coefficients take values ranking from 0 to 1 with a step of 0.001. We distinguish three different situations taking into account the ranges: Wij
≤
0.3 for the weak influence; 0.3<
Wij≤
0.6 corresponding to conditions of a medium effect; 0.6<
Wij≤
1 in the context of a strong influence. It should be noted that we averaged these values for all experts, excluding observations with incomplete information on the key characteristics of infrastruc-ture conditions. Thus, the first goal of the study was fulfilled: the analysis of global challenges affecting the infrastructure was conducted and the degree of their impact on key characteristics was determined based on the scenario modeling. The next stage of the study is the development of a methodology for assessing the impact of the ecological changes on the rate of infrastructure renewal in the electric power industry.2.3. Assessment of the impact of technological changes on the rate of renewal of infrastructure in the electric power industry
According to Di Silvestre et al.(2018) the paradigm of the fourth industrial revolution in the fuel and energy complex in-volves the introduction of modern high-tech solutions at all stages of the cycle of the product life.
Today, almost all companies in the fuel and energy complex use information and communication technologies (ICT) in their activities. But, unfortunately, the ICT of many countries, includ-ing the Russian Federation, consists only of personal computers, local networks, warehouse automation and accounting systems, websites, outdated technological applications or proprietary func-tional products. Share of innovative goods, works and services in the overall volume of exports of goods, works and services in 2018 amounted to only 7.1%.
Ineffective use of information technologies at enterprises of the fuel and energy complex leads to such problems as:
(1) the impossibility of remote control; (2) the lack or the low level of automation; (3) a low observability;
(4) a non-standardized management;
(5) stricter requirements for energy infrastructure;
(6) the absence of a single information platform in the struc-ture of vertically integrated oil and gas enterprises and energy companies.
The lack of information and technical support leads to an increase in requirements of the consumer for the quality of the supplied products and for the reliability of their transportation. However, the main factor hindering a qualitative increase in electricity consumption and full electrification is the deterio-ration of the energy infrastructure. The use of fundamentally new approaches, materials and technologies allows achieving a higher level of sustainability and reliability of the infrastructure. Large-scale implementation of Industry 4.0 and IoT can provide environmental safety, can provide resilience to severe weather and seismic impacts, can improve customer service, can update the mechanism of spare capacity reallocation, can change social and economic trends and it can also improve the planning of natural resource exploitation planning.
Thus, it is expected that digital technologies will make a great contribution to the quality of the infrastructure, but the question of which particular set of specific technologies will be needed, still remains unresolved. Some of the digital technologies were
pre-viously used but they were restricted to the production process only. It is now obvious that their extension to the entire value chain is needed, what can be called end-to-end technologies. Of course, these digital technologies themselves consume energy, but the effect of their implementation can drastically reduce emissions and significantly improve the quality of services. Based on the results of our study using of international and domestic sources of information, we identify 31 main technologies which will allow the transition to the digital smart energy (they are hereafter labeled A1–A31). All the analyzed technologies acting within the same field direction were gathered into 6 specific groups (labeled Tm=1...6), according to their functional properties. In this regard, it is necessary to take into account the con-tribution of the key technologies A1–A31 to certain properties of the energy infrastructure. Their own influences appear in the infrastructure conditions specific to the energy sector. The full set of data is given inTable 5.
During the study, for eight characteristics Pj=1...8, based on the results of the study and on the expertise survey described in paragraph 3.2, the weights coefficients Zmjare established for the connection with technological blocks Tm=1...6. They make it possible to identify the degree of the influence of each technolog-ical change on the infrastructure conditions as a whole group and
Table 5
The key technological blocks Tm=1...8T and technologies A1–31. Group name Technology name
T1 Renewable energy
A1. Network generation;
A2. Small distributed generation of renewable energy sources;
A3. Network storage technologies; A4. Local storage technologies;
A5. Technologies for converting secondary resources into electricity;
A6. Hydrogen energy; T2 Information
technology
A7. Foreseeable maintenance and repair; A8. Intellectual diagnostics of electrical equipment; A9. Big Data and Machine Learning;
A10. Internet of things (IoT); A11. Distributed register; A12. Information security. T3 Digital technologies A13. Intelligent sensors; A14. Intelligent accounting; A15. Active-adaptive electrical grid
A16. Intelligent automation and control systems; A17. Unmanned aerial systems;
A18. Microgrid and aggregation of demand; A19. Digital substation.
T4 Materials science and equipment
A20. New construction materials; A21. High-temperature superconductivity; A22. Cables and wires;
A23. Power electronics; A24. Switching equipment. T5 Energy saving A25. Energy-efficient production;
A26. Energy-efficient equipment; A27. Energy management. T6 Non-renewable
energy
A28. Clean system for producing charcoal; A29. Increase in oil recovery;
A30. Technologies for developing of difficult recoverable reserves;
A31. Gas utilization, including liquefaction.
Table 6
The weight coefficients Zmj of the relationship between the infrastructure characteristics and technological blocks.
P1 P2 P3 P4 P5 P6 P7 P8 T1 0.571 0.691 0.829 0.311 −0.286 0.112 0.362 0.759 T2 0.763 0.443 0.685 0.796 −0.467 −0.422 0.221 0.247 T3 0.790 0.522 0.356 0.782 −0.786 −0.121 0.142 0.178 T4 0.597 0.141 0.241 0.111 −0.690 −0.124 0.365 0.030 T5 0.124 0.423 0.624 0.211 −0.578 0.090 0.657 0.698 T6 0.791 0.652 0.561 0.141 0.121 0.154 0.221 −0.274
separately one by one. The results of this research are presented inTable 6.
During the modeling of the weight coefficients, the degree of the influence of technological blocks on the state of the in-frastructure was determined. As a consequence, with the help of the division into technological groups, the model allows to track changes in features that will be influenced by the challenges under consideration. The reverse sequence allows to identify the necessary technological changes that can impact the features of the infrastructure conditions and that can determine the most problematic sectors that need to be considered with the most attention and the most care by the state.
Thus, in this section, the second task of our study — measuring the impact of technologies from blocks Tm=1...6 on the rate of infrastructure renewal in the electric power industry, according to the main characteristics Pj=1...8is achieved. It is found that the greatest impact on the energy infrastructure condition is exerted by technological blocks as Information Technology, Digital Tech-nologies (the highest ratio of reliability, observability, reduction of accidents and maintenance time).
The scenario modeling of the impacts of the global challenges on the deterioration of the energy infrastructure and the as-sessment of the impact of technological changes on the rate of renewal of real assets in the electric power industry will make it possible to act on the followings:
- tracing the mutual influence of challenges on the infrastruc-ture condition and taking into account limits of scenarios and technologies;
- achieving the consolidated identification of the key technolo-gies required to reduce the negative impact of the aging of the equipment and of technologies, the development of which will lead to an accelerated attraction of investments in the energy sector.
2.4. Mutual influence of challenges, taking into account scenario limits and technologies, on the condition of the infrastructure
The next stage of our study is to determine the mutual impact of challenges, taking into the limits account of scenario and technologies, on the characteristics of the energy infrastructure up to 2030. First of all, for this, it is necessary, as a prerequisite, to determine the coefficient of change in the global challenges
Xi=1...6
= [
Gi(2035)−
Gi(2020)]
/
(Gi(2020)∗
100%, in accordance with the forecasts of the leading agencies and companies of the energy sector.It is related to the indicators of characteristic of the energy infrastructure through the weighting coefficients obtained during our study. The quantitative change in global challenges until 2030 has been determined in accordance with the leading energy agencies. The data fromTable 7was estimated globally and can be applied to any country in the study.
The weight coefficients WijfromTable 4for the relationship between the 8 characteristics of the infrastructure Pj=1...8and the 6 global challenges Gi=1...6 are multiplied by the coefficient of change in the global challenges Xiby formula:
Vij
=
Wij·
Xi,
(2)where the Vijare the new weight coefficients for the relationship between the 8 characteristics of the infrastructure and the global challenges with considering the coefficient of change in the global challenges Xi; Wij is the weights coefficients for the relationship between the 8 infrastructure characteristics and the 6 global chal-lenges fromTable 4; Xi is the coefficient of change in the global challenges fromTable 7; i is the number of global challenges and
j is the number of characteristics.
The new value of eight characteristics of the infrastructure Pj with considering all six challenges is calculated by the formula:
Pj
=
Cj 1 6 i=6∑
i=1·
Vij,
(3)where Cj=1...8is the current level of the value of characteristics of the infrastructure Pj=1...8fromTable 8; Vijis weights coefficients for the relationship between the characteristics of infrastructure and the global challenges with considering the coefficient of change in the global challenges Xi from formula (2); i is the number of global challenges.
Taking into account the coefficient KNin the negative scenario and the coefficient KP in the positive scenario from formula(1) andTable 3, we determine the variation in the characteristics of the infrastructure for the negative and positive scenarios using the formulas:
∆Pjnegative
=
(Cj–Pj)·
KN (4) ∆Pjpositive=
(Cj–Pj)·
KP (5)Table 7
Changes in the studied global challenges 2020–2035.
No Index 2020 2035 X, %
G1 Population, (billions) 7.79 (UN, 2020) 8.89 (UN, 2020) 14
G2 Population in Urban Areas, (%) 56.2 (UN, 2020) 62.5 (UN, 2020) 11.2
G3 Research and development costs, (%) 22.5(WB, 2018) 26.5 (WB, 2018) 18 G4 Energy consumption, (quadrillion Btu) 4.82 (EIA, 2020) 5.14 (EIA, 2020) 6.6 G5 CO2 emissions, (Gigatons CO2) 35.34 (BP 2020; EIA 2020) 37.46 (BP 2020; EIA 2020) 5 G6 Gross domestic product (GDP), (thousand billion US dollars) 103.04 (OECD, 2020) 156.2 (OECD, 2020) 51
Table 8
The current level Cj=1...8of the value of characteristics of the infrastructure. C1 C2 C3 C4 C5 C6 C7 C8 2020 (the current level) 0.31 0.91 0.4 0.21 0.71 0.90 0.55 0.10
Table 9
The required level Lj=1...8of the value of characteristics of the infrastructure. L1 L2 L3 L4 L5 L6 L7 L8 2020 (the required level) 0.80 0.30 0.65 0.95 0.51 0.41 0.85 0.85
Table 10
Characteristics of energy infrastructure, taking into account the impact of global challenges.
P1 P2 P3 P4 P5 P6 P7 P8 2030 (the negative scenario) 0.28 0.72 0.38 0.17 0.77 1.02 0.50 0.08 2030 (the positive scenario) 0.30 0.69 0.40 0.21 0.68 0.88 0.56 0.11
where ∆Pj negative is the variation in the characteristics of the infrastructure for the negative scenario; KN is coefficient of influence in negative scenario;∆Pjpositive is the variation in the characteristics of the infrastructure for the negative scenario; KP is coefficient of influence in negative scenario.
We obtain the final value of Pj negative is the characteristics of the energy infrastructure in negative scenario and Pj positive is the characteristics of the energy infrastructure in positive sce-nario using the formulas:
Pjnegative
=
Cj−
∆Pjnegative (6)Pjpositive
=
Cj+
∆Pjpositive (7) These formulas will be applied for infrastructure indicators P1,P3, P4, P6, P7, P8. Since the indicators have a negative effect (P2,
P5), then when calculating their parameters, it is necessary to transform the formulas into the following form:
Pjnegative
=
Cj+
∆Pjnegative (8)Pjpositive
=
Cj−
∆Pjpositive (9) The results are presented inTable 10.The results indicate the characteristics of the conditions under which the energy infrastructure will remain unsatisfactory with-out modernization by the introduction of advanced technologies. Unfortunately, the required level Lj=1...8of the P1–P8 characteris-tics cannot be achieved even in the long term up to 2030 under the condition of a positive scenario.
By using formulas (1)–(9), we can carry out a similar calcu-lation in order to account for technological changes. The global challenges Gi=1...6 will be replaced by the technological blocks
Tm=1...6. However, in this case, the characteristics of the infras-tructure will be used from toTable 8.
In this regard, the mandatory quantitative changes in the technological blocks we considered and studied were evaluated in order to approach the required indicators by 2035 with the scenario modeling presented inFig. 7.
In the frame of the negative scenario, the result of a strong investment gap, of an increased load as the straightforward con-sequence of an increased consumption, the deterioration of the environmental situation and the low level of technology intro-duction in the infrastructure shift in concert the reliability and the amount of accidents in the energy sector to the critical zone. Achieving the necessary level of infrastructure condition to meet the requirements of environmental safety becomes impossible.
The changes will be the most significant in availability and maintenance time because otherwise the infrastructure can be-come a deterrent to any innovative development and to the transition to the digital economy.
In the context of the positive scenario, one of the main factors in achieving indicators of infrastructure quality (in conventional units) is the introduction of technologies until 2030. Achiev-ing the SDGs is possible as evidenced by the high indices of 8 indicators the of infrastructure:
- The reliability will be increased from 0.3 to 0.6, thus making the infrastructure more safe and more resilient. It is a prerequisite for achieving Sustainable Development Goal 11 - Sustainable cities
and communities.
- The cost of ownership has been reduced from 0.9 to 0.4 and it will be closer to the required level. It is a prerequisite for achiev-ing Sustainable Development Goals 11 and 12 - Sustainable cities
and communities and Responsible consumption and production.
- The availability will increase from 0.4 to 0.6 and it will fully reach the required level. This will provide access to the energy for a large number of people. It is a prerequisite for achieving Sustainable Development Goals 7 and 10 - Affordable and clean
energy and Reduced inequalities.
- Observability will increase from 0.2 to 0.7, which will im-prove the quality of monitoring and managing the infrastructure. It is a prerequisite for achieving Sustainable Development Goal 12 - Responsible consumption and production.
- The number of accidents will significantly decrease from 0.7 to 0.6. This has a direct impact on the environment. It is a prerequisite for achieving Sustainable Development Goal 13
-Climate action, but we believe that this decreasing to a value of
0.6 is good but not enough and more than other characteristics require additional programs to achieve this SDG.
- The maintenance time will decrease from 0.9 to 0.7. It is a prerequisite for achieving Sustainable Development Goal 7 and 12 - Affordable and clean energy and Responsible consumption and
production. However, it also requires additional measures, since the required level of the indicator is 0.4.
- The throughput will increase from 0.55 to 0.65 and thus it will meet the demand for energy. It is a prerequisite for achieving Sustainable Development Goal 7 - Affordable and clean energy.
- Environmental safety of energy infrastructure use will increase from 0.1 to 0.45. It is a prerequisite for achieving Sustainable
Development Goal 13 - Climate action.
Thus, technological improvement and energy efficiency can directly contribute to the 9th sustainable development goal — Industry, innovation and infrastructure. In addition, it will al-low indirectly achieving the 5 Sustainable Development Goals: 7th SDG (Affordable and clean energy), 10th SDG (Reduced in-equalities), 11th SDG (Sustainable cities and communities), 12th
Fig. 7. Results of the modeling of the infrastructure condition modeling, taking into account scenarios, the impact of global challenges and technological changes.
(Responsible consumption and production), 13th SDG (Climate action).
In this regard, it is mandatory to strengthen and stimulate the companies of the electric grid complex to participate, strive and become more responsible in achieving the SDGs.
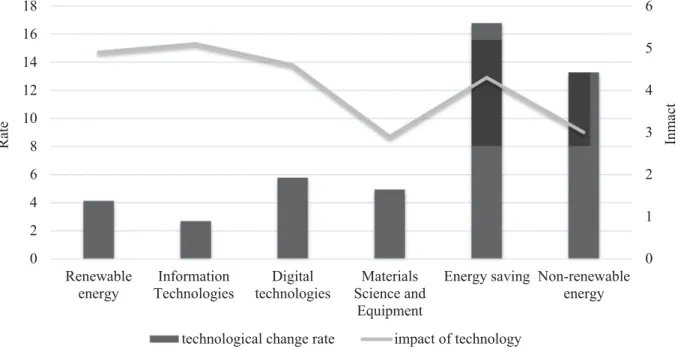
The main influence arises from specific technological blocks such as Renewable Energy, Information Technology and Digital
Tech-nologies (Fig. 8).
The rate of required technological changes Rmof technological blocks Tm=1...6was calculated using the formulas:
Rm
=
1 8 j=8∑
j=1 Lj Pjpositive×
18∑
j=8 j=1Zmj (10) where Ljis the current level of the value of characteristics of the infrastructure fromTable 9; Zmjrepresents the average weighting factor of the influence of the technological unit on the character-istics of the infrastructure in accordance withTable 6; Pjpositive represents the value of the infrastructure characteristics Pj=1...8, which is obtained by taking into account the impact of challenges and of technological changes, calculated according to formulas(1)–(9).
It should be emphasized that the calculations use the infras-tructure characteristics in the context of a positive scenario. Also, it should be noted that data can be also obtained for a negative scenario. The impact rate was calculated separately for each char-acteristics and an average value was obtained for improving the infrastructure as a whole.
Thus, technological changes are needed that can affect the observability, the cost of ownership and the environmental safety, in such ways that the infrastructure does not become a constraint to the development and to the different transition towards the digital economy.
The methodology in this article can be applied to conduct similar studies in other countries. We propose a methodology based on the example of the state of the infrastructure in the Russian Federation. The assessment of technological changes in the energy infrastructure should be done by scenario modeling using the method of brainstorming. To assess the scenarios and the state of the infrastructure, it is necessary to refer to the expert judgment based on the Delphi method. Based on the results of an expert survey using the Delphi method, it is necessary to de-termine the coefficients of the influence Wijof global challenges
Gi=1...6and the weight coefficients Zmjof the influence of techno-logical blocks Tm=1...6 on the characteristics of the infrastructure
Pj=1...8. It should be noted that the list of 6 global challenges, block 6 of technologies and a list of 8 characteristics of the state of the infrastructure can be applied to any country. However, the coefficients Wij and Zmj in Tables 4 and 6 respectively will be changed according to the country or company. The new value of the characteristics of the energy infrastructure, taking into ac-count the positive and negative scenarios, will be calculated using formulas(1)–(10). The value of the parameter XifromTable 7also remains unchanged and can be applied to any country.
3. Results and discussion
Based on the results of expert assessments, the coefficients of the mutual influence of the technological blocks and of global challenges on the signs of the state of the infrastructure were con-structed. The indicators highlighted that our scientific approach makes possible to get access to the complex state of the energy system from the standpoint of reliability, quality, accidents and environmental risks.
3.1. Key technologies
Based on the simulation results, we identified the key tech-nologies required to mitigate the negative impact of the aging of the energy infrastructure. We discovered that the largest amount of demand will appear in the field of digital and information technologies, as well as in the field of distributed generation based on renewable energy sources.
3.1.1. Renewable energy sources
The global production of electricity based on renewable en-ergy sources will increase to 40–50 billion kWh in 2030. The next stage in the development of renewable energy sources is the connection with other technological blocks. A large scale implementation of renewable energy sources is therefore possi-ble, with a breakthrough in other adjacent areas, for example, the development of space renewable resources. It is a type of alternative energy, involving the use of solar energy to generate electricity, with the location of a power station in the earth’s orbit or on the Moon, which will be primarily available in countries such as the Russian Federation and the United States. The main way to support grid of technologies for renewable energy is the investment in generating projects of construction based on high capacities of production of renewable energy with guaranteed feedback on investment and a high degree of profitability from electricity consumers.