HAL Id: hal-01635491
https://hal.archives-ouvertes.fr/hal-01635491
Preprint submitted on 15 Nov 2017
HAL is a multi-disciplinary open access
archive for the deposit and dissemination of
sci-entific research documents, whether they are
pub-lished or not. The documents may come from
teaching and research institutions in France or
abroad, or from public or private research centers.
L’archive ouverte pluridisciplinaire HAL, est
destinée au dépôt et à la diffusion de documents
scientifiques de niveau recherche, publiés ou non,
émanant des établissements d’enseignement et de
recherche français ou étrangers, des laboratoires
publics ou privés.
What is the nature of the C-C complex in silicon?
Insights from electronic structure calculations
Dilyara Timerkaeva, Claudio Attaccalite, Gilles Brenet, Damien Caliste,
Pascal Pochet
To cite this version:
Dilyara Timerkaeva, Claudio Attaccalite, Gilles Brenet, Damien Caliste, Pascal Pochet. What is the
nature of the C-C complex in silicon? Insights from electronic structure calculations. 2017.
�hal-01635491�
arXiv:1702.02334v1 [cond-mat.mtrl-sci] 8 Feb 2017
Centre Interdisciplinaire des Nanosciences de Marseille, Aix-Marseille Universit´e, Campus de Luminy, Marseille, 13288 Cedex 09, France
The structure of the C-C complex in silicon has been debated since long time. Different theoretical and experimental studies tried to shed light on the properties of these defects that are at the origin of the light emitting G-center. It is essential to understand structural and electronic properties of these defects because they are relevant for applications in lasing and there is an increasing interest to control their formation and concentration in bulk silicon. In this paper, we study structural, electronic, and optical properties of different possible configurations of the C-C complex in bulk silicon by means of density functional theory (DFT) plus many-body perturbation theory (MBPT). Our finding show that different competing structures could be at the origin of the experimental results.
I. INTRODUCTION
Carbon being an isovalent impurity to silicon initially occupies a substitutional position (Cs). High energy ir-radiation (electron, ion, proton, or gamma) creates fast diffusing self-interstitials. Some of those interact with carbon atoms and kick them out of the substitutional sites to create carbon interstitials (Ci). Ci is mobile above room temperature and though it interacts with other impurities and forms defect complexes. CiCs is one of the secondary irradiation induced defects, which is perhaps the most studied due to its rich physics and interesting structural, electronic, and optical features.
The pair is associated to a G-center which emits light on 0.97 eV (1280 nm).1,2 It was discovered in the 60’s as a by-product in the silicon crystal caused by the radi-ation damage from the bombardment with high energy electrons, ions and gamma rays. In recent years, an im-portant effort has been made in order to increase the G-centers concentration1–3. The methods are generally based on the silicon surface alteration, followed by a laser annealing. These technologies have promising applica-tions in development of a silicon laser.
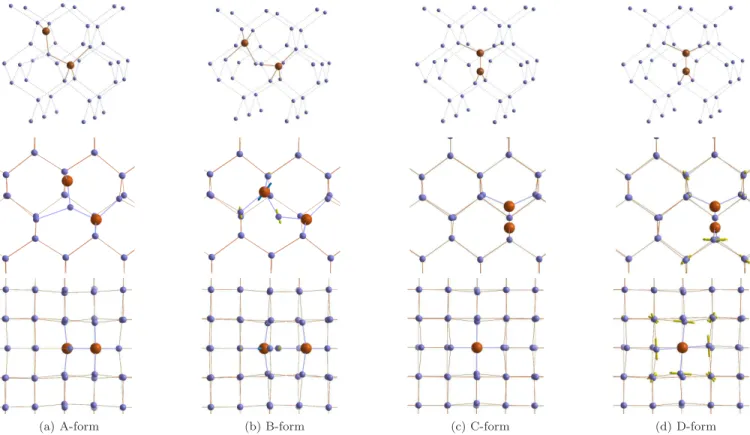
The structure of the complex has been debated for a long time in different experimental and theoretical studies.4–12The early Electron Paramagnetic Resonance (EPR) study4 identified a signal, called as Si-G11, that corresponds to a vacancy occupied by two carbon atoms in a positive charge state. The angular dependence in the Si-G11 Zeeman spectrum suggests that two carbon atoms lie in 〈110〉 plane, while the C-C bond is oriented along the (111) direction. Later experiments, based on optical detection of magnetic resonance (ODMR) study5 of the 0.97 eV optical peak, relate the G-center to the CiCscomplex in its neutral state. O’Donnell et al.5 pro-posed another model for CiCs complex where the sub-stitutional carbon atoms are separated with interstitial silicon atom. Two modification of such a complex are
possible: the A-form, when the interstitial silicon is a three bonded, and the B-form, when the Si is bonded to two neighboring Cs atoms. Bistable CiCs complex (A-and B-forms on Figures 1a (A-and 1b) (A-and its charged states have been studied experimentally.6Song et al.6have per-formed a wide analysis of a bistable CiCscomplexes in p-and n-doped silicon by means of EPR, Deep Level Tran-sient Spectroscopy (DLTS) and Pholuminescence spec-troscopy (PL) techniques and have provided a complete configurational-coordinate energy diagram. The A-form is found to be lower in energy for all the charged states except neutral where the B-form slightly lower in energy. Later the Localized Vibrational Modes (LVMs) of the bistable complex have been obtained by means of In-frared (IR) spectroscopy.7 The obtained spectra for B-form (540.4, 543.3, 579.8, 640.6, 730.4 and 842.4 cm−1) and A-form ( only five of six local modes were identified 594.6, 596.9, 722.4, 872.6, 953.0 cm−1) are in fair agree-ment with values obtained via ab initio calculations8,9.
In 2002, Laiho et al10by means of EPR, have detected a new low-symmetry configurations of a complex con-taining an interstitial silicon and two identical carbon atoms. These signals, named as Si-PT4 and Si-WL5, have not been identified so far, however their presence suggest several forms of CiCscomplex. These forms ap-pear during the cooling procedure and possess varying magnetic properties.
The exact geometry configurations of carbon-pair can be investigated by first principles studies. A few theoret-ical attempts have been performed during recent years. By means of DFT calculations, Liu et al13 proposed a third configuration of CiCscomplex (see Figure 1c), the C-form: two carbon atoms are situated in a vacancy and oriented in (100) direction. Although, the configuration was found to be at least 0.2 eV more stable than A and B for all charge states, there are no experimental obser-vations proving this form presence so far.
Since then, most of the theoretical works investigate the three forms of CiCs complexes14–16 (see Figures 1a,
2
(a) A-form (b) B-form (c) C-form (d) D-form
FIG. 1: ”Side” view (top line) and ”top” view on the four forms of CiCscomplex. Arrows show the distortion of B-form with respect to A-form and of D-form with respect to C-form.
1b, and 1c). However, their results are not in agreement with each other. Reported by Mattoni et al.14 and Do-caj et al.16, the binding of A-form is as strong as that of C-form, however both of the forms are less stable than B in neutral state. In these two studies, non spin po-larized calculations have been performed. In contrary, Zirkelbach et al.15 have calculated the stability of dicar-bon pairs by taking the spin into account and have found the C-form the most stable. Finally, we found another stable configuration of CiCs complex, which we call as D-form, that is a torsion of C-form along the C-C bond axis (see Figure 1d).
Here, we present our investigation of the structure, vi-brational properties, and optical absorption spectra by means of first-principle calculations in order to determine and characterize the different forms of this CiCscomplex. Moreover, we make an attempt to obtain the ground state (geometries, binding energies) and excited state proper-ties (band gaps and optical absorption/emission spectra) of all the four forms. The latter property could allow us to assign which of four forms corresponds to the light-emitting G-centre.
The paper is organized as follows: in section II we sum-marize the computation methods employed in the cal-culation of the atomic structure and the electronic and optical properties; in section III there are the numerical parameters entering in the calculations; in section IV we
present results for electronic structure and optics, and finally in section V we draw the conclusions.
II. METHODS
The defected structures was implanted in silicon super-cells containing 64 (small) and 216 (big) atoms, within periodical boundary conditions. The geome-try optimization was performed using BigDFT wavelet based code17 with Hartwigsen-Goedeker-Hutter pseudo-potentials18 and the GGA-PBE functional.19 To reach the local minima of every structure we used the Fast Inertial Relaxation Engine (FIRE).20 Variations in ge-ometry structures of the defects of interest in the small and big super-cells are negligible. However the energies of the various structures slightly differ. In addition, an accurate prediction of excited state properties requires accounting the long-range interactions. Thus consider-ing big super-cells is crucial and all further results were obtained in the large super-cells. To calculate the phonon modes, we employed the finite difference method within the frozen phonon approximation. To accelerate compu-tations, a defect and its first-shell neighbors were consid-ered exactly, while the remote atoms were contributing as unperturbed bulk atoms.
oc-quasi-particle(QP) band structure and the optical re-sponse of the system. The quasi-particle band struc-tures are obtained within the GW approach.24 Specifi-cally, we use non-self consistent GW (denoted as G0W0) in which the screened Coulomb potential, W , and the Green’s function, G, are built from the KS eigenstates {εnk; |nki} (with k the crystal wave vector and n the band index). The quasi-particle energies are then ob-tained from:
εQPnk = εnk+ Znk∆Σnk(εnk). (1) In Eq. 1
Znk= [1 − ∂∆Σnk(ω)/∂ω|ω=εnk]
−1, is the re-normalization factor and
∆Σnk≡ hnk|∆Σ|nki, where
∆Σ = Σ − Vxc,
is the difference between Σ = GW , the GW self-energy, and Vxc, the exchange-correlation potential used in the KS calculation.25
The optical-spectra are calculated by solving the Bethe-Salpeter equation (BSE):26
(εQPck − εQPvk)Asvck+ X v′c′k′ hvck|Keh|v′c′k′iAs v′c′k= Ω sAs vck. (2) Here, the electronic excitations are expressed in a basis of electron-hole pairs |vcki corresponding to transitions at a given k from a state in the valence band (v) with energy εQPvk (hole) to a conduction-band (c) state with energy εQPck (electron). As
vck are the expansion coeffi-cients of the excitons in the electron-hole basis and the Ωs are the excitation energies of the system. In case of spin-polarized defects we performed spin-polarized calcu-lations both at the GW and BSE level.
III. CALCULATION DETAILS
In this section we report the convergence parameters that enter in each of calculations discussed in the previ-ous section.
Structure optimization has been performed using a 0.42 Bohr grid spacing on the wavelet mesh and then in plane-wave we used a cutoff of 80 Ry to generate the KS plane- wave-functions. In the G0W0 calculation, we used 1500 bands
FIG. 2: [Color online] Isochronal annealing of carbon/oxygen related defects in silicon. Colored lines are simulated curves, with the C-form of CiCsfor plain
lines and the B-form for the dotted lines. The black lines represent experimental values.
for the expansion of the Green’s functions and for the cal-culations of the screened interaction W , 30.000 G-vectors to expand the Kohn-Sham orbitals, 2 Ha cutoff for the G−vectors entering in the dielectric constant. The di-electric constant entering in the definition of W has been calculated using a double-grid technique to integrate in the Brillouin Zone with a single k-point (gamma point) for the matrix elements and a 2×2×2 shifted grid for the single-particle energies, see Ref. 27 for details. The same double-grid technique has been used in the calculation of the optical response. For the BSE we used the static part of the screening calculated in the GW, 100 valence bands and 100 conduction bands for the calculation of the optical absorption, and 15.000 G-vectors to describe the Kohn-Sham wave-functions. Then the BSE equation has been inverted and interpolated on the double grid too.27 All the GW and BSE calculations have been performed with the Yambo code.28
IV. RESULTS AND DISCUSSION
In this section we will address the structural, vibra-tional, electronic and optical properties of the different CiCscomplexes.
a. Structure and binding energies of the various forms of the CiCs complex In Figures 1a - 1d, the four obtained optimized configurations of CiCs complex are shown. In the A-form, carbon atoms occupy neighboring lattice sites, while the Si atom is an interstitial bonded to both carbon atoms and one silicon. The B-form is similar to A but the interstitial Si only bridges the two carbon
4 Defect B Defect C Defect A 0.63 eV 0.36 e V 0.66 eV 0.40 e V 0.72 eV 0.48 e V Defect D 0.68 eV 0.3 eV (a) DFT level Defect B Defect C Defect A
0.92
eV
0.62 e V0.99 e
V
0.73 eV1.03
eV
0.96 e V Defect D0.91
eV
0.79 e V (b) G0W0 levelFIG. 3: [Color online] Schematic band structure of the defects levels in the different complexes.
atoms and are not bonded to another Si. The third con-figuration consists of two carbons in a vacancy aligned in a (100) crystallographic direction. D-form slightly differs from the previous configuration: all Si atoms bonded to two C atoms are slightly twisted around a C-C axis. D-form was obtained through non-spin-polarized geometry optimization. The initial configuration for this optimiza-tion was chosen to be slightly different from the C-form. Thus, we can conclude, that D-form is another local min-ima, which is similar to the C-form but almost 0.4 eV higher in energy.
The twisted shape of the D-form can result from the rotation of π-orbitals of two C atoms in order to form a π bond (see Figures 1c and 1d). In the C-form, the two corresponding π-orbitals are perpendicular to each other; each of them is occupied by one electron, making this complex paramagnetic.
All four forms of CiCs complex can be created from very same ingredients, i.e. from mobile interstitial car-bon and immobile carcar-bon in substitution. Depending on the topology of the reaction, either A and B or C and D forms can be reached. In a neutral state, A will di-rectly transform to B, as B is more stable. The A to B transformation barrier has been estimated to be as low as 0.1 eV15. Transformation from either A (or B) to C and backward is less probable as the transformation barrier have been estimated to be as high as 2-3 eV16. Never-theless, the kinetics of CiCs complex formation and
re-orientation, i.e. various migration barriers, is out of the range of the present study. Interested readers can find information in the work of Zirkelbach et al.15.
The binding energies of the complex were calcu-lated as Eb(CiCs) = −Etot(215SiCiCs) − Etot(216Si) + Etot(215SiCs) + Etot(216SiCi) and the obtained values are listed in Table I. The C-form is found to be the most stable among all. These results are in contradiction with some recent theoretical studies14,16 however it is in agreement with findings of Zirkelbach et al.15 and Liu et al.13. We demonstrate the crucial role of the spin in complex respective stabilities, as it increases the binding energy by about 0.17 eV compare to non-spin polarized calculations (0.2 eV in Ref.15). The D configuration has a binding energy of 0.88 eV, which is close to that of A-form.
Eb, eV This work Ref.15 Ref.16 Ref.14 Ref.8 Ref.9 Ref.13 A-form 0.86 0.93 0.92 w x-0.35 y-0.11 z-0.2 B-form 0.93 0.95 1.28 w-0.4 x y z-0.2
C-form 1.11 0.90 w-0.2
C-form(SP) 1.28 1.28 z
D-form 0.88
TABLE I: Binding energies in eV for four configurations of CiCs. Some authors have only reported relative
values. That is why, energies of the most stable configurations from References14,8,9, and13are indicated with letters w, x, y, and z, respectively. SP
states for spin polarized calculations.
Generally speaking, all these forms can be present in a heavily carbon doped silicon, and their relative con-centrations should depend on their binding energies. It should be also taken into account, that formation kinet-ics can impact significantly the balance between the four complex concentrations. That is why, even if the A- and B-forms are indeed less stable than the C-form, they could be present in the sample and could be detected by various experimental techniques, such as IR and EPR spectroscopy.
In experiments, a 546 cm−1 band is used to measure the CiCs complex concentration. The Figure 2 shows the concentrations of various carbon related defects in silicon during an isochronal annealing (20 min). Those concentrations are extracted from Kinetic Mass Action Law (KMAL) simulations29 for the colored lines, and from the experiment30,31 for the black lines. Two dif-ferent simulations were made: the curve in plain lines takes into account the binding energy of the C-form of CiCs(Eb= 1.28 eV), whereas the one in doted lines takes into account the binding energy of the B-form (Eb= 0.93 eV).
The two simulations exhibit the main features of the experiment: species, their concentrations, and the reac-tion temperatures. The only difference between the two simulations is the binding energy of CiCs pair. While
B-form, the decay of CiCs pairs at lower temperatures (190 ℃) liberates the mobile Ci species, causing the rise in CiOi concentration just before its dissociation. This rise is not seen experimentally, adding a further proof that the C-form is the one detected in this experiment.
Defect A pure system Defect B pure system Defect C pure system eV Defect D pure system
FIG. 4: [Color online] Density of states at the G0W0 level, in presence of the different defect complexes, compared with the one of the bulk silicon with the same
supercell. The arrows indicate the position of the defects deep-levels in the band gap.
The just described observation is a strong evidence for the presence of the C-form in irradiated silicon, but more detailed analysis of other properties should be performed in order to finally assign the observed properties of dicar-bon pair to any of its form. Hereafter, we will consider four forms of CiCspair, namely A-, B-, magnetic C-, and D-form, as far as they are the most interesting configu-rations. Particularly, we will define their vibrational and excited states properties.
b. Vibrational properties One of the easiest ways to decipher the exact configuration of defects presented in a sample is a combined theoretical-experimental investiga-tion of LVMs. An accordance between the obtained val-ues would unambiguously point a correct structure, while lines’ intensity would give an estimation of concentration. Therefore, we present here our theoretical investigation of LVMs of the four forms of CiCsand will compare them with already published results (see Table II). Our values for the A- and B- forms are in excellent agreement with experiment and previous calculations. For the C-form our results differs in larger extend. This can be related to the differing geometries of the C-form between our and Docaj’s study.16Spin polarization was not taken into ac-count in the study of Docaj, thus they could deal with the D-form or another local minimum. The obtained re-sults can be a reference point for future IR experiments,
according to our calculations the highest frequency of C-form correspond to 1135 cm−1 and is obviously out of the scope of the just mentioned work.
c. Electronic and optical properties While the situa-tion is rather clear with LVM fingerprints, which is hard to misinterpret, more attention should be paid to the formation kinetics and optical properties of the forms of carbon-carbon pair. We start our discussion of the elec-tric properties of the four complexes at the Kohn-Sham level. In Figure 3a we report a schematic representation of the electronic band structure of the four defects. We found that although we use a large supercell, more than 200 atoms, the presence of the defects slightly affect the bulk gap, by about 0.13 eV in the worst case of the com-plex A, due to resonant defect states. We found that the four complexes present deep levels in the band gap. In the A, B and D cases there is a single level inside the gap situated respectively at 0.36 eV, 0.40 eV and 0.30 eV from the top valence band. The C case is different be-cause the defect is spin-polarized and therefore the level in the gap is split into two levels one for each spin po-larization. Finally, we have to mention that in the D complex there is a strong resonance close to the top va-lence bands, that generates a strong absorption peak at high frequencies as we will see in the following. Then we turn on quasi-particle correction and obtain the band structure schematically reported in Figure 3b.
The GW correction opens the gap from 0.76 eV to 1.1 eV and also raises the deep level positions respect to the top valence bands. In the A,B and D cases these levels remain in the band gap while in the C case the two levels almost merge with the bottom of the conduction bands (see Figures 3a and 4). This fact has important implications on the optical properties as we will see in the following. Beyond the shift of the electronic levels. The corresponding density of states (DOS), calculated using a 2 × 2 × 2 shifted grid plus the gamma point, is reported in Figure 4. We compare the DOS of the four defected structures with the one of the pure system aligning the top valence band position. The DOS of the four complexes are similar to the one of the pure system but the peaks are smoother because of the presence of defects that breaks symmetries in the supercell. In the band gap the deep levels are clearly visible, execpt for the C case, where DOS generated by defect levels merges with the one of the conduction DOS. Now that we have analyzed the electronic structure of the four defects we move to their optical properties.
The optical response was evaluated by means of the GW plus Bethe-Salpeter equation (BSE), i.e. including both local-field effects and electron-hole interaction, see Figure 5.
6
this study Docaj16 Leary8 Capaz9 Lavrov7 Lavrov32
theory theory theory theory experiment experiment
A B C-SP D A B C-NSP B A B A B N/A 933 819 1135 1182 917 805 1181 838 890 841 953 842 749 861 702 801 744 912 704 810 715 874 716 873 730 527 699 608 733 732 710 663 806 649 722 643 722 641 572 548 549 525 598 567 580 582 567 567 597 580 566 525 591 563 552 557 514 594 543 521 549 543 503 540
TABLE II: Frequencies in cm−1 of the three A,B and C forms of CiCs pair.
Defect A Defect B Defect C 1000 1100 1200 1300 1400 1 m Defect D
FIG. 5: [Color online] Optical absorption in presence of the different defect complexes with the G0W0approximation plus the
Bethe-Salpeter equation. The vertical lines are the experimental light emission1,2
with light emission experiments we will discuss here only the lowest absorption peaks of the four complexes, the ones affected by the presence of the defects. The opti-cal spectra at the Independent Particle Approximation (IPA) level, can be easily deduced from the band struc-ture. Correlation effects modify the spectra in two ways: first the GW corrections shift the level positions and sec-ond the BSE mixes the single particle transitions and redistribute the spectral weight. In the case of the B complex these effects just modify the shape of the spec-tra leaving the lowest absorption peak around 1450 nm. In the A case there is strong redistribution of the spectral weight, the peak at 1300 nm disappears and the peak at 1350 nm acquires more strength. But the C and D cases are the one most affected by the GW corrections (see schematic band structure 3b). In fact the deep levels of the C complex are pushed up by GW correction and so the absorption peaks move to lower wave-lengths. In the D case the peak at high energy is shifted toward lower frequencies. Fig. 5 illustrates the situation, now low-est absorption peaks of the C complex are at 1080 nm and 1150 nm while the one of the D complex is around 1180 nm. The final outcome of these results is that now the absorption peaks of the A and B complexes are too
high in wavelengths to explain the G-center emission, while the C and D remain close to the emission measured in the experiments.
V. CONCLUSIONS
In this paper we have performed a detailed investiga-tion on the properties of the forms of the CiCs complex from first principles calculations. We intend to better understand what are the properties of the possible forms of CiCscomplex and why the C-form, which is the most stable according to our calculations, has been never ex-perimentally observed so far. In addition, we tried to characterize theoretically the optical properties of the four forms of carbon-carbon pair, and assign one of them to the light emitting G-centre.
First, we found that among all four CiCs forms, the C-form is the most stable, as it’s binding energy is 0.4 eV higher that that of the B-form. Moreover, KMAL isochronal annealing simulations show that the dissocia-tion temperature of 546 cm−1 band, that is used to de-termine the stability of CiCscomplex, corresponds to the binding energy of the C-form. Meanwhile, that of the B-form lead to a dissociation at about 100 ℃ lower in tem-perature, which leads to a strong disagreement with ex-periment and therefore becomes another evidence for the C-form existence. Second, we attribute a set of localized vibrational modes to each of four configurations. The set corresponding to the C-form contains four bands, three of which are at the range of those of A- and B-forms, and can be overlaped with those. The highest band of 1135 cm−1 is above the registration range of most LVM ex-periments, thus it could be missed during measurements. Then we studied electronic and optical properties of the CiCs complexes. We found that the inclusion of corre-lation effects is crucial to describe the optical properties of C-C defect complexes. In fact, the different approxi-mation in standard semi-local functionals fail to describe the correct level position of localized and resonant de-fect states respect to the bulk levels. Therefore, we pro-vide here an accurate quasi-particle band structure of the four complexes and their optical absorption with the GW+BSE approximation. Regarding now the form
re-Up to our knowledge, no evidences of C-form have been obtained by the Electronic Paramagnetic Reso-nance technique, which is another effective characteri-zation method. However, as the C-form is a magnetic complex according to our simulations, its signal should lie in a range of the spectra, situating far from the sig-nal of neutral species. Hence, additiosig-nal characterization experiments are necessary, in order to investigate the C
VI. ACKNOWLEDGMENTS
Computing time has been provided by the national GENCI-IDRIS and GENCI-TGCC supercomputing cen-ters under contracts not2012096655 and not2014096107.
1 D. Berhanuddin, M. Lourenco, C. Jeynes, M. Milosavl-jevi´c, R. Gwilliam, and K. Homewood, Journal of Applied Physics 112, 103110 (2012).
2 D. D. Berhanuddin, M. A. Louren¸co, R. M. Gwilliam, and K. P. Homewood, Advanced Functional Materials 22, 2709 (2012).
3 K. Murata, Y. Yasutake, K.-i. Nittoh, S. Fukatsu, and K. Miki, AIP Advances 1, 032125 (2011).
4 K. L. Brower, Phys. Rev. B 9, 2607 (1974).
5 K. O’Donnell, K. Lee, and G. Watkins, Physica B+ C 116, 258 (1983).
6 L. W. Song, X. D. Zhan, B. W. Benson, and G. D. Watkins, Phys. Rev. B 42, 5765 (1990).
7 E. V. Lavrov, L. Hoffmann, and B. B. Nielsen, Phys. Rev. B 60, 8081 (1999).
8 P. Leary, R. Jones, S. ¨Oberg, and V. J. B. Torres, Phys. Rev. B 55, 2188 (1997).
9 R. B. Capaz, A. Dal Pino, and J. D. Joannopoulos, Phys. Rev. B 58, 9845 (1998).
10 R. Laiho, M. Vlasenko, and L. Vlasenko, Solid State Com-munications 124, 403 (2002).
11 H. Wang, A. Chroneos, C. A. Londos, E. N. Sgourou, and U. Schwingenschl¨ogl, Scientific Reports 4, 4909 (2014). 12 H. Wang, A. Chroneos, C. A. Londos, E. N. Sgourou, and
U. Schwingenschl¨ogl, J. Appl. Phys. 115, 183509 (2014). 13 C.-L. Liu, W. Windl, L. Borucki, S. Lu, and X.-Y. Liu,
Applied Physics Letters 80, 52 (2002).
14 A. Mattoni, F. Bernardini, and L. Colombo, Phys. Rev. B 66, 195214 (2002).
15 F. Zirkelbach, B. Stritzker, K. Nordlund, J. K. N. Lindner, W. G. Schmidt, and E. Rauls, Phys. Rev. B 84, 064126 (2011).
16 A. Docaj and S. Estreicher, Physica B: Condensed Matter 407, 2981 (2012).
17 L. Genovese, A. Neelov, S. Goedecker, T. Deutsch, S. A. Ghasemi, A. Willand, D. Caliste, O. Zilberberg,
M. Rayson, A. Bergman, et al., The Journal of chemical physics 129, 014109 (2008).
18 M. Krack, Theoretical Chemistry Accounts 114, 145 (2005).
19 J. P. Perdew, K. Burke, and M. Ernzerhof, Phys. Rev. Lett. 77, 3865 (1996).
20 E. Bitzek, P. Koskinen, F. G¨ahler, M. Moseler, and P. Gumbsch, Phys. Rev. Lett. 97, 170201 (2006).
21 We checked that the optimized structures did not significa-tivity change if we reoptimize them using plane-waves and Troullier-Martins pseudopotentials.
22 P. Giannozzi et al., J. Phys. Condens. Matter 21, 395502 (2009), http://www.quantum-espresso.org.
23 N. Troullier and J. L. Martins, Phys. Rev. B 43, 1993 (1991).
24 F. Aryasetiawan and O. Gunnarsson, Rep. Prog. Phys. 61, 237 (1998).
25 W. G. Aulbur, L. Jonsson, and J. W. Wilkins, Solid State Physics (edited by H. Ehrenreich and F. Spaepen), Aca-demic press 54, 1 (1999).
26 G. Strinati, Riv. Nuovo Cimento 11, 1 (1988).
27 D. Kammerlander, S. Botti, M. A. L. Marques, A. Marini, and C. Attaccalite, Physical Review B 86, 125203 (2012). 28 A. Marini, C. Hogan, M. Gr¨uning, and D. Varsano,
Com-puter Physics Communications 180, 1392 (2009).
29 G. Brenet, D. Timerkaeva, E. N. Sgourou, C. A. Londos, D. Caliste, and P. Pochet, J. Appl. Phys. 118, 125706 (2015).
30 E. Sgourou, D. Timerkaeva, C. Londos, D. Aliprantis, A. Chroneos, D. Caliste, and P. Pochet, Journal of Applied Physics 113, 113506 (2013).
31 C. Londos, E. Sgourou, D. Timerkaeva, A. Chroneos, P. Pochet, and V. Emtsev, Journal of Applied Physics 114, 113504 (2013).
32 E. V. Lavrov, B. B. Nielsen, J. R. Byberg, B. Hourahine, R. Jones, S. ¨Oberg, and P. R. Briddon, Phys. Rev. B 62, 158 (2000).
![FIG. 2: [Color online] Isochronal annealing of carbon/oxygen related defects in silicon](https://thumb-eu.123doks.com/thumbv2/123doknet/12842015.367288/4.918.512.811.77.384/color-online-isochronal-annealing-carbon-related-defects-silicon.webp)
![FIG. 3: [Color online] Schematic band structure of the defects levels in the different complexes.](https://thumb-eu.123doks.com/thumbv2/123doknet/12842015.367288/5.918.81.462.70.512/color-online-schematic-structure-defects-levels-different-complexes.webp)
![FIG. 4: [Color online] Density of states at the G 0 W 0](https://thumb-eu.123doks.com/thumbv2/123doknet/12842015.367288/6.918.85.460.273.515/fig-color-online-density-states-g-w.webp)
![FIG. 5: [Color online] Optical absorption in presence of the different defect complexes with the G 0 W 0 approximation plus the](https://thumb-eu.123doks.com/thumbv2/123doknet/12842015.367288/7.918.90.454.320.561/color-online-optical-absorption-presence-different-complexes-approximation.webp)
