1
Version 3.0 (September 2013)
2
Changes regarding previous version
The changes between the present report (Version 3.0, September 2013) and Version 2.0 (August 2013) are principally related to the adjustment of the Water Impact Index for the indirect water uses (supply chain, electricity and fuels consumption), using equation 4 of the section “2.4 Midpoint Impact Assessment” in the page 6, that uses Water Stress Index of the origin of the indirect water use, when available. Other adjustments made:
Clariant: Correction of tap water withdrawal for 2012.
Holcim: Diesel consumption in Nobsa plant was adjusted for 2011 and 2012.
Nestlé: Water consumed was recalculated, because there was a double counting given that water content within the supply chain (fresh milk) at Bugalagrande and Florencia was not included previously as a negative consumption. The electricity consumption for “refrigeration”, “compressed air” and “water boiler” that is accounted for the whole plant was included through an estimation of the percentage that corresponds to the dairy products section.
3
Water footprint assessment results for SuizAgua Colombia Pilot Project Phase I
Abstract The SuizAgua Colombia project is a Swiss Development Cooperation (SDC) initiative in a public-private partnership with a group of 4 Swiss and 7 Colombian companies. It aims at applying the water footprint concept and methodology as an indicator that contributes to improving water use awareness, efficiency and water pollution control. This report focus on the water footprint assessment and reduction of the 4 Swiss companies operating in Colombia: Clariant, Holcim, Nestlé and Syngenta.
The first step was to assess and understand the water footprint of a selected process or product; including water withdrawal, consumption and pollution. In a second step, the water footprint hotspots allow the identification of reduction
measures priorities. Additionally, each one of the participating companies, along with SDC, undertook social and environmental responsibility actions related to a better water management in their area of influence.
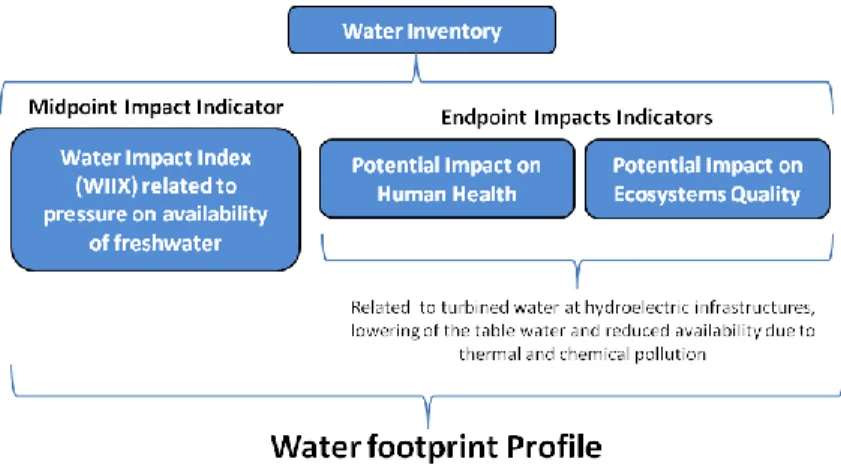
The water footprint evaluation was carried out for the years 2009 to 2012. Three steps were followed: i) water inventory. ii) Calculation of an impact indicator linked to water resources consumption and pollution (Water Impact Index – WIIX). The amount of water consumed is also reported. iii) Calculation of several impact indicators classified in two categories: Potential impact on Human Health and Potential impact on Ecosystems Quality. This report is meant to provide an overview of the project’s results, highlighting the related assumptions and limitations. The report includes: a general description of the applied methodology, based on the Life Cycle Assessment (LCA) approach, a description of the studied systems per company, water use hotspots, information on direct and indirect water consumption, changes on the WIIX and water consumed during the 4 years of analysis with the work team’s interpretation, and actions implemented by the companies aiming at reducing their water footprint. This study was developed by SDC with the scientific support of Quantis, and the inventory key data, on which the results are based, was provide directly by the partner companies. An important capacity development process has taken place. Challenges remain, but the 4 companies are interested in improving the calculation model and in following up their water footprint reduction measures and assessment.
Introduction
Water supports life and it is directly linked to social, economic and political human dimensions. Water management is at the center of the sustainable development international debate. This interest arises with increasing demand, scarcity and quality degradation, generating more tension between different water users. It becomes urgent to recognize the value of water for society, economy and ecosystems; along with the need for a better understanding of water use and its related impact on ecosystem resources and human health, in order to improve water use management and its efficiency. In this context, industry is strongly influenced by water availability, in quantity and quality; directly on the operations, along the supply chain and/or downstream operations. Therefore, companies around the globe have an increasing interest in water-related issues, and they are moving forward to integrate water management in risk management and business plans.
The Global Program Water Initiatives (GPWI) of the Swiss Development Cooperation Agency (SDC) seeks to contribute at finding solutions to the global challenges linked to water. It participates in programs and networks that aim at improving the provision of clean drinking water, enhancing sanitation, and upgrading irrigation in the agricultural sector. In 2009, the Swiss Ministry of Foreign Affairs aimed at strengthening collaboration between SDC and Swiss enterprises in Colombia. As a result of this effort, the “SuizAgua Colombia” pilot project was launched in 2010, as a public - private partnership with Clariant, Holcim, Nestlé and Syngenta. 7 major Colombian companies have joined the project, along with the National Center for Cleaner Production. A geographic application of the water footprint is underway for the Porce River watershed, in coordination with the Center of Science and Technology of Antioquia. At a global level, SDC provides scientific support for the development of the ISO 14046: Water Footprint: requirements and guidelines. At a regional level, in 2012, the project SuizAgua Andina started the process with 10 companies in Peru and Chile.
4
Contents
1. Definitions ... 4
2. Methodology ... 5
3. Results ... 8
4. Main Conclusions and future steps ... 20
5. Bibliography ... 21
1.
Definitions
*Definitions based on ISO14040/14044.
System boundary: set of criteria specifying which unit processes are part of a product system Functional unit: quantified performance of a product system for use as a reference unit
Impact category: class representing environmental issues of concern to which life cycle inventory results may be assigned
Category midpoint: intermediate variable that assess the risk associated to extractions (inputs) and emissions (outputs) linked with category endpoint
Category endpoint: attribute or aspect of natural environment, human health o resources, identifying an environmental issue giving cause for concern. In this report, two endpoint categories where used: potential impact on ecosystems (measured in PDF•m2•yr) and potential impact on human health (measured in DALY)
Life cycle: consecutive and interlinked stages of a product system, from raw material acquisition or generation from natural resources to final disposal
Life cycle assessment LCA: compilation and evaluation of the inputs, outputs and the potential environmental impacts of a product system throughout its life cycle
Water use: a term used in the context of water footprint assessment in relation to consumption and pollution of freshwater for human activities.
Water withdrawal: anthropogenic removal of water from any water body, either temporary or permanent
Consumed water: It is water either; incorporated into the product, evaporated, displaced from one water basin to another or discharged in the ocean. It is equivalent to blue water footprint definition from the Water Footprint Network.
Green water: Rain water that does not run off or recharge the groundwater but is stored in the soil or vegetation and eventually evapotranspirates. In this analysis, this water use has not direct impact associated
Water footprint: life cycle impact parameter(s) that quantify the potential environmental impacts related to water
Water Impact Index (WIIX): Midpoint indicator that incorporates the volume and quality of both water withdrawn and water released back into the environment; also the Water Stress Index (WSI): (which accounts for the level of water stress in a geographic area)
DALY: (“Disability Adjusted Life Years”) characterizes the disease severity, accounting for both mortality (Years of Life Lost (YLL) due to premature death) and morbidity. For example, a product having a human health score of 3 DALYs implies the loss of three years of "healthy" life over the overall population
5
PDF·m2·yr: (“Potentially Disappeared Fraction of species per m2 per year”) is the unit of measure for the impacts on ecosystems. The
PDF·m2·yr represents the fraction of species disappeared on 1 m2 of earth surface during one year. For example, a product having an ecosystem quality score of 0.2 PDF·m2·yr implies the loss of 20% of species on 1 m2 of earth surface during one year. (Bayart, et al., 2010). In other words, 0.2 m2 with a 100% of species lost, during one year.
2.
Methodology
For SuizAgua Colombia, a specific framework has been developed based on existing methodologies for addressing water use impact assessment within the frame of Life Cycle Assessment (ISO 14044, 2006). This framework is inspired by the work of the Water Use Life Cycle Impact Assessment group, which is a UNEP – SETAC initiative (Bayart, et al., 2010). It is important to highlight that the water footprint is obtained from calculation models, which are a simplification of reality. Keeping this in mind, the challenge is to develop a calculation model for each company, in a way that estimations and assumptions influence the least results and conclusions.
The first requirement is to define the Goal of the water footprint study. The goal in this project was to develop the capacities on water footprint of SDC’s team, companies and to facilitate scaling up. For each company the goal was to identify the water use hotspot, in order to identify reduction measures. It is also needed to define the Functional Unit and characteristics and System Boundary of the selected system.
2.1. Collected information
The water inventory data and other supplies information was collected per company’s system along the years 2009, 2010, 2011 and 2012. All water uses were registered, both direct and indirect (mainly raw materials consumption, electricity consumption, fuels consumption, etc.). Information about water quality characterization of water withdrawn and waste water was also required; such data is useful for assessing water degradative use (Water Impact Index and potential impacts on human health and ecosystems quality).
Water inventories for indirect water uses (supply chain, energy consumption) were calculated using the Quantis Water Database, which is a development based on the Ecoinvent Database v2.2 (Frischknecht, et al., 2007).
2.2. Stages of the assessment procedure
In order to assess impacts related to water use, the procedure was based on the following steps (also illustrated by Figure 1)
6 2.3. Water inventory
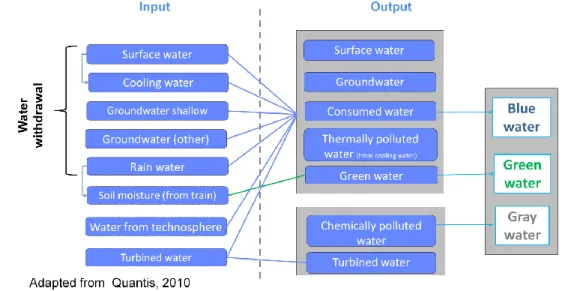
Includes a description of supply chain materials, energy consumptions, and all water streams that go into the system directly or indirectly through material and energy flows; specifying their magnitude, units and location. Such inventory is then balanced between inputs and outputs water categories, as show in Figure 2. The emissions of pollutants to water are also included.
Figure 2. Step 1: water inventory and water classification
Water input categories depend on the source (e.g. withdrawal from surface, groundwater, rain, technosphere (water contained in supply chain materials) and the destination of use (e.g. cooling). Water output categories are divided depending on destination (surface water, groundwater water, consumed water (water evaporated or incorporated into the product), green water (evapotranspiration from plants and soils) and chemically polluted water or grey water, being this last the volume of water that is required to dilute pollutants to such an extent that the quality of the water remains at or above agreed water quality standards. Although for this project, the impact associated to the releases of pollutants is estimated using the Water Impact Index and some endpoint impact indicators as shown in the following sections.
2.4. Midpoint Impact Assessment
The midpoint impact assessment is based on the Water Impact Index (WIIX) method (Bayart, et al., 2010). As shown in Figure 3, this method estimates the impact on water resources availability by calculating an index that takes into account: water consumption, water quality and water scarcity, in a specific geographic area. The latter using the Water Stress Index (Pfister, et al., 2009).
The WIIX considers the water quality of the source, the quality of the water released (waste water), as well as an optimum quality of reference; in this project Veolia’s used references were used (MEED & Agences d l'eau, 2003) (Legifrance, 2010).
The WIIX estimates a water footprint “impact score”, in equivalent
7 WIIX cubic meters (m3 WIIX eq), by means of the Equation 1.
(
Equation 1)For this study, the systems’ inputs and outputs take place at the same watershed, thus the Equation 1 becomes:
(Equation 2)
Where
(Equation 3)
QW, QR = Quality index calculated for the water withdrawn (QW) and for the water release to nature (QR). QW, QR value is 1, when the water
quality is optimal, meaning the pollutant concentration does not exceed the concentration of reference (Cref) or is even lower. Cref could be
zero since concentration of reference for toxic chemicals (e.g. highly carcinogenic) could be zero.It is defined by the most critical pollutant; this principle is based on the “critical load” approach, as in the methodology proposed by (Hoekstra, et al., 2011).
Cref = Concentration of a particular pollutant in water which should not be exceeded in order to protect the environment. CW, CR =Concentration of the pollutant of the withdrawn stream CW and the released stream CR.
WSI = Water Stress Index. This index estimates the local water stress relating water supply and demand (Pfister, et al., 2009). Pfister calculated WSI values per country and per “watershed” (dividing the earth globe in a grid cell of 0.5° by 0.5°, this information is available through internet as a Google Earth layer1). In this project, grid cell WSI was addressed when possible, and country or global WSI when no
specific information was available.
For indirect water use through supplies consumption, the Quantis database WIIX was used. This database uses a global WSI for calculating the WIIX, therefore, as an estimate; the WIIX was adjusted through the following expression:
(Equation 4)
For direct water uses the WIIX must be calculated with known flow’s values, water quality data and location of water withdrawal and releases. It must be noticed that for Colombia, most of the watersheds according to (Pfister, et al., 2009) have a WSI of 0.012. Thus, further studies should focus on calculating a WSI to a smaller scale.
2.5. Endpoint Impacts Assessment
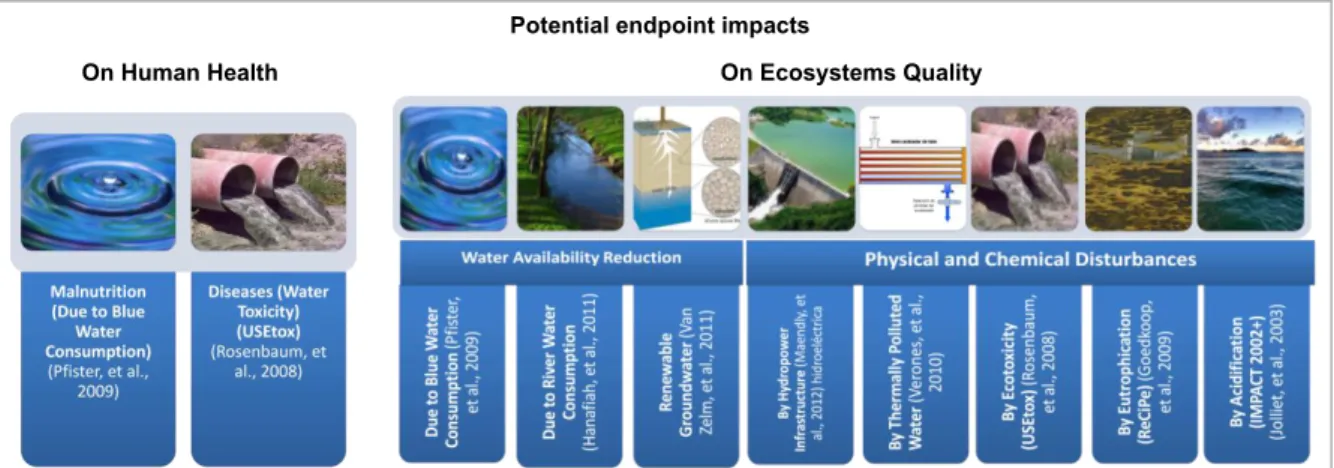
Different endpoint assessment methods are taken into account, which estimate potential impacts on two categories: Human Health and Ecosystems Quality. Human Health impacts are commonly expressed in Disability-Adjusted Life Years (DALY); Ecosystems Quality impacts are expressed in Potentially Disappeared Fraction of Species (PDF) per square meter, during a year (PDFm2y). The estimation of these impact assessment methods is presented in percentages on the "hotspots" table per company (below). Figure 4 presents the indicators included for each category: Human Health and Ecosystems Quality. For indirect water uses, these indicators were calculated through the database information. For indicators related to water consumption, (Pfister, 2009), toxicity (Rosenbaum, et al., 2008) and eutrophication (Goedkoop, et al. 2009) the direct water use inventory data per company was used for the calculation.
8
Potential endpoint impacts
On Human Health On Ecosystems Quality
Figure 4. Step 3: Endpoint indicators assessed for potential Impacts on Human Health and Ecosystem Quality (adapted from Quantis, 2011)
3.
Results
The system boundaries and functional unit were defined with each company. Assumptions were sometimes necessary in order to complete the water footprint assessment, to fill missing data. Limitations related to such assumptions need to be accounted while analyzing and communicating the results.
All the systems were analyzed under the scope “cradle to gate”; excluding steps of transportation, sale, use and final disposal of products. To complete the water footprint study within the Life Cycle Assessment approach, further studies should include those steps. For most of the systems, water uses associated to supplies’ transport and products’ packaging were not included in the analysis.
3.1. Clariant (Cota production site)
3.1.1. Functional unit and system boundary
The analysis was focused on the annual production of Clariant’s plant (as functional unit), located at Cota, Cundinamarca. The production lines are: Master Batch (MB), which are solid and liquid additives used for imparting specific properties to plastics; and supplies for Oil and Mining Services (OMS).
3.1.2. Data quality and main assumptions
The plant has a list of supplies of nearly 2400 substances; most of them were grouped together and modeled as generic organic or inorganic compounds. Only country level location was available for some supplies, therefore the WSI used represents an average for that location. Most of the flows within the system were estimated, except for the tap water use, and for 2012, treated waste water. The estimations were based on average equipment’s consumption, values estimated by the company’s technicians, extrapolation of punctual measurements, mass balances and annual meteorological data (precipitation and evaporation) from the national institution: IDEAM. The WIIX associated to the supply chain was modeled with the database, using a global average WSI.
9 3.1.3. Water Impact Index (WIIX)
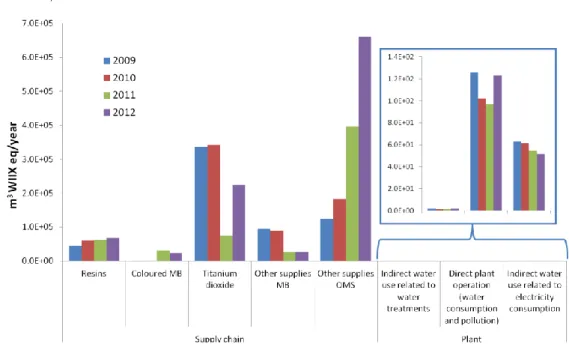
As shown in Figure 6, 99.98% of the WIIX is due to the supply chain. Only 0.02% is due to water uses in the plant, from which 86% is associated to direct water uses and the rest due to electricity consumption. Figure 7 also presents that highest impact according to WIIX is related to the supplies consumption: mostly Titanium Dioxide; and OMS supplies (others). The WIIX among the years varies highly due to changes in production and therefore, in the amount of supplies required. There was an increase of OMS production between 2009 and 2012. Figure 7 also shows that indirect water use, related to electricity consumption for the plant operation, decreases along the years, and that direct water consumption and pollution per year decreased between 2009 and 2011 but increased in 2012 due mainly to a higher water withdrawal, associated to
higher production.
Figure 7. Overview of Water Impact Index for Clariant’s Cota Plant annual production 3.1.4. Hotspots
Table 1 shows that main impacts are associated to the supply chain: Titanium Dioxide and supplies for Oil and Mining Services products, accounting for around 80% of the estimated impacts. Clariant’s professionals consider having low incidence in the supply chain decisions for water footprint reduction; although they agree that increasing awareness about the weight of the supply chain in water use management is a first step. Water use at plant represents up to 5% of the impact in the different water footprint assessment stages evaluated. At plant, the electricity consumption has the highest share related to consumed water and to potential impact on ecosystems quality, while the WIIX is dominated by direct consumption and pollution of water.
Figure 6. Water Impact Index of Clariant Cota plant (average 2009-2012)
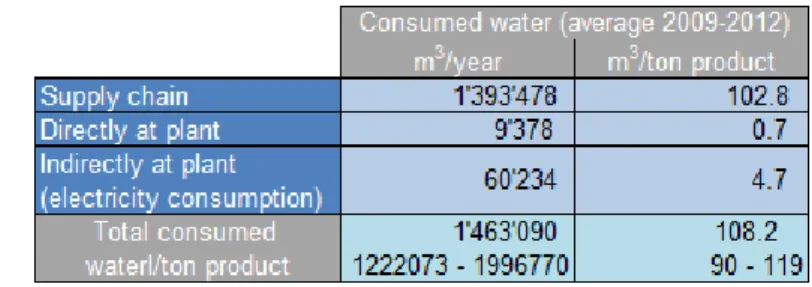
10 3.1.5. Consumed water
Table 2 shows the results of average water consumed for Clariant’s Cota plant operations between 2009 and 2012. According with Table 1 and Table 2, consumed water for Clariant varies between 90 and 119 m3 per ton produce and 5% of this consumption occurs at the plant. Regarding the water consumed at the plant, 4.7 m3/ton correspond to water consumed indirectly due to direct consume of electricity, and 0.7 m3/ton is the volume consumed directly at the Cota plant.
Table 2. Results for consumed water and WIIX for Clariant’s Cota plant.(Range for total value because of significant changes along the years)
3.1.6. Reduction actions
Main actions for water footprint reduction
• Tertiary industrial waste water treatment process, added to the existing treatment plant (2010, 2011) • Installation of water saving devices (2011, 2012)
• Improvement of electricity consumption efficiency by identifying equipment vibrations and by thermographies. Correction measures implemented. Luminary system adjustments (2011, 2012)
• Awareness rising for the plant’s personnel about water footprint: electricity and water saving campaigns (2011, 2012)
3.2. Holcim (Aggregates extraction site, Cement production site and concrete production sites) 3.2.1. Functional unit and system boundary
The analysis was focused on the concrete production line, which includes the operations of five plants: (2) concrete plants (Occidente and Sur), (2) aggregates extraction sites (Manas and Chocontá) and (1) the cement plant (Nobsa). Occidente, Sur and Manas are located in Cundinamarca, and the Nobsa plant, in Boyacá. According to (Pfister, et al., 2009); all this locations have a low water stress index. The functional unit was the production of 1 m3 of concrete
11 3.2.2. Data quality and main assumptions
For the water footprint calculations of these five plants, several streams were estimated as no flows data was available. The estimations made were based on mass balances, meteorological data and technical assumptions. In the year 2011, at the Manas aggregates plant, two new estimated flows were taken into account: pumped water to the exterior and deep percolation. For this reason, values of water flows and WIIX vary greatly between 2010 and 2011. Water quality data of the pumped water to the exterior was not available, therefore for WIIX calculation it was assumed that the output water quality was 10% of the input water quality. This assumption based on the potential presence of suspended solids due to the aggregates extraction. All runoff rainwater that is evaporated from mines soil, and water pools was classified as consumed water, as well as water used for the mixing truck’s cleaning that is released usually at the final destination site, usually in a different watershed. For 2012, both Manas and Choconta aggregates plants were out of service, thus the results of the water footprint in 2011 for Manas’s aggregates were used in the calculations of the Occident and Sur plants as indirect water footprint.
3.2.3. Water Impact Index
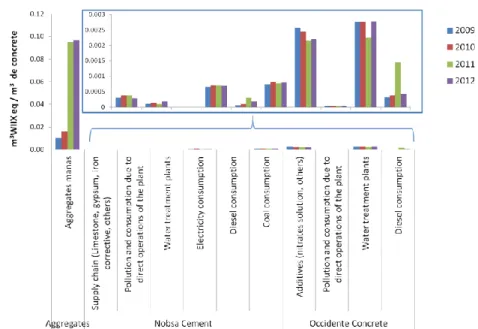
Figure 9. Water Impact Index for Holcim concrete production system (2011)
The Water Impact Index was calculated along the concrete production line, analyzing the operation of each production site from aggregates extraction to concrete production (where cement and aggregates mixing is carried out). Results for cement production at the Occidente and Sur plants are similar, thus only results for the Occidente Plant are illustrated in Figure 9 and Figure 10. Due to changes in flows accounted in the mass balance at Manas aggregates plant, Figure 9 presents 2011 WIIX results.
The water use with the highest WIIX is related to the direct water use at aggregates plant. This is due mainly to the large amount of withdrawal and the assumption of a release with 10% the quality of the input. Secondly, the WIIX is related to water uses at concrete plant, due mainly to direct water uses, and additives consumption. Lastly, cement production WIIX is dominated by indirect water uses, principally: coal consumption and electricity consumption. The modeling process used for aggregates consumed for production of concrete in the year 2012 was made with results of Manas plant. However, it is remarkable that if the modeling process of aggregates takes the average results between 2009 and 2011 of Chocontá plant, and it is applied for calculating results of concrete in 2012, the WIIX share of the aggregates decreases significantly (29% of total WIIX), being more important the WIIX due to concrete plant operation (52% of total WIIX).The WIIX share of each plants along the production system of concrete varies depending on the type of exploitation process for aggregates.
12
Figure 10. Water Impact Index for Holcim concrete production system with final stage at Occidente concrete plant 3.2.4. Hotspots
Table 3 shows main contributions to each stage of the water footprint assessment for Holcim analyzed system with final stage at Occident plant. At inventory level, the highest water footprint is related to direct water use at the aggregates plant in 2011-2012, and indirect water uses due to electricity consumption at the Nobsa cement plant. When evaluating WIIX indicator, the main impact is also associated to direct water use at aggregates plant, followed by to additives consumption at concrete plant. At the endpoint impact assessment, Coal consumption showed the highest contribution.
13
3.2.5. Consumed water
Table 3 shows average percentile distribution of consumed water in the Occident plant. Table 4 shows absolute values of consumed water per 1 m3 of concrete produced in both Occident and Sur plants. In total, between 2.1 and 2.8 m3 of water are consumed per m3 of concrete. Most of water consumption for concrete production is directly at plant. This is closely followed by water consumption due to energy consumption (electricity, diesel and coal consumption at all plants). Supply chain accounts for an average of 0.2 m3 of water consume.
3.2.6. Reduction Actions
Concrete plants: Occidente and Sur
Occidente plant - Main Actions for water footprint reduction (they are also part of their Plan for Efficient Use and Saving of Water) • Installation of hydro washers for mobile devices and water nebulizers
• Installation of timers for water provision for the concrete mixers • Integration of a rain harvesting system to the production flow • Change to the suction pipes to improve flow and avoid leaks
• Promotion of energy saving measurements: Campaigns to promote the use of hibernate mode in computers when they are not at used, change for more efficient luminary systems, shut down of lights that are not at used, installation of reflectors with timers
Sur plant - Main Actions for water footprint reduction (they are also part of their Plan for Efficient Use and Saving of Water) • Installation of hydro washers for use in trucks and mixers
• Installation of timers of a 20 m3 tank for storage of recycled water • Silo inoperative for expanding water storage capacity to 70 m3
• Construction of a gravel filter for rain water treatment and further incorporation in the production system
Cement plant: Nobsa
Nobsa plant - Main actions for water footprint reduction
• Replacement of ornamental water fountains by gardens that are irrigated with rainwater • Identification of inefficient potable and industrial water use places in order to eliminate leaks • Use of rain water in the industrial process
• Coal supply is controlled constantly to guarantee that the material used has an optimal heat capacity, this results in a lower coal consumption
• Holcim incorporates wastes, such as plastics (polystyrene, polypropylene), textiles and paper impregnated with hydrocarbons as a coal substitute
• Campaigns for the personnel in order to promote a optimal use of energy
Table 4. Results for consumed water for Holcim analyzed system with final production stage at Sur and Occidente concrete plants.
14
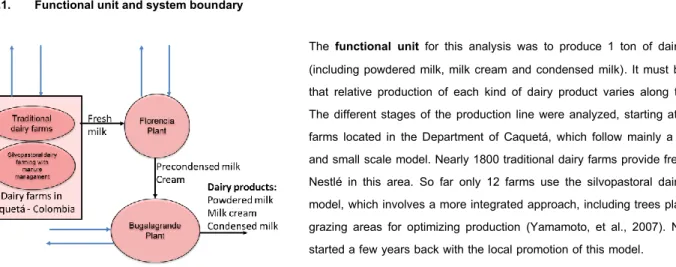
3.3. Nestlé (Dairy farms, Florencia and Bugalagrande production sites) 3.3.1. Functional unit and system boundary
The functional unit for this analysis was to produce 1 ton of dairy product (including powdered milk, milk cream and condensed milk). It must be noticed that relative production of each kind of dairy product varies along the years. The different stages of the production line were analyzed, starting at the dairy farms located in the Department of Caquetá, which follow mainly a traditional and small scale model. Nearly 1800 traditional dairy farms provide fresh milk to Nestlé in this area. So far only 12 farms use the silvopastoral dairy farming model, which involves a more integrated approach, including trees plantation in grazing areas for optimizing production (Yamamoto, et al., 2007). Nestlé has started a few years back with the local promotion of this model.
The fresh milk is provided to the plant located in Florencia, Caquetá, where milk fat separation and milk precondensation take place. These subproducts are sent to the Bugalagrande plant, located in the Department of Valle del Cauca, where the powdered milk, milk cream and condensed milk are produced. At the Bugalagrande plant, only cream and precondensed milk were considered in the supply chain, other supplies were excluded of the system’s boundary; also electricity consumption for compressed air and refrigeration that supplies all the Bugalagrande plant including the dairy section was not included. All the locations of the dairy products production line have a low water stress index according to Pfister (WSI of 0.01 o 0.012).
3.3.2. Data Quality and main assumptions
For this system, the dairy farms calculations were based on estimations made by Nestlé’s professionals working in milk collection, as well as literature related to water pollution at the milking zone, cattle hydration and water use at dairy farms (Loaiza, et al., 2009). For cow manure pollution data, a leaching rate of 10% of manure’s nitrogen was assumed (FAO, 2006). The concentration of leached nitrogen at grassland was estimated using average runoff in the area (there is a high precipitation in Caquetá). At the Florencia plant, all direct water uses were estimated by mass balances and technical assumptions, except for water withdrawal. At the Bugalagrande plant, all direct water flows were based on technical assumptions; variations on water uses along the years were estimated by extrapolations based on the dairy products production changes.
15 3.3.3. Water Impact Index
Figure 12. Water Impact Index Nestlé’s dairy products production system (average)
The Water Impact Index for each section of the dairy products’ production line is shown in Figure 12, Figure 13 and Figure 14. The highest impacts can be identified at dairy farms due to drinking water returned as manure’s pollution and service water for cleansing of cows and barns.
16
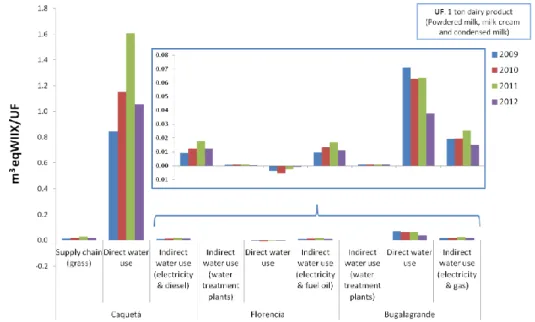
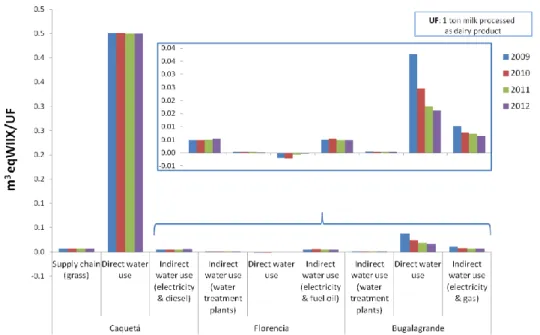
Figure 14. Overview of Water Impact Index, Nestlé’s dairy products production line and Functional Unit of 1 ton of fresh milk processed as dairy product
The WIIX behavior along the years is influenced by changes in production type, as it can be seen when comparing Figure 13, when it is shown that WIIX per ton of dairy product increased; and Figure 14, where it can be seen that WIIX per ton of fresh milk processed as dairy product generally keeps constant or decreased. There is an increase in requirement of milk per ton of dairy product (From 1.9 ton in 2009 to 3.6 ton in 2011).The WIIX due to dairy farm activities is dominant and it is related to both water consumption and pollution. Water withdrawn for cattle hydration is significant but part of it is incorporated into the milk or evaporated, and other part returned to nature by the cows’ excretions. It is assumed that 20% of the water used for barns’ cleaning evaporates and the remaining 80% turns into runoff and infiltration water, which is polluted. According to literature (Loaiza, et al., 2009), Total Kjeldahl Nitrogen (TKN) detected at milking zones output, could have an approximate concentration of 99.26 mg/L. TKN is the sum of organic nitrogen, ammonia (NH3), and ammonium (NH4+) in the
chemical analysis of soils and water.
A negative WIIX is identified at Florencia’s plant (Figure 13 and Figure 14), the water withdrawn at this plant has low quality and the company improves it by treating it for its use; and then it is treated one more time for returning it to the nature. There is more output water than input water too, since water is removed from milk, this water is also treated before being released. Along the years, the water withdrawn had a BOD ranging from 630 to 860 mg/L. The water released from Florencia’s plant had a BOD of 28.5mg/L in 2010 and 65.6 mg/L in 2011.
3.3.4. Hotspots
Table 5 shows that the water footprint of the dairy products production is mostly linked to the dairy farms water uses, because of the potential water eutrophication impact due to manure pollution accounting for 71% of the estimated ecosystems quality impact. The electricity consumption at the Bugalagrande plant is also a water footprint hotspot, representing 34% of the estimated human health potential impact. At consumed water and midpoint level, the hotspot is the water uses of milk production in Caquetá. In order to improve the environmental practices, silvopastoral models are being promoted by Nestlé among the farmers. Within
Table 5. Identified Hot spots at Nestlé’s powdered milk production system (average 2009-2011)
17
the SuizAgua Colombia Project, Nestlé, COSUDE and Nature Foundation had worked with 97 farmers in order to promote a better water management within their farms.
3.3.5. Consumed water
Table 6 shows that the Consumed water is in average 42.5 m3 per ton of dairy product. The water consumption is firstly linked to direct water uses at dairy farming, related to water evaporated from animals and from manure management. Secondly, water consumption is linked to energy consumption at the plants. Table 5 shows that water uses at dairy farming accounts for 64% of water consumption, while energy consumption (indirect water use due to electricity and diesel in Caquetá, electricity and fuel oil in Florencia, and electricity and gas in Bugalagrande) accounts for 25% of water footprint due to water consumption. Water consumed directly at plants is related principally to evaporation, both of water from fresh milk input and of the water boiler used in the process of the Bugalagrande plant.
3.3.6. Reduction Actions
Florencia
Main actions for water footprint reduction
• Pressure water guns installation for reducing water use (2011, 2012)
• Installation of a water steam recycling system, for the “3 effect“ evaporators and optimization of water consumed in the cooling tower • Standardized practices to be followed by the personnel when the production process stops (CIP validation). Optimization of cleansing times (2011, 2012)
• Installation of an automatic system for pumps lubrication (2011, 2012)
• Air turbines are shut down during peaks in electricity consumption (2011, 2012)
Bugalagrande plant
Main actions for water footprint reduction
• Installation of a water recirculation system in a water intensive equipment (Rotomat) (2011, 2012)
• Change in location of valves of evaporation equipment to a place of easy access; this allowed an optimal water use (2011, 2012) • Quick closure valves were installed in 16 hoses, used for cleansing (2011, 2012)
• CIP (process stop) validation and optimization. Optimization of cleansing times (2011, 2012) • Reactivation of dairy condensates recirculation system to the boiler (2011, 2012)
• Changes in the compressed air use in the plant (installation of air compressor, refrigerator dryer for compressed air, decrease of working pressure for air compressors) for decreasing electricity consumption (2011, 2012)
• Installation of an Electro Flow for controlling electricity peaks, keeping a constant electric current (2011, 2012) • Installation of velocity drivers in cooling towers (2011, 2012)
Table 6. Results for consumed water for Nestlé analyzed system, powdered milk, milk cream and condensed milk production.
18 3.4. Syngenta (Mamonal production site)
3.4.1. Functional unit and system boundary
The analysis was focused on the annual production of crop protection substances at the Mamonal plant (functional unit). This plant is located in the Department of Bolivar, in a zone with high water stress according to Pfister (WSI = 1).|
3.4.2. Data quality
For this plant the supply chain was modeled using general categories, due to lack of information. Some flows were estimated by mass balance. All industrial waste water is treated by evaporation and a posterior mud technical and controlled incineration, therefore this flow counts as consumed water for the WIIX calculations. Domestic waste water quality was estimated based on literature (Brandes, 1978). Natural gas consumption was excluded from the modeling because lack of data.
3.4.3. Water Impact Index
At the Syngenta Mamonal plant, 99% of total WIIX is associated to the supply chain. Only 1% corresponds to plant operation, which is mainly related to water consumption and water treatments. The overall distribution of the WIIX is shown in Figure 17, and its absolute WIIX results including supply chain and direct water uses are shown in Figure 17, in which the impact associated to the supply chain is remarkable, with a variation along the years because of production’s changes; it gets up to 980.000 m3eqWIIX/ year. The highest WIIX linked to water uses at plant is associated to direct water consumption and pollution, it accounts for 9.997 m3eqWIIX/ year in 2011. The industrial water absolute consumption is an important contribution to the WIIX at the plant; such total consumption is linked to the nature of the industrial waste water treatment, which comprises waste water evaporation followed by mud’s incineration. The domestic uses were assessed assuming effluents with quality standards from literature (Brandes, 1978).
Figure 17. Overview of Water Impact Index for Syngenta’s Mamonal Plant annual production Figure 15. Scheme for Syngenta’s analyzed system
19
3.4.4. Hotspots
Table 7 shows that the highest water footprint is related to the chemical supplies, accounting for between 97.5% and 99.7% of all analyzed impact indicators (between 53% and 57% due to active ingredients). The remaining percentage is mostly related to the indirect water use by electricity consumption, except for the WIIX. Decreasing the water footprint related to the supply chain is seen by the company as a complex and long term process. Although they agree that increasing awareness at the corporate level, about the weight of the supply chain in water use impacts is a first step.
3.4.5. Consumed water
Table 8 and Table 7 shows that 1 ton of Syngenta’s product consumes 185 m3 of water, 2% corresponds to consumptions due to operation of Mamonal Plant; mainly associated to electricity consumption at plant. This should be related to the nature of the processes that take place in Mamonal, mainly mixing raw materials and active ingredients.
Table 8. Results for consumed water for Syngenta’s Mamonal plant.(Average value between 2009 and 2012)
3.4.6. Reduction actions
Main actions for water footprint reduction
• Assessment of water losses during replenishment of the scrubbers (air pollution control devices) (2010, 2011, 2012) • Change in Demister filters in order to decrease evaporation rate (2011, 2012)
• Reinstate in the process part of the water used for equipment cleansing (water containing high concentration of chemical substances) (2011, 2012)
• Changes for more water efficient equipments, particularly toilets (2011, 2012)
20
4.
Main Conclusions and future steps
• For all analyzed companies’ systems main impacts from water use are due to indirect water consumption and water degradation • Excluding supply chain, the WIIX as monitoring indicator is influenced by the indirect water use associated to direct plant operation (due to fuels and electricity consumption). For further studies, it is advised to work on a more downscaled Water Stress Index, in order to reflect the existing variability of water supply and demand, particularly in Colombia.
• The efforts for decreasing the direct water footprint are important and valuable and the actions aimed at this purpose are easier to manage in the short term. In this sense, the implemented actions for the 4 studied companies are focused on energy efficiency, water consumption savings and waste water treatments improvements. Although, it must bear in mind as a mid and long term target to influence the supply chain and further stages within the life cycle of products and services.
• Most of the plants are implementing energy and water saving actions in the frame of their management plans, however, it is advisable to monitor and quantify the impact of these actions. In this context, a regular water footprint assessment could provide information for improvement and further fields of action.
• Communication about water footprint concept with key suppliers could be also an important starting point for better understanding and reducing water footprint in supply chain.
• Raw materials are significant for the water footprint but its prices and availability direct the suppliers’ choice; so this is a field of action with broader incidence on global sustainability production that could be implemented in the future.
• The results of this study, focused on impacts related to water uses, both consumptive and degradative. These results should complement multi-indicator approaches. Making decisions based only on water footprint results could lead to the risk of shifting environmental burdens to other compartments (e.g., soil, air) and impact categories (e.g., global warming, land use and biodiversity, etc.). • The use of environmental studies within a holistic approach allows decision making and business plans development. The companies’ commitment for carrying out studies and impact analysis, make these efforts relevant and useful. This assessment for the four companies is the starting point for evaluating their water footprint; from now on they could reduce impacts and improve their performances. It is advisable to make continuous efforts on improving inventories, especially at the identified hot spots, as well as investments in reduction measures with their respective follow up.
21
5.
Bibliography
Bayart Jean-Baptiste [et al.] A framework for assessing off - stream water in LCA [Journal] // The International Journal of Life Cycle Assessment. - 2010. - pp. 439-453.
Boulay Anne Marie [et al.] LCA Characterization of freshwater use on human health and throug compensation [Journal]. - 2010.
Brandes Marek Characteristics of effuents from gray and black water septic tanks [Publicación periódica] // Journal (Water Pollution Control Federation). - 1978. - págs. 2547-2559.
FAO UN Livestock's Long Shadow, environmental issues and options [Book]. - Rome : [s.n.], 2006.
Frischknecht R. and Jungbluth N. Project "ecoinvent 2000" Overview and Methodology [Report] / ecoinvent centre. - 2007.
Goedkoop M.J. [et al.] ReCiPe 2008, A life cycle impact assessment method which comprises harmonised category indicators at the midpoint and the endpoint level [Online] // Report I: Characterisation. - January 6, 2009. - First edition. - http://www.lcia-recipe.net.
Hanafiah Maria M. [et al.] Characterization factors for water consumption and greenhouse gas emissions based on freshwater fish species extinction [Journal] // Environmental Science & Technology. - Zurich : [s.n.], May 16, 2011. - 12 : Vol. 45. - pp. 5272-5278.
Hoekstra A. J. [et al.] The Water Footprint Assessmente Manual, setting the global standard [Report]. - London Washington, DC : earthscan, 2011. Humbert Sebastien Water footprint in Life Cycle Assessment state of the science and Quantis Method. A Life Cycle Assessment framework to assess impacts of water use.. - Lausanne : Quantis, 2010. - In development. - Contact: [email protected].
IDEAM Instituto de Hidrología, Meteorología y Estudios Ambientales Datos de estaciones hidrometeorológicas [En línea]. - www.ideam.gov.co. ISO 14044:2006 Environmental Management - Life Cycle Assessment - Requirements and Guidelines [book]. - 2006.
ISO/TC 207/SC 5/WG 8 ISO 14046 Water footprint working draft 2. - 2011.
Jolliet Olivier [et al.] IMPACT 2002+: A New Life Cycle Impact Assessment Methodology [Journal] // International Journal of Life Cycle Assessment. - 2003. - 6 : Vol. 8. - pp. 324-330.
Kounina et al. Review of methods addressing freshwater resources in life cycle inventory and impact assessment. [Publicación periódica] // International Journal of life cycle assessment (submitted). - 2011. - Anna Kounina; Manuele Margni; Annette Koehler; Jean-Baptiste Bayart; Anne-Marie Boulay; Markus Berger; Cecile Bulle; Rolf Frischknecht; Llorenc Mila-i-Canals; Masaharu Motoshita; Montserrat Nunez; Gregory Peters; Stephan Pfister.
Legifrance Arrêté du 25 janvier 2010 relatif aux méthodes et critères d'évaluation de l'état écologique, de l'état chimique et du potentiel écologique des eaux de surface pris en application des articles R. 212-10, R. 212-11 et R. 212-18 du code de l'environnement [En línea] / prod. Francaise République. - 2010. - Version consolidée au 12 août 2011. - http://www.legifrance.gouv.fr/affichTexte.do?cidTexte=JORFTEXT000021865356.
Loaiza Y. and Osorio A. Gestión del agua en el sector de la ganadería bovina en la cuenca río La Vieja departamentos de Quindío y Risaralda [Report]. - Pereira – Colombia : Universidad Tecnología de Pereira, 2009.
Maendly R. and Humbert S. Empirical characterization model and factors assessing aquatic biodiversity damages of hydropower water use. [Journal] // Submitted in: International Journal of Life Cycle Assessment. - 2012.
MEED & Agences d l'eau Systeme D'evaluation de la Qualite de L'eau des Curs D'eau [En línea] // Grilles d'évaluation version 2. - 21 de 03 de 2003. - 2012. - http://sierm.eaurmc.fr/eaux-superficielles/fichiers-telechargeables/grilles-seq-eau-v2.pdf.
Nilsson C [et al.] Fragmentation and flow regulation of the world's large river systems [Publicación periódica] // Science. - 2005. - págs. 405-408. Pfister S., Koehler A. and Hellweg Assessing the Environmental Impacts of Freshwater Consumption in LCA [Journal] // Environmental Science & Technology. - 2009. - 11 : Vol. 43. - pp. 4098-4104.
Rosenbaum Ralph [et al.] USEtox—the UNEP-SETAC toxicity model: recommended characterisation factors for human toxicity and freshwater ecotoxicity in life cycle impact assessment [Journal] // Internation Journal of Life Cycle Assessment. - 2008. - http://potency.berkeley.edu/pdfs/Setac.pdf.
Van Zelm R. [et al.] Implementing Groundwater Extraction in Life Cycle Impact Assessment: Characterization Factors Based on Plant Species Richness for the Netherlands [Journal] // Environmental Science & Technology. - January 15, 2011. - 2 : Vol. 45. - pp. 629-35.
Veolia The Water Impact Index and the First Carbon-Water Aanalysis of a Major Metropolitan Water Cycle [En línea] // Veolia Water. - 2011. - 2012. - http://www.veoliawaterna.com/north-america-water/ressources/documents/1/10975,Water_Impact_Index-White_Paper.pdf.
Verones F. [et al.] Characterization factors for thermal pollution in freshwater aquatic environments [Journal] // Environmental Science & Technology. - December 15, 2010. - 24 : Vol. 44. - pp. 9364-9. - http://www.ncbi.nlm.nih.gov/pubmed/21069953.
Yamamoto W., Dewi I. A. and Ibrahim M. Effects of silvopastoral areas on milk production at dual-purpose cattle farms at the semi-humid old agricultural frontier in central Nicaragua [Report]. - Costa Rica : Agricultural Systems, 2007. - pp. 368-375.
22
Contacts
Swiss Agency for Development and Cooperation (SDC) in Colombia Swiss Embassy Cra. 9 No 74-08 8th floor Edificio Profinanzas Bogotá – Colombia Tel- +571 349 72 30 Fax +571 349 71 95
SDC Colombia and Global Program Water Initiative: Diana Rojas Orjuela
Maly Johanna Puerto López Laura Victoria Suárez Murillo Revised by:
Quantis – Samuel Vionnet Version 2.0, August 2013
http://www.cooperacion-suiza.admin.ch/colombia/ http://www.suizaguacolombia.net/