R E S E A R C H
Open Access
Translocation of gold nanoparticles across
the lung epithelial tissue barrier: Combining
in vitro and in silico methods to substitute
in vivo experiments
Gerald Bachler
1,2, Sabrina Losert
1,3, Yuki Umehara
2, Natalie von Goetz
1*, Laura Rodriguez-Lorenzo
2, Alke Petri-Fink
2,
Barbara Rothen-Rutishauser
2and Konrad Hungerbuehler
1Abstract
Background: The lung epithelial tissue barrier represents the main portal for entry of inhaled nanoparticles (NPs) into the systemic circulation. Thus great efforts are currently being made to determine adverse health effects associated with inhalation of NPs. However, to date very little is known about factors that determine the pulmonary translocation of NPs and their subsequent distribution to secondary organs.
Methods: A novel two-step approach to assess the biokinetics of inhaled NPs is presented. In a first step, alveolar epithelial cellular monolayers (CMLs) at the air-liquid interface (ALI) were exposed to aerosolized NPs to determine their translocation kinetics across the epithelial tissue barrier. Then, in a second step, the distribution to secondary organs was predicted with a physiologically based pharmacokinetic (PBPK) model. Monodisperse, spherical, well-characterized, negatively charged gold nanoparticles (AuNP) were used as model NPs. Furthermore, to obtain a comprehensive picture of the translocation kinetics in different species, human (A549) and mouse (MLE-12) alveolar epithelial CMLs were exposed to ionic gold and to various doses (i.e., 25, 50, 100, 150, 200 ng/cm2) and sizes (i.e., 2, 7, 18, 46, 80 nm) of AuNP, and incubated post-exposure for different time periods (i.e., 0, 2, 8, 24, 48, 72 h).
Results: The translocation kinetics of the AuNP across A549 and MLE-12 CMLs was similar. The translocated fraction was (1) inversely proportional to the particle size, and (2) independent of the applied dose (up to 100 ng/cm2). Furthermore, supplementing the A549 CML with two immune cells,i.e., macrophages and dendritic cells, did not significantly change the amount of translocated AuNP. Comparison of the measured translocation kinetics and modeled biodistribution within vivo data from literature showed that the combination of in vitro and in silico methods can accurately predict thein vivo biokinetics of inhaled/instilled AuNP.
Conclusion: Our approach to combinein vitro and in silico methods for assessing the pulmonary translocation and biodistribution of NPs has the potential to replace short-term animal studies which aim to assess the pulmonary absorption and biodistribution of NPs, and to serve as a screening tool to identify NPs of special concern.
Keywords: 3R, A549, Air-liquid interface, ALICE, Inhalation exposure, MLE-12, MLE12, Epithelial cell monolayers, PBPK model, PBTK model
* Correspondence:[email protected]
1
ETH Zürich, Institute for Chemical and Bioengineering, 8093 Zürich, Switzerland
Full list of author information is available at the end of the article
© 2015 Bachler et al. This is an Open Access article distributed under the terms of the Creative Commons Attribution License (http://creativecommons.org/licenses/by/4.0), which permits unrestricted use, distribution, and reproduction in any medium, provided the original work is properly credited. The Creative Commons Public Domain Dedication waiver (http:// creativecommons.org/publicdomain/zero/1.0/) applies to the data made available in this article, unless otherwise stated.
Background
Nanomaterials are increasingly used in industrial and consumer products [1–3], so that potentially workers and consumers are exposed to nanomaterials from vari-ous sources and via different routes. At the workplace, inhalation is considered to be the primary route of ex-posure [4]. Consumers can also be exposed to nanoma-terials via inhalation through the use of spray products [5–7]. After inhalation, the nanomaterials can deposit on the lung surface and be displaced into the aqueous lining layer, where they may then interact with epithelial cells [8, 9]. These cells form one of the first cellular lines of defense against inhaled nanomaterials. In the human body, the most permeable epithelial barrier is located in the deep lung, lining the alveoli [10]. This barrier, called the air-blood barrier, is only 0.1 to 0.2μm thick and con-sists of alveolar epithelial cells type I and surfactant-producing alveolar epithelial cells type II (AT II) [10]. Due to the physiology of the respiratory tract, the alveoli are also the primary region where inhaled particles be-tween 10 and 100 nm can deposit [11]. Thus, great ef-forts have been devoted to determine adverse health effects in the lungs caused by the inhalation of nanopar-ticles (NPs), by bothin vitro and in vivo approaches [10, 12–18]. However, little is known about the systemic ef-fects of inhaled NPs, considering that the alveoli have the most permeable epithelial barrier of all uptake routes, and, inhaled NPs have been shown to reach the systemic circulation [19–26]. Furthermore, the factors that enable and determine the pulmonary translocation and biodistribution of NPs are presently largely unknown.
It has been shown that the size of the deposited parti-cles has a large influence on the translocation of NPs through the air-blood barrier. In rats, the translocation is increasing with decreasing particle diameter for both gold [20, 21] and iridium [23, 24] NPs. Another factor that influences the biokinetic behavior is the surface modification of the respective NPs. However, regarding the direction of this influence the literature is inconsist-ent: While in vivo experiments with rats showed a higher translocation for NPs with anionic surfaces as compared to cationic surfaces [19, 20], the opposite was found in in vitro experiments using primary alveolar cells from mice [27] and rats [28, 29]. Furthermore, the composition of the pulmonary surfactant layer also seems to influence the translocation kinetics of NPs through the air-blood barrier: After instillation of 10 μg surfactant protein D in mice, the translocation of 22 nm gold nanoparticles (AuNP) decreased approximately by a factor of three after two hours of inhalation exposure [30]. Although this decrease was not significantly differ-ent from the control group, the results indicate that the interaction of NPs with proteins in the pulmonary sur-factant layer is an important factor.
However, considering the large variety of NPs with different physicochemical characteristics [4], such as chemical composition, particle size and shape, surface modification, aggregation/agglomeration state and spe-cific surface area, the available studies can only be con-sidered as very first steps towards understanding the biokinetic fate of inhaled NPs at the lung epithelial tissue barrier. Furthermore, apart from ethical considerations, considerable technical and financial effort would be ne-cessary to investigate every single type of NP in vivo [31], hence highlighting the necessity for alternative methods to determine the toxicokinetics of inhaled NPs.
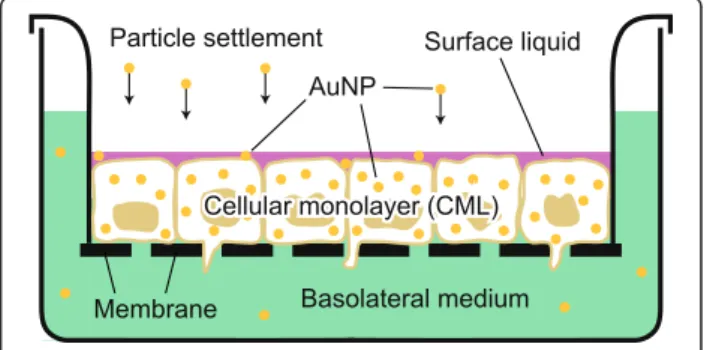
In this study, we present a novel two-step approach to assess the biokinetics of inhaled NPs without the use of animal experiments, by combining in vitro with in silico methods. To this end, first, the translocation kinetics of AuNP across the lung epithelial tissue barrier was deter-mined with alveolar epithelial cellular monolayers (CMLs) at the air-liquid interface (ALI) (Fig. 1). Then, in a second step, their biodistribution to secondary organs was predicted with a physiologically based pharmacoki-netic (PBPK) model (Fig. 2). The predictive capability of this approach was evaluated by comparison to available in vivo data from the literature [20, 30]. Furthermore, in order to investigate different parameters that influence the pulmonary absorption kinetics, the translocation of AuNP was determined at various time points post-exposure (i.e., 0, 2, 8, 24, 48, 72 h), for different post-exposure doses (i.e., 25, 50, 100, 150, 200 ng/cm2
) and for differ-ent particle sizes (i.e., 2, 7, 18, 46, 80 nm). For compari-son also ionic gold was tested.
The CMLs were exposed to AuNP using the air-liquid interface cell exposure (ALICE) system [32]. With the ALICE system, cells at the ALI can directly be exposed to an NP aerosol, which is an effective way to mimic inhalation exposure [12, 13, 32]. Adenocarcinomic human
Fig. 1 Transwell chamber system that was used to culture and expose the A549 and MLE-12 CMLs. The displayed graphic shows the CMLs at the ALI (24 h after the apical medium was removed and the surface liquid was produced by the cells) and during/shortly after exposure using the ALICE, when the particles settle down and distribute between the individual compartments (surface liquid, cellular monolayer and basolateral medium). Insert surface area: 0.9 cm2. Membrane pore size: 3μm
(A549) and transgenic mouse (MLE-12) epithelial cells were used as CMLs. Both cell types show functional characteristics of AT II epithelial cells, including the de-velopment of a surfactant layer [33, 34]. The production of a protein-containing surfactant layer was considered crucial to model the surfactant protein attachment to the surface of the NPs. This surfactant protein-NP inter-action may largely influence the biological properties of NPs [35–37] and has been described to be indispensable forin vitro studies modeling the lung [38].
To simulate the biodistribution of AuNP we adapted our recently presented PBPK model for titanium dioxide (TiO2) NPs [39]. The PBPK model was used in two
dif-ferent ways in this study: (1) to simulate the biodistribu-tion of AuNP that translocate from the lung to the blood and (2) to update the time-dependent pulmonary translocation kinetics measured in animal studies [20, 30], which were compared to ourin vitro data. The latter
was necessary, because in animal studies it is not possible to distinguish mucociliary-cleared from biliary-cleared AuNP in the gastrointestinal tract (GIT) and the feces.
Results
AuNP characterization
The physicochemical parameters of the AuNP used are summarized in Table 1 (more details are given in Additional file 1). The particles which were produced cover the whole nano-range (1–100 nm [40]) and are highly stable: the nebulization in the ALICE does not alter the size of the AuNP, and we did not determine a considerable amount of gold below 30 kDa in the basolateral medium 24 h after the exposure in the ALICE, hence the dissolution of particles in the trans-well chamber system is insignificant. The relatively high fraction of gold below 30 kDa for the 2 nm parti-cles (8.8 %, Table 1) may be attributed to the particle size distribution of these very small NPs, which in-cludes significant amounts of particles smaller than 30 kDa (30 kDa corresponds to an uncoated AuNP with a size of approximately 1.7 nm. However, the ac-tual cut-off size is probably even lower, due to coating effects in the medium).
CML characterization
Laser scanning microscopy (LSM) images of A549 and MLE-12 CMLs after 24 h at the ALI and 24 h post-exposure are depicted in Fig. 3a-d (LSM images 48 and 72 h post-exposure are provided in Additional file 1). In the displayed orthogonal view, the confluent cellular
Fig. 2 Schematic diagram of the AuNP PBPK model. Dashed lines symbolize the translocation of AuNP through the kidneys and liver to the urine and feces, respectively, and the translocation of AuNP across the lung epithelial tissue barrier (*). Adapted from [39]
Table 1 Physicochemical parameters of the AuNP before and after ALICE exposure
AuNP diametera 2 nm 7 nm 18 nm 46 nm 80 nm
In suspension before ALICE exposure
UV–Vis: Maximum absorption curveb[nm] No LSPRhband 512 521 529 549
UV–Vis: Diameterc[nm] 1-2 6-7 16-18 46 80
DLS: Hydrodynamic diameter [nm] n.d.i n.d.i 20.2 52.4 80.4
DLS: Polydispersity [%] n.d.i n.d.i 6.2 9.7 13.1
Surface functionalization Citrate-THPCj Citrate Citrate Citrate Citrate
ζ-potentiald[mV]
−12.3 ± 0.9 −50.9 ± 1.3 −31.7 ± 1.5 −32.4 ± 1.5 −27.5 ± 2.3
After ALICE exposure
TEM: Particle diametere[nm] 2.5 ± 1.2k 6.5 ± 2.3 19.6 ± 4.2 49.1 ± 10.7 85.5 ± 14.2
TEM: Circularityf[−] 0.46 ± 0.13 0.60 ± 0.20 0.77 ± 0.13 0.88 ± 0.05 0.86 ± 0.10
Fraction of gold below 30 kDa in the basolateral mediumg[%]
8.80 ± 0.34 0.52 ± 0.16 <LODl <LODl <LODl
a
AuNPs were ordered by size according to the UV–Vis measurements
b
the complete UV–Vis spectrum can be found in Additional file1(Figure S1)
c
determined as described in Haiss et al. [72] (see Methods)
d
average zeta potential ± standard deviation (SD)
e
average diameter ± SD as measured by TEM (n = 161 to 259). Histograms showing the complete particle size distribution can be found in Additional file1(Figure S2)
f
0 corresponds to an infinitely elongated polygon; 1 corresponds to a perfect circle
g
determined with an A529 CML 24 h after exposure to 100 ng/cm2
AuNP. Mean fraction ± SD (n = 3)
h
LSPR: localized surface plasmon resonance
i
not detected (size below the LOD of the instrument)
j
THPC: tetrakis (hydroxymethyl) phosphonium chloride
k
left tail of the size distribution partly below the limit of detection (<0.9 nm). Hence, mean diameter was probably slightly overestimated; see also Additional file1 l
monolayer grown on the membranes can be seen. For both cell types, the CML was well-developed on the en-tire membrane surface.
The measured surface liquid height on the MLE-12 cells was 68 ± 14μm (mean ± SD) after 24 h at the ALI. The surface liquid height for the A549 CML was below 10μm (limit of detection; LOD). Hence, the total surface liquid height on MLE-12 CMLs is approximately four times higher than on A549 CMLs, when the 14 μm li-quid film that is formed after nebulization of the AuNP suspension in the ALICE is also considered [32].
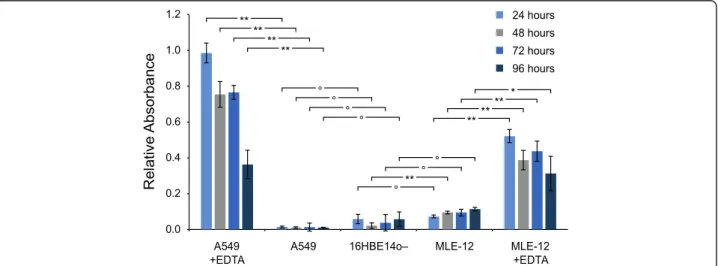
The integrity of the CMLs was evaluated by assessing the permeability to Blue Dextran. The results are depicted in Fig. 4. In brief, 16HBE14o- CMLs were used as reference control due to their known ability to form a tight barrier [41]. As positive control, the CMLs were additionally exposed to ethylenediaminetetraacetic acid (EDTA), which causes the detachment of the CML from
the membrane [42] and, hence, increases the transloca-tion of Blue Dextran. Compared to 16HBE14o- CMLs, the permeability of the A549 CML is marginally lower and of MLE-12 CMLs slightly higher at all time points at the ALI (24 to 96 h). However, a significantly in-creased translocation through MLE-12 CMLs can only be observed after 48 h at the ALI (p < 0.01). A detailed discussion on the permeability to Blue Dextran and the time course of the transepithelial electrical resistance (TEER) is provided in Additional file 1.
Translocation kinetics
The influence of dose, size and incubation time on the translocation kinetics of AuNP was assessed in order to get a comprehensive picture of the translocation kinetics of NPs across the epithelial tissue barrier (Fig. 5). The translocation fraction was defined as the fraction of AuNP that translocated from the surface liquid through
Fig. 3 LSM images of cytoskeletal F-actin (green) and the cell nuclei (grey). Orthogonal view of the A549 CML after (a) 24 and (b) 48 h, and of the MLE-12 CML after (c) 24 and (d) 48 h at the ALI. (b, d) After 24 h at the ALI the CML were exposed to 100 ng/cm2of 18 nm large AuNP. Within the blue circle the top view on the CML is depicted
Fig. 4 Integrity assessment of A549 and MLE-12 CMLs by Blue Dextran assay. The translocation of Blue Dextran (2000 kDa) through the CMLs after various time points at the ALI. (data are expressed as mean ± SD, n = 3 CMLs;┌─┐indicates the significance level between two measurements, ° no significant difference, significant difference: *p < 0.05, ** p < 0.01)
the CML to the basolateral medium up to a certain time point post-exposure (Fig. 1).
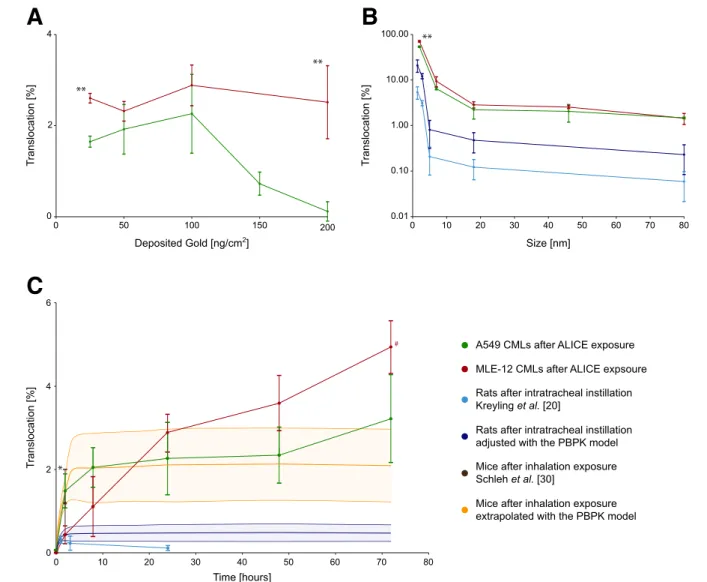
In Fig. 5a, the translocation kinetics of AuNP through A549 and MLE-12 CMLs are shown for different doses. Both cell types have a similar translocation fraction of around 2 %, which is independent of the applied dose up to 100 ng/cm2, however, above this dose the translocation fraction in A549 CMLs decreases significantly. These dose-independent translocation kinetics up to 100 ng/cm2 make it possible to compare the translocation fractions of CMLs (obtained at 25–100 ng/cm2) to in vivo data from
literature (obtained at 0.2-8.63 ng/cm2lung surface area, see Additional file 1: Table S1) [20, 30].
In Fig. 5b, the translocation kinetics of AuNP through A549 and MLE-12 CMLs are shown for different par-ticle sizes. Also here, the translocation fractions are al-most identical for A549 and MLE-12 CMLs 24 h post-exposure, respectively. A significant difference in the translocation fraction was only observed for 2 nm AuNP, with a significantly higher translocation in mur-ine cells when compared to human cells. The most im-portant outcome, however, is that the size-dependent
Fig. 5 Translocation kinetics of AuNP through A549 and MLE-12 CMLs. (a) Translocation fraction of 18 nm AuNP after 24 h for different doses. (b) Translocation fraction 24 h after exposure to 100 ng/cm2AuNP for different sizes. (c) Translocation fraction of 18 nm AuNP at a dose of 100 ng/cm2after different times post-exposure. Thein vitro results were compared to in vivo data from Kreyling et al. [20] and Schleh et al. [30]. Kreylinget al. determined the translocation fraction of AuNP of various sizes after 24 h (b) and of 18 nm AuNP after various time points (c) in female Wistar-Kyoto rats after intratracheal instillation. Schlehet al. determined the translocation fraction of 20 nm large AuNP in female C57BL/6 mice following two hours of inhalation exposure (c). (detailed information on properties and dose of the AuNP used in thein vivo studies may be found in Additional file 1 (Table S1); data are expressed as mean ± SD,n = 3 (CMLs,#n = 2), n = 4 (rats/mice) and the yellow and blue areas show the uncertainty range using Monte Carlo analysis (PBPK model,n = 1000 iterations); significant differences between A549 and MLE-12 CMLs: *p < 0.05, ** p < 0.01)
translocation fraction is inversely proportional to the particle size and, although approximately one order of magnitude higher, changes almost in parallel in the in vitro measurements with the in vivo measurements by Kreylinget al. [20].
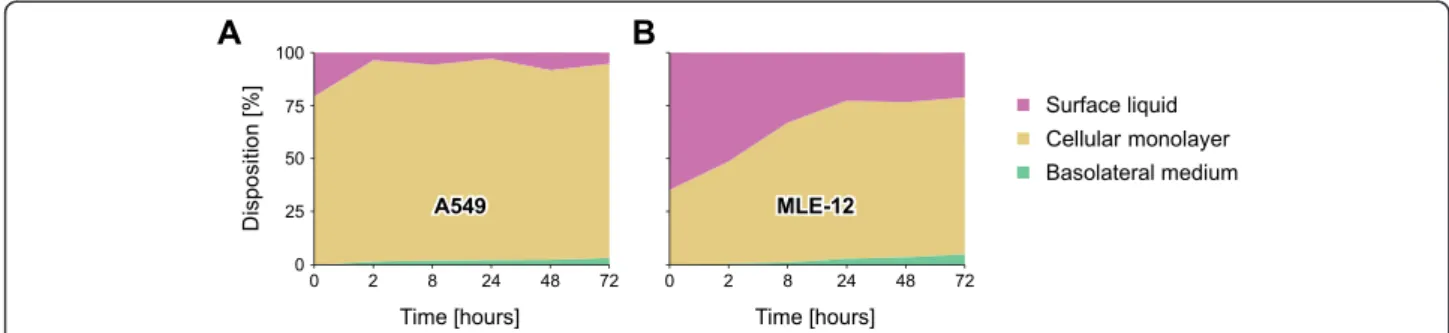
In Fig. 5c, the translocation kinetics of AuNP through A549 and MLE-12 CMLs are shown for different time points post-exposure. For both cell types, a sharp in-crease in the translocation fraction can be observed dur-ing the first couple of hours, followed by a sharp flattening between 8 and 24 h post-exposure. Between 24 and 72 h post-exposure the amount of translocated AuNP is only increasing slowly. This change in the translocation kinetics 24 h post-exposure may be an in-dication that the AuNP follow different pathways through the CMLs. The only significant difference be-tween the translocation kinetics of the two cell lines is the much higher translocation fraction that can be ob-served in A549 CMLs two hours post-exposure. The same sharp rise in A549 CMLs within the first two hours post-exposure can also be seen in vivo for the PBPK-adjusted translocation fractions based on Kreyling et al. [20] and in the study by Schleh et al. [30]. The slower rise in the translocation fraction within the first couple of hours post-exposure in MLE-12 CMLs (i.e., the fraction of AuNP in the basolateral medium) is dir-ectly related to the slower clearance of AuNP from the surface liquid (Fig. 6a-b).
For comparison, we evaluated the translocation of ionic gold through the CMLs and compared the results to in vivo data for ionic gold from Kreyling et al. [20] (Fig. 7a). No significant difference in the translocation between any of the in vitro experiments and the bound-ary levels for the in vivo studies was observed (Fig. 7a). In all depicted cases, the translocation fraction of ionic gold was around 75 %, which is very close to the trans-location fraction that was observed for 2 nm AuNP (A549: 54.2 ± 1.4 %; MLE-12: 71.0 ± 2.8 %; mean ± SD).
Finally, considering that a CML is a very simplified cellular model of the lung epithelial tissue barrier, we also compared the translocation kinetics of 18 nm AuNP
through A549 CML with a more sophisticated triple cell co-culture (TCCC) system. In a TCCC system, macro-phages and dendritic cells occupying the apical and basal side of the alveolar epithelium, respectively, are also con-tained in the cellular model [43]. As can be seen in Fig. 7b, there is no significant difference between the translocation of AuNP through the CML and the TCCC system, hence, a CML is sufficient to model the trans-location of the investigated AuNP through a cellular rep-resentation of the air-blood barrier.
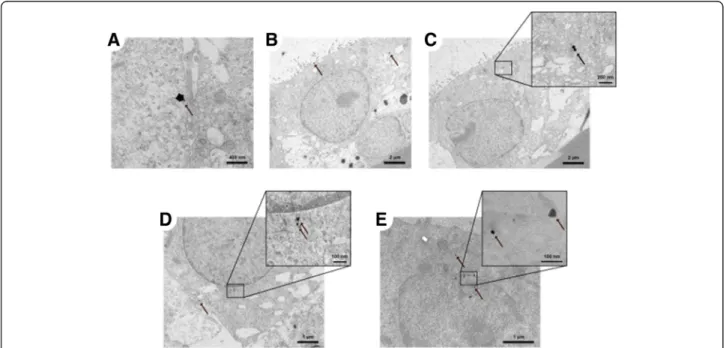
Transmission electron microscopy (TEM) images of the A549 CML 24 h after exposure to 18 nm AuNP are depicted in Fig. 8a-e. As can be seen, the particles are mainly present as single particles or as small ates, consisting of only a few particles. Larger agglomer-ates, such as in Fig. 8a, were only observed sporadically. Particularly interesting is that the particles and agglom-erates were freely distributed within the cytoplasm (Fig. 8b-d) and are also observed close to the cell nu-cleus (Fig. 8e). Particles in vesicles were not observed. TEM images for the 2, 7 and 46 nm AuNP can be found in Additional file 1. In brief, the 7 and 46 nm large parti-cles showed the same distribution pattern as the 18 nm AuNP (Additional file 1: Figure S7). The 2 nm AuNP could not be distinguished from the background, even though we prepared samples without lead citrate and ur-anyl acetate staining. For 2 nm AuNP only one single agglomerate was detected (Additional file 1: Figure S7).
PBPK modeling
As mentioned above, it was not possible to unambigu-ously allocate the AuNP recovered in the feces in the animal experiments to the two pathways biliary excre-tion of AuNP (with translocaexcre-tion) and mucociliary clear-ance of AuNP (without translocation) [20, 30] that were compared to our CMLs set-up. Hence,in vivo the trans-location fractions were calculated based solely on the re-covered gold from secondary organs, making it difficult to compare the in vivo data to the in vitro results pre-sented in this paper. One way to overcome this problem is PBPK modeling, which makes it possible to account
Fig. 6 Disposition of 18 nm large AuNP in the transwell chamber system. (a) A549 and (b) MLE-12 CMLs after various time points at an exposure dose of 100 ng/cm2. The results of the translocated fraction (green areas) are presented in more detail in Fig. 5
for the biliary excretion of NPs in vivo and adjust ac-cordingly the measured translocation fraction to yield the total translocation of NPs from the lung to the blood circulation.
In Fig. 5c, the adjusted translocation fractions for the data of Kreyling et al. [20] are depicted up to 72 h after intratracheal instillation of 18 nm AuNP in rats. The ad-justed curve shows a sharp increase in the translocation fraction during the first two hours post-exposure, which
is in good agreement with the translocation kinetics in A549 CMLs. Steady state is reached approximately three hours after exposure. In total, the adjusted trans-location fraction is 3.9 times higher than the one originally measured in vivo 24 h post-exposure. Unfortunately, in vivo the translocation was only assessed up to 24 h post-exposure, so it is not possible to confirm the biphasic translocation kinetics observed in vitro with in vivo data.
T
ranslocation [%] Translocation [%]
Fig. 7 Translocation of (a) ionic gold and (b) AuNP for two cell models of different complexity. (a) Comparison of the translocation fraction of ionic gold after 24 h: CMLs treated with 100 ng/cm2gold were compared to
in vivo data from Kreyling et al. [20], who determined the biodistribution in female Wistar-Kyoto rats after intratracheal instillation (1μg gold). Two extreme scenarios are presented for the translocation fraction from Kreylinget al. For the lower bound, we assumed that all of the gold that was recovered from the GIT and feces had not been translocated, but instead had been cleared via the mucociliary pathway directly from the lungs to the GIT. For the upper bound, we assumed that all of the gold in the GIT and the feces was first taken up and then cleared via the biliary pathway to the GIT. (b) Comparison of the translocation fraction of 18 nm large particles in an A549 CML and a TCCC system 24 h after exposure to 100 ng/cm2AuNP. (data are expressed as mean ± SD,
n = 3 (CML/TCCC) andn = 4 (rats))
Fig. 8 TEM images of intracellular particles in the A549 CML. (a) Agglomerates, (b, c) small agglomerates and (d) single particles in the cytoplasm and (e) particles next to the cell nucleus 24 h after exposure to 100 ng/cm218 nm AuNP in the ALICE system. In (b) and (c) the surface of the monolayer (top left) and the PET membrane on which the CML were grown (bottom right) can be seen. The arrows are pointing towards the particles. (e: without lead citrate and uranyl acetate staining)
In Fig. 5c, the translocation fraction in mice after 2 h of inhalation exposure from Schlehet al. [30] is also il-lustrated. As can be seen, thein vivo translocation frac-tion is in agreement with the translocafrac-tion fracfrac-tions measured in A549 and MLE-12 CMLs 2 h post-exposure. With the PBPK model it was further possible to determine the complete time course of the transloca-tion by fitting the translocatransloca-tion rate in the PBPK model to the translocation fraction reported by Schleh et al. [30]. The obtained time course is in good agreement with the in vitro data of both cell types (Fig. 5c). The measured translocation time course of the A549 CML and the extrapolated translocation time course in mice are practically identical, whereas MLE-12 differs during the first 8 h post-exposure.
Finally, the 24 h post-exposure translocation fractions of the 1.4, 2.8, 5 and 80 nm large AuNP were adjusted by the same factor that was determined for the 18 nm large AuNP with the PBPK model (Fig. 5b). These ad-justed translocation fractions were further used to fit the translocation rates and to simulate the biodistribution of the AuNP with the PBPK model (Fig. 9; Note that the 18 nm data set cannot be considered independent, be-cause it was already used to add the inhalation/instillation pathway to the PBPK model and adjust the translocation fractions of the other particle sizes). Although the biodis-tribution is modeled size-independently in the PBPK
model, all predicted organ and urine gold levels of all par-ticle sizes fell close to the 1:1 line. Sole exceptions were the kidneys’ and urine gold levels for the 1.4 nm and 2.8 nm AuNP, which were underestimated by the PBPK model.
Discussion
AuNP characterization
AuNP were used as model NPs due to their low toxicity [44–46], high stability under biologically relevant condi-tions [20, 45], high electron density and the availability of good quality in vivo studies [20, 30], which were used to evaluate the predictive capability of our in vitro and in silico results. Furthermore, to minimize the influence of the coating on the translocation kinetics, the AuNP were stabilized with citrate. Citrate is known to be easily replaced by proteins in biological media [47, 48] such as the surface liquid lining the CML and, thus, allows the particles to quickly form a protein corona.
Choice of cell types
In contrast to primary cells, cell lines are often pre-ferred due to the easy and reproducible use of cell cul-tures as well as the purity of cell types. MLE-12 and A549 cells were used, which are mouse and human al-veolar type II like cell lines [33, 49], respectively, that are well characterized and widely used asin vitro lung
Fig. 9 Comparison of the PBPK model to biokinetic data from female Wistar-Kyoto rats [20] 24 h after intratracheal instillation of various sizes of AuNP. (only organs where the gold levels in all rats were above the LOD are depicted; data are expressed as mean ± SD,n = 4 (rats) and n = 1000 iterations (PBPK model), *unit for urine: % dose)
epithelial cell models. The advantage of those two cell types is the production of surfactant [33, 34], however, their relevance to study NP translocation is often ques-tioned [50], because the expression of tight junction proteins is not as pronounced as in other cell lines or primary cells. The two cell lines used in the current study were grown under controlled culture conditions revealing a confluent and dense monolayer also when cultured at the ALI as shown by the Dextran Blue trans-location assay as well as by LSM images of the spatial cell morphology. Especially at the ALI the cells show a denser monolayer compared to cells cultured in suspension [51]. We also did not observe any NPs between cells, but al-ways inside cells. Therefore their use to study the trans-location of the here applied AuNPs seems to be justifiable. Other cell lines such as the recently immortalized type II cells that exhibit a type I like phenotype described by Kemp and colleagues [52] or primary cells derived from mice or human lung biopsies could, however, be consid-ered in future studies.
Translocation kinetics
The determined translocation kinetics of AuNP through A549 and MLE-12 CMLs are in good agreement with kinetic data for AuNP in mice [30] and rats [20]in vivo. This is particularly true for the size-dependent transloca-tion kinetics, where the in vivo and in vitro curves are almost parallel (Fig. 5b). Hence, exposing CMLs to NPs in the ALICE system probably is an adequate model to describe the translocation of NPs through the air-blood barrier after short-term exposure. Further, there are four notable observations that shall be discussed in more de-tail below, namely, (1) the significantly different trans-location fractions between A549 and MLE-12 CMLs two hours after exposure in the ALICE system, (2) the sharp decrease in the translocation efficiency of AuNP through A549 CMLs at doses above 100 ng/cm2, (3) the higher translocation fractions determined with the CMLs in the ALICE system as compared to intratracheally instilled AuNP in rats, and (4) the trend that the smaller the AuNP become, the more their translocation kinetics converge to the translocation kinetics of ionic gold.
The first two observations are probably related to the different surface liquid heights between A549 and MLE-12 CMLs. While the surface liquid height observed for A549 CMLs is in good agreement with the height of 4.5 ± 0.7 μm (mean ± SD) that was reported previously for primary human AT II cells [53], the observed surface liquid height for MLE-12 CMLs is approximately four times higher than measurements of Thompson et al. [54] for primary rodent AT II cells (15 μm). This un-physiologically high surface liquid height has a threefold influence on the interaction between the NPs and the cells [55, 56]. First, it prolongs the time that the particles
need to sediment to the surface of the cells. Second, it decreases the concentration gradient between the sur-face liquid and the basolateral medium. Third, it affects the likelihood for NPs to form agglomerates. In our ex-periments, an increased sedimentation time and/or de-creased concentration gradient is most likely responsible for the significantly slower clearance of AuNP from the surface liquid and consequently a lower translocation fraction in MLE-12 CMLs as compared to A549 CMLs two hours post-exposure. After the first two hours, the translocation kinetics of both cell types are comparable with each other, implying that it takes 2 h until the AuNP get into contact with the MLE-12 CML due to the unphysiologically high surface liquid height. Further-more, the pattern for the translocation kinetics of AuNP at different doses seems also to be related to the height of the surface liquid, such that while the translocation fraction in MLE-12 CMLs is the same up to the max-imum investigated dose of 200 ng/cm2, there is a sharp decrease of the translocation fraction in A549 CMLs above a dose of 100 ng/cm2. A reason for this behavior may be the higher particle concentration in the surface liquid of A549 CMLs and hence a higher likelihood of ag-glomeration at high doses. For example, Brandenberger et al. [12] observed a larger amount of agglomerates in A549 cells after exposure to 561 ng/cm2AuNP (15 nm, citrate-coated) in the ALICE system as compared to 61 ng/cm2of the same particles. Also, as shown in our ex-periments, the translocation efficiency is decreasing with increasing particle diameter, which can be explained by the size of the corona around the NPs, which changes in the presence of biological fluids (e.g., lung liquid lining layer), or by the formation of agglomerates. This observa-tion clearly highlights the importance of experimental in vitro set-ups that properly mimic the deposition of NPs in the lung, such as the ALICE system, and illustrates that unphysiological experimental conditions, such as sub-mersed cultures, may bias the translocation kinetics of NPs. In the present study we have observed single 18 nm sized AuNP free in the cytoplasm, which is in agreement with the study from Brandenbergeret al. [12] who applied a quantitative approach with TEM and found citrate-stabilized AuNP of a similar size in the cytoplasm. How-ever, the cytoplasm was not the preferred compartment and the majority of the particles were found in vesicles.
The third important observation from ourin vitro ex-periments is that the translocation of AuNP across the air-blood barrier of rats after intratracheal instillation is overestimated by the CMLs, even though the transloca-tion of AuNP across the air-blood barrier of mice after inhalation exposure is well reflected by the CMLs. In our opinion, this difference is not primarily linked to the species used,i.e., mouse and rat, because our in vitro ex-periments show that the translocation kinetics of AuNP
are very similar between human and murine cells, imply-ing that there is no species-specific mechanism for the investigated AuNP. However, there are two factors that have been reported before to influence the distribution of particles in the lung and the pulmonary absorption of these particles. Factor 1: the method of delivery may greatly determine the distribution of particles in the lung. After inhalation, the particles are usually much more uniformly distributed within the lung as compared to intratracheal instillation [57]. Hence, after intratra-cheal instillation there might be regions in the lung with relatively high particle densities, which may, as described above, increase the likelihood of agglomeration and con-sequently decrease the translocation of particles across the air-blood barrier. Factor 2: the surface modification of NPs may greatly influence the translocation of depos-ited NPs across the air-blood barrier [19, 20, 27–29]. In fact, in thein vitro and in vivo experiments discussed in this work, different surface modifications have been used. Schleh et al. [30] used unmodified AuNP (pro-duced by a spark ignition generator), Kreylinget al. [20] used sulfonated-triphenylphosphine-modified (1.4, 5, 18 and 80 nm) and thioglycolic-acid-modified (2.8 nm) AuNP and we used citrate-modified AuNP. Although the zeta potential is similar among all types of AuNP, different surface modifications may lead to different types of protein coronas. The protein corona largely de-termines the biological properties of the NPs [35–37] and, thus, has the potential to directly influence the translocation kinetics. These considerations further ex-plain the good agreement between our in vitro results and the data from Schleh et al. [30], since citrate can easily be replaced by proteins [47, 48] and, thus, it is not surprising that citrate-modified AuNP behave similar to unmodified AuNP. However, to fully understand the in-fluence of the surface modification of NPs on the protein corona and translocation kinetics across the air-blood barrier more research is necessary.
The fourth, particularly interesting observation is that the smaller the AuNP are, the more their translocation kinetics are similar to the translocation kinetics of ionic gold. The determination of the translocation pathways across the CMLs was not within the focus of this work, but the results suggest that very small NPs follow similar or even the same pathways as ionic gold. So far, several pathways have been described for different types of NPs and different surface modifications, but these findings are not substantial and consistent enough to link particle properties to specific pathways. Yacobi and colleagues [28, 29] used rat alveolar epithelial cell monolayers to in-vestigate the translocation of polystyrene NPs at differ-ent sizes (20 and 100 nm) and negative (carboxylate-modified, sulfate-modified or aldehyde-sulfate-modified) and positive (amidine-modified) surface charges. The
authors came to the conclusion that the NPs primarily follow transcellular pathways to traffic across the CML and that the translocation takes place via diffusion. On the contrary, for the same types of polystyrene NPs, dif-ferent pathways have been proposed for mouse alveolar epithelial cell monolayers [27]. While polystyrene NPs with a positive surface charge mainly crossed the CML via transcellular pathways, which involved clathrin- and dynamin-dependent endocytosis, polystyrene NPs with a negative surface charge followed paracellular and non-endocytic transcellular pathways. In addition, for quantum dots (negative surface charges, hydrodynamic diameter 25 nm) it was reported that they use para- and transcellu-lar pathways to cross rat alveotranscellu-lar epithelial cell monolayers [58]. Hence, the data indicates that the translocation does not take place via endocytic pathways (i.e., caveolin-, clathrin- and dynamin-mediated).
However, since all of these studies were carried out with submerged cultures, the results cannot directly be compared to our translocation data obtained at the ALI. Still, a trend towards para- and transcellular diffusion is apparent for negatively charged NPs. This trend is also reflected in three ways in our data. First, the AuNP can mainly be observed freely distributed in the cytoplasm and not in vesicles. Second, the similar translocation kinetics of A549 and MLE-12 CMLs, and the good agreement between thein vitro and in vivo data indicate that endocytic pathways, which may differ between spe-cies, do not play an important role. Third, the transloca-tion fractransloca-tion was similar in an A549 CML and a TCCC model, which also suggests a minor role of endocytic pathways. Therefore, these results highlight that expos-ure of CLMs at the ALI to NPs in the ALICE system is a promising fast and cheap method to investigate the translocation pathways of NPs across the lung epithelial tissue barrier in more detail in the future. However, what yet needs to be demonstrated with the presented model is the capability to predict the translocation kinetics of other types of NPs, e.g., those with positive surface charge, and of agglomerates, for which the usage of endocytic pathways across the lung epithelial tissue bar-rier has been reported before [27, 59]. To enable this, also more of reliablein vivo data are needed.
PBPK modeling
The disposition of AuNP in rats could successfully be predicted with the PBPK model by using the permeabil-ity of the different capillary wall types as a basis to model the biodistribution of the NPs. Interestingly, the same distribution and excretion rates as in our recently presented PBPK model for TiO2NPs [39] could be used,
which demonstrates that the biokinetics of both particle types are very similar in vivo. Solely, the translocation rate from the organs to the blood had to be slightly
increased for AuNP as compared to TiO2NPs. The
rea-son for this difference is unknown, but since we could already show that the size and surface modification have a minor influence on the biodistribution of NPs [39, 60], this difference might be simply related to the chemical properties or to the concentration gradient between the organs and the blood. However, since we could already successfully model the biodistribution of AuNP, TiO2
NPs [39], silver NPs [60] and silicon dioxide NPs (un-published data) with the same model structure by simply varying the retention time of the particles in the organs, this parameter may warrant further research.
Several observations that were made by Kreyling et al. [20] on the biokinetics of AuNPs had already been sug-gested by earlier studies with our PBPK model [39, 60] and, thus, further confirm its validity. For instance, after intratracheal instillation of negatively and positively charged 2.8 nm AuNP in rats, the same biodistribution resulted [20]. This behavior was also predicted with the PBPK model. For silver NPs, it was possible to model the biodistribution of polyvinylpyrrolidone (PVP) and carboxymethyl cellulose coated and uncoated particles, without considering the surface conditions in the model [60]. Also, the size-independent biodistribution of AuNP in vivo [20] was already observed with the PBPK model for silver NPs [60]. However, the size-independent distri-bution holds only true for low internal doses of NPs in the PBPK model. At high internal doses, the uptake of NPs by compartments of the mononuclear phagocytic system, located in the liver, lungs and spleen [61], also need to be considered in the model [39, 60]. This in-creased distribution of NPs to the liver, lungs and spleen seems to be dose- [62] and at high internal doses also size-dependent [63] and can also be seen in vivo for AuNP [64]. The reason for the different distribution pat-terns observed for low and high internal doses remains unknown, but as we have speculated before on the basis of the results of the PBPK model this might be related either to agglomeration or to a substantial alteration of the protein corona due to a deficit of specific proteins at high levels of NPs in the blood [39, 60].
Interestingly, the PBPK model could also be used to model the biodistribution of AuNP that were smaller than 15 nm, even though 15 nm had been previously de-fined as the lower size limit of the model [60]. This limit was based on the 6 to 15 nm capillary pore sizes of the kidneys [65]. Below this size limit it was hypothesized that NPs can translocate through the pores of the capil-lary walls of the kidneys [39, 60] and, thus, very small NPs are much easier transported to the kidneys and ex-creted in urine [64, 66]. This behavior explains also the underestimation of the in vivo kidneys’ and urine gold levels [20] of the 1.4 nm and 2.8 nm AuNP by the PBPK model. However, for the 5 nm AuNP this behavior
cannot be observed. This discrepancy can most likely be attributed to the formation of a protein corona, which increases the diameterin vivo. In fact, the reported crit-ical diameter for an increased excretion of NPs in urine was reported to be around 5 nm [64, 66] and, thus, con-siderably below 15 nm. Nevertheless, apart from kidneys’ and urine gold levels of 1.4 nm and 2.8 nm AuNP, the gold levels of all other organs could be predicted by the PBPK model after intratracheal instillation of AuNP in rats [20]. This shows that the model is in fact applicable for NPs below 15 nm, but the levels in the kidneys and the urine may be underestimated.
In the study of Kreyling et al. [20], the translocation through the air-blood barrier was also investigated for one particle size above the nano-range (200 nm). The maximum particle size that can be described by the model is 150 nm [60], and is based on the pore size of the liver capillaries [65]. Hence, we have not included particles above the nano-range in our experiments. Par-ticles above this size limit may have difficulties passing through the pores of the capillary wall of the liver and, thus, it can be expected that they are hardly excreted via the biliary pathway. In fact, this size threshold for the biliary excretion of particles was already shown before for intravenously injected AuNP in rats [64] and if this as-sumption is considered in the PBPK model, the organ gold levels of 200 nm large gold particles [20] can be predicted well by the PBPK model (Additional file 1: Figure S11 and S12). Based on these considerations, the comparably high translocation of 200 nm AuNP through the air-blood bar-rier that was reported by Kreylinget al. [20], may simply be related to a decreased excretion efficiency and, thus, a higher retention time for 200 nm large particles in the body of the rat.
Conclusion
Our work shows howin vitro results obtained by CMLs at the ALI can be combined with PBPK modeling to as-sess the biokinetics of inhaled NPs. The time- and size-dependent translocation of AuNP across the air-blood barrier in animals is in good agreement with the results obtained with the CMLs. The translocation kinetics are well predicted for mice after inhalation exposure, whereas for rats after intratracheal instillation, the trans-location is slightly overestimated, which might be related to the method of delivery or to the fact that different surface modifications were used as compared to the in vitro experiments. However, the very same variation with size can be observed in thein vitro and in vivo data. At exposure doses in the range of realistic exposures (e.g., occupational exposure to 3 mg/m3TiO2 NPs [67]
for a day), a dose-independent translocation of AuNP across the CML can be observed. In addition, it was pos-sible to demonstrate that there is hardly any difference
between murine and human AT II epithelial cell lines, indicating that pulmonary absorption does not differ be-tween rodents and humans for the AuNP used (provided that the NPs reach the same regions of the lung). The smaller the NPs were, the more similar to ionic gold was their disposition in the transwell chamber system. This shows that very small NPs can cross the CML as easily as ionic gold and, thus, indicates that they follow similar or even the same pathways across the blood-air barrier.
The biodistribution of AuNP could successfully be de-scribed with a PBPK model that was originally developed for TiO2NPs, and which used similar assumptions as a
PBPK model for silver NPs. This raises the question of whether the biokinetics of inorganic NPs is generally very similarin vivo. Also for AuNP, the biodistribution is governed by the permeability of the different capillary wall types. Several predictions regarding the biodistribu-tion of NPs that were based on the PBPK model are fur-ther supported by the data from Kreyling et al. [20]. Most importantly: (1) the minor influence of the surface modification on the biodistribution, (2) an insignificant uptake of particles by the phagocytic cells at low internal exposure and (3) the size-independent biodistribution at low internal exposure, except for increased uptake of very small NPs (smaller than the capillary pores of the kidneys) by the kidneys and excretion in the urine.
The most important outcome of this work is that in vitro modeling of the pulmonary absorption with the ALICE system in combination with the presented in silico modeling of the biodistribution is closely reflecting the in vivo behavior of AuNP. Hence, the presented ap-proach has the potential to reduce short-term animal studies, which aim to assess the pulmonary absorption and biodistribution of NPs. Furthermore, the similar translocation kinetics observed inin vivo and in vitro ex-periments indicate that AuNP follow the same pathways through the air-blood barrier in animals as observed for the CMLs at the ALI. Hence, the presented setup may be a relatively cheap and fast in vitro model to deter-mine the translocation pathways of NPs through the air-blood barrier, which is also suitable to assess the influ-ence of e.g., the chemical composition, particle size and shape, surface modification, aggregation/agglomeration state and specific surface area.
Methods
Gold nanoparticles Synthesis
All investigated sizes of AuNP (2, 7, 18, 46, 80 nm) were synthesized in our laboratory.
The 2 nm gold particles were synthesized immediately before nebulizing in the ALICE. We followed the method described by Yong et al. [68], but slightly adapted it by the addition of sodium citrate (Fluka,
Sigma-Aldrich Chemie GmbH, Buchs, Switzerland). In brief, 0.5 mL of freshly prepared 1 M NaOH (Merck, Merck (Schweiz) AG, Zug, Switzerland) and 1 mL of tet-rakis (hydroxymethyl) phosphonium chloride (THPC) solution, obtained by adding 12 μL of 80 % THPC in water (Sigma-Aldrich, Sigma-Aldrich Chemie GmbH, Buchs, Switzerland) to 1 mL of millipore water, were added to a beaker that contained 45 mL of millipore water. The mixture was then magnetically stirred for 20 min at approximately 100 rpm. After the first 5 min of stirring 10 mL of 5 mM chloroauric acid (HAuCl4°
3H2O, from gold (III) chloride trihydrate;
Sigma-Aldrich) and after 20 min 400μL of 40 mM sodium cit-rate was added. The final concentration was 170 μg/mL for the 2 nm AuNP.
The 7 nm gold particles were prepared as described by Janaet al. [69]. In brief, 2 mL of 40 mM sodium citrate solution were mixed with 1.2 mL of 24.2 mM HAuCl4in
90 mL of millipore water. 1 mL of ice-cold 20 mM so-dium borohydride (NaBH4; Sigma-Aldrich) was added to
the stirred solution, which resulted in the formation of a brownish red dispersion. Vigorous stirring of the gold dispersion was continued for 5 min. After stirring, the dispersion was washed by ultra-filtration at 4500 rpm during 1 h, and redispersed in millipore water. The final concentration was 300μg/mL for the 7 nm AuNP.
The 18 nm gold particles were synthesized using cit-rate to reduce Au3+ following the procedure of Grabar et al. [70]. Briefly, the vigorously stirred aqueous tetra-chloroauric acid solution (125 mL, 0.25 mM HAuCl4
3H2O) was brought to boiling, followed by rapid
addition of 12.5 mL of 40 mM sodium citrate to the vor-texed HAuCl4solution, which resulted in a color change
from pale yellow to dark wine red. The solution was maintained at boiling temperature for 15 min and then removed from heat. Stirring was continued for another 15 min. After the dispersion had cooled down to room temperature, it was centrifuged at 4000 rpm for 30 min and redispersed in millipore water. The final concentra-tion was 200μg/mL for the 18 nm AuNP.
The 46 and 80 nm gold particles were synthesized by overgrowth of gold onto the 18 nm citrate-capped AuNP (seed suspension), as described in [71]. For 46 nm AuNP, the growth step was carried out by addition of hydroxylamine-hydrochloride (NH2OH∙HCl;
3 mL of 0.2 M; Sigma-Aldrich) and 18 nm citrate-capped AuNP dispersion (15 mL) to a solution of HAuCl4 (0.25 mM in 270 mL). For 80 nm AuNP, the
first growth step was carried out by the addition of NH2OH∙HCl (3 mL of 0.2 M) to a solution of gold
HAuCl4 (0.25 mM in 270 mL of water) followed by
addition of the seed dispersion (18 nm AuNP; 30 mL) resulting in spherical NPs of approximately 40 nm in diameter. A second growth step was performed following
the same procedure as the first step with adjusted concen-trations: 0.25 mM of HAuCl4°3H2O, 3 mL of 0.2 M of
NH2OH∙HCl, and 30 mL of 40 nm AuNP. The resulting
AuNP were subsequently functionalized with sodium citrate (1.7 mL of 40 mM sodium citrate) and washed by centrifugation at 4000 rpm for 15 min, and 2500 rpm for 15 min, respectively, and redispersed in millipore water. The final concentrations were 220μg/mL and 200 μg/mL for the 46 and 80 nm AuNP, respectively.
Characterization
UV–Vis spectra of the samples were recorded at 25 °C using a Jasco V-670 spectrophotometer (Jasco Europe S.R.L., Milano, Italy), using 10 mm path length quartz cuvettes. As a first approximation, the particle size was determined directly from UV–Vis spectra using the tab-ulated theoretical data of uncoated spherical gold nano-particles in water described in Haisset al. [72]. The size of the different AuNPs was qualitatively confirmed by means of TEM. The surface charge of AuNP samples was measured in suspension of 50 μg/mL in water at 25 °C using a phase amplitude light scattering (PALS) zeta potential analyzer (Brookhaven Instruments Corporation, Hotsville, NY, USA). The Smoluchowski approximation [73] was fitted to 15 cycles of electrophoretic mobility (EPM) measurements and 10 replicates were obtained for each sample to estimate the mean and SD. Dynamic light-scattering (DLS) measurements were carried out at room temperature and at a scattering angle of 90°, using a 3D LS spectrometer (LS instruments AG, Fribourg, Switzerland) equipped with a 21 mW HeNe laser (632.8 nm). Data was collected over 4 min, and five independent correlation functions were measured. The corresponding correlation functions were analyzed using the constrained regularized cumulant method [74].
Cell cultures A549 monocultures
The A549 cell line [34], a human AT II epithelial cell line, was obtained from the American Tissue Type Culture Collection (LGC Promochem, Molsheim, France). Cells (passage number 8–20) were maintained in RPMI 1640 medium (with 25 mM HEPES; Gibco BRL, Life Technologies, Basel, Switzerland) supplemented with 1 % L-glutamine (Gibco BRL), 1 % penicillin/streptomycin (Gibco BRL) and 10 % foetal calf serum (PAA Laborator-ies, Lucerna-Chem AG, Lucerne, Switzerland). For experi-mental cultures, cells were seeded at a density of 0.5 x 10⁶ cells/insert on transparent BD Falcon™ cell culture inserts (surface area of 0.9 cm2, pores with 3.0μm diameter, PET membranes for 12-well plates; BD Biosciences, Basel, Switzerland). Inserts were placed in BD Falcon™ tissue culture plates (12-well plates; BD Biosciences) with 1 mL medium in the upper and 2 mL in the lower chamber. The
cells were kept at 37 °C in 5 % CO2humidified atmosphere
for 7 days (medium changed after 3–4 days).
MLE-12 monocultures
The MLE-12 cell line [33], a mouse AT II epithelial cell line, was obtained from the American Tissue Type Cul-ture Collection. Cells (passage number 7–25) were maintained in advanced Dulbecco’s Modified Eagle Medium: Nutrient mixture F-12 (DMEM/F12) medium (Gibco BRL) supplemented with 1 % HEPES (Gibco BRL), 1 % insulin-transferrin-sodium selenite (Sigma-Aldrich), 1 % L-glutamine, 1 % penicillin/streptomycin, 10 nM hydrocortisone (Sigma-Aldrich) and 10 nM β-estradiol (Sigma-Aldrich). For experimental cultures, cells were seeded at a density of 0.5 x 10⁶cells/insert on transparent BD Falcon™ cell culture inserts (surface area of 0.9 cm2
, pores with 3.0μm diameter, PET membranes for 12-well plates). The cell culture inserts were pretreated with 45μL Matrigel coating solution, containing 3.36 mg/mL BD Matrigel™ basement membrane matrix growth factor re-duced (BD Biosciences) in Dulbecco’s modified Eagle Medium (DMEM) medium (Gibco). Inserts were placed in BD Falcon™ tissue culture plates (12-well plates) with 1 mL medium in the upper and 2 mL in the lower cham-ber. The cells were kept at 37 °C in 5 % CO2humidified
atmosphere for 3.5 days.
16HBE14o- monocultures
The 16HBE14o- cell line [75], a human bronchial epithe-lial cell line, was kindly provided by Dieter Gruenert (passage number P2.54; University California, San Francisco, CA, USA). Cells (passage number 11) were maintained in minimum essential media (MEM) 1x medium (with Earle’s Salts, 25 mM HEPES and without L-glutamine; Gibco BRL), supplemented with 1 % L-glutamine, 1 % penicillin/streptomycin and 10 % foetal calf serum. For experimental cultures, cells were seeded at a density of 0.5 x 10⁶cells/insert on transparent BD Falcon cell cul-ture inserts (surface area of 0.9 cm2, pores with 3.0μm diameter, PET membranes for 12-well plates). The cell culture inserts were pretreated with 150 μL fibronectin coating solution, containing 0.1 mg/mL bovine serum albumin (Sigma-Aldrich), 1 % bovine collagen Type I (BD Biosciences) and 1 % human fibronectin (BD Biosci-ences) in LHC Basal Medium (Sigma-Aldrich). Inserts were placed in BD Falcon™ tissue culture plates (12-well plates) with 1 mL medium in the upper and 2 mL in the lower chamber. The cells were kept at 37 °C in 5 % CO2
humidified atmosphere for 7 days (medium changed after 3–4 days).
The triple cell co-culture (TCCC) system
A TCCC system with A549 alveolar epithelial cells and hu-man blood monocyte derived macrophages and dendritic
cells was used. The TCCC systems were prepared as de-scribed before [43, 76]. Briefly, A549 CMLs were cultured as described above. At 7 days, the medium was removed from the upper and lower chamber, the inserts turned up-side down and the bottom was abraded carefully with a cell scraper. The inserts were then incubated with 150 μL medium containing 125,000 dendritic cells on the basal side of the CMLs for two hours. Afterwards, the nonadher-ent cells were removed, the inserts turned around again and placed in BD Falcon™ tissue culture plates (12-well plates). In the lower chamber 2 mL of medium and at the apical side of the CMLs 500μL medium containing 25,000 macrophages was added. Once again the systems were in-cubated for two hours to allow the macrophages to attach, before nonadherent cells were washed away. The complete TCCC systems were kept with 2 mL medium in the lower chamber and 1 mL in the upper chamber at 37 °C in 5 % CO2humidified atmosphere for 24 h.
Air-liquid interface cell exposure system (ALICE) Exposure
The medium in the upper chamber of the CMLs/TCCC systems was removed 24 h prior to exposure in the ALICE (to establish the ALI), the medium in the lower chamber was replaced by 1 mL of fresh medium and the basal side of the membrane was abraded carefully with a cell scraper (only for CMLs). Exposure to NPs in the ALICE was carried out as described elsewhere [12, 32]. Briefly, the ALICE consists of three main components: a droplet generator (nebulizer), an exposure chamber and a flow system with an incubation chamber providing temperature and humidity conditions suitable for cell cultivation. A dense cloud of micron-sized droplets is generated by nebulization of 1 mL AuNP suspension using a vibrating membrane droplet generator (Investiga-tional eFlow, PARI Pharma GmbH, Munich, Germany). The dense cloud of droplets generated by the eFlow nebulizer is transported at a flow rate of 5 L/min into the exposure chamber (20 × 20 × 30 cm) where it gently deposits onto cells cultured at the ALI in standard cell culture plates. Droplet deposition occurs due to single particle sedimentation and an effect known as cloud set-tling,i.e., the cloud of droplets moves like a bulk object ra-ther than like a collection of individual droplets [32]. The flow rate is chosen so that the cloud is diverted to all sides by the ground plate of the exposure chamber to form an almost symmetric pattern of vortices providing gentle, but sufficient mixing to result in uniform special droplet deposition on the cells. Following the exposure in the chamber (which takes about 15 min), the basal sides of the inserts were immediately washed thoroughly in phosphate-buffered saline solution (PBS; Gibco BRL) and placed in new BD Falcon tissue culture plates (12-well plates), to avoid any cross contamination of AuNP
that could have diffused directly into the basolateral medium via the gap between the well and the insert. Afterwards, the cells were kept under ALI conditions in 5 % CO2humidified atmosphere at 37 °C.
To obtain the desired exposure concentration, AuNP suspensions were diluted with millipore water immedi-ately before exposure. For the nebulization of ionic gold an ICP standard solution (Fluka) was used.
Sample collection
For each exposure condition (cell line, dose, size and time) the surface liquid, the cell monolayer and the basolateral medium from three different inserts were collected.
After exposure, the surface liquid, the cellular mono-layer and the basolateral medium (Fig. 1) were collected at various time points (0, 2, 8, 24, 48 or 72 h post-exposure). First, the basolateral medium was collected. Second, to segregate the surface liquid, the apical side of the CML was rinsed twice with 300μL PBS. At the end, 600μL of trypsin-EDTA (0.05 %, with phenol red; Gibco BRL) was placed on the apical side of the CML for ap-proximately 20 min. Afterwards, both sides of the mem-brane were rinsed thoroughly and the trypsin-EDTA solution containing the detached cells was collected. The obtained samples were stored in 1.5 mL Eppendorf tubes in the freezer until they were further processed to quan-tify the distribution of gold in the system.
Every 24 h, the basolateral medium was replaced by fresh medium and the old medium was also stored in the freezer until the samples were further processed (i.e., for the 48 and 72 h post-exposure CMLs). The amount of gold in the basolateral medium of each day was summed up to determine the total translocation fraction. A significant influence of the medium replacement on possible saturation effects can be ruled out because the basolateral medium compartment is several times larger than the surface liquid and CML compartment com-bined and, thus, the concentration of AuNP in the baso-lateral medium is at all times much lower than in the CML compartment.
Surface liquid height
The surface liquid height of the CMLs was quantified by determining the liquid volume with the pipette after 24 h at the ALI. The results represent the mean of the li-quid volumes of ten CMLs.
The translocated <30 kDa fraction
To assess the stability of the AuNP, the <30 kDa fraction in the basolateral medium from three A549 CMLs 24 h post-exposure was determined. To this end, a centrifugal concentrator with a 30 kDa cutoff filter (Sartorius Vivas-pin 2, Sartorius AG, Goettingen, Germany) was used.
The samples were centrifuged for 10 min at 500 rpm. The amount of gold in the basolateral solution of the membrane was measured using inductively coupled plasma mass spectrometry (ICP-MS) as described below. The efficiency of the procedure was determined by spik-ing a 1 mL RPMI medium supplemented as described above with 34 ng gold (gold standard for ICP; Fluka) and comparing the ICP-MS measurements of the spiked samples before and after filtration. As a worst case con-sideration, the difference in the recovery efficiency be-fore and after filtration was used to correct the translocated <30 kDa fractions.
Inductively coupled plasma mass spectrometry (ICP-MS) Sample preparation
To determine the total amount of settled AuNP in the ALICE, three wells of the BD Falcon™ tissue culture plates were kept completely empty during exposure. These empty wells were rinsed thoroughly with 1 mL of aqua regia. The aqua regia solutions were then left over-night on the shelf under the fume hood in 15 mL tubes before they were diluted with millipore water to 3 mL for the ICP-MS measurement.
Samples (surface liquid, cellular monolayer and the baso-lateral medium) were heated up to 70 °C and treated with 500μL HNO3(Sigma-Aldrich). After two hours at 70 °C,
the samples were placed in 15 mL tubes (BD Falcon Conical Tubes, BD Biosciences), supplemented with 500 μL of aqua regia (HCl (Fluka)/HNO3= 1/3, volume
ratio) and left overnight on the shelf under the fume hood before they were diluted with millipore water to 3 mL for the ICP-MS measurement. Compared to the settled amount of AuNP in the empty wells, the average recovery rate was approximately 80 % and 75 % for A549 and MLE-12 CMLs (total transwell chamber system), respectively.
Measurement
ICP-MS analyses were carried out on an Agilent 8800 ICP-MS (Agilent Technologies, Waldbronn, Germany) using an external calibration curve (1000 μg/ml gold standard for ICP; Merck) with internal standardization (1000μg/ml iridium standard for ICP; Merck). The instru-ment is equipped with two quadrupole mass analyzers (MS/MS) and a collision/reaction cell. Rinsing was done with 1 % HNO3/2 % HCl between each measurement.
The LOD of the ICP-MS corresponded to a dose of 25 ng/cm2. With lower doses it was not possible to reli-ably determine the translocated AuNP fraction in the basolateral medium 24 h post-exposure.
Epithelial membrane integrity tests and cell morphology Laser scanning microscopy (LSM)
The CMLs were labelled and scanned as described in earlier publications [13, 77]. Briefly, CMLs were washed
in PBS and fixed for 15 min at room temperature in 4 % paraformaldehyde (Sigma-Aldrich) in PBS. Fixed cells were permeabilized in 0.2 % Triton X-100 (Fluka) in PBS for 15 min. The CMLs were incubated with the anti-bodies at room temperature for two hours. The cytoskel-eton (F-actin-filaments) was stained with rhodamine phalloidin 1:50 (R-415; Molecular Probes, Life Technolo-gies Europe B.V., Zug, Switzerland) and the DNA was stained with DAPI 1:100 (Sigma Aldrich). Afterwards, preparations were washed three times in PBS and mounted in Glycergel (Dako Schweiz AG, Baar, Switzerland).
A Zeiss LSM 710 Meta with an inverted Zeiss micro-scope (Axio Observer.Z1, Lasers: HeNe 633 nm, and Ar 488 nm; Carl Zeiss AG, Feldbach, Switzerland) was used. Image processing and visualization was performed using IMARIS, a three-dimensional multi-channel image processing software for confocal microscopic images (Version 7.4.2; Bitplane AG, Zurich, Switzerland). To visualize the surfaces of the CMLs, a shadow projection was applied.
Permeability to Blue Dextran
After 24 h at the ALI, the medium at the basal side of the CML was replaced by 1 mL RPMI medium (without phenol red; Gibco BRL) supplemented with 10 % foetal calf serum. At the apical side of the CML 250μL of that medium and 250 μL of 1 % Blue Dextran (GE Health-care; VWR International GmbH, Dietikon, Switzerland) in PBS was placed. For the positive control group, RPMI medium (without phenol red) and 20 mM of EDTA (Sigma-Aldrich) was used. The CMLs were then incu-bated at 37 °C in 5 % CO2 humidified atmosphere for
two hours. Afterwards, the basolateral medium was col-lected and the mean absorbance at 600 nm was measured in triplicate using a Micro-plate Reader (Benchmark Plus; Bio-Rad Laboratories AG, Cressier, Switzerland). In total, the translocation through three CMLs was determined for each cell type. The absorbance was normalized to the translocation of Blue Dextran through an empty insert.
Transepithelial electric resistance (TEER) measurements
TEER was measured with the Millicell-ERS system (MERS 000 01; Millipore AG, Volketswil, Switzerland) as described in earlier publications [43, 77]. The mean of three measurements per insert was determined and in total ten inserts per cell line were assessed daily (five in-serts without exposure and five inin-serts with exposure in the ALICE). Before each measurement the CMLs were allowed to equilibrate for 15 min at room temperature in the biological safety cabinet. The electrical resistance of inserts without cells was subtracted from all samples, and the resistance values were multiplied with the sur-face area of the inserts (0.9 cm2).
Transmission electron microscopy (TEM) Particle diameter before and after ALICE exposure
TEM images were obtained using a Tecnai F20 (FEI, Eindhoven, The Netherlands) equipped with an Ultra-Scan 1000XP 2 k CCD camera (Gatan Inc., Pleasanton, CA, USA). To determine the particle diameters after nebulization in the ALICE system, standard TEM copper mesh grids were placed at the bottom of the ALICE. The images were analyzed automatically using ImageJ for Windows (Version 1.48a; National Institute of Health, Bethesda, MD, USA). By applying the watershed algorithm the individual particles were identified, and then the major diameter and circularity were automatic-ally determined.
Intracellular particles
Intracellular particles were visualized by conventional TEM as described before [12]. For TEM analysis, the ex-posed cells on the transwell membrane were fixed with 2.5 % glutaraldehyde (Sigma-Aldrich) in 0.15 M HEPES buffer for at least 24 h. Then they were washed with HEPES buffer, post-fixed with 1 % osmium tetroxide in sodium cacodylate buffer, washed with maleate buffer, and stained en bloc with 0.5 % uranyl acetate in maleate buffer. Afterwards, the cells were dehydrated in ascend-ing ethanol series, and embedded in Epon. From the embedded cells, ultrathin sections were cut parallel to the vertical axis of the cells and mounted on copper grids, stained with lead citrate and uranyl acetate. TEM images were obtained using a Morgagni 268 (FEI).
Statistics
An independent groupst-test was performed to compare the mean translocation fractions between two CMLs. To this end, the Statistics Calculator for Windows (Version 4.0; StatPac, Inc., Bloomington, MN, USA) was used. The criterion for statistical significance was p≤ 0.05.
Physiologically based pharmacokinetic (PBPK) modeling
The PBPK model for AuNP (Fig. 2) was adapted from our recently presented PBPK model for TiO2 NPs [39]. The
only changes made were the addition of the inhalation/ instillation pathway, the harmonization of the investigated organs/compartments with the data of Kreylinget al. [20] and the modification of one kinetic rate (i.e., the transloca-tion rate from the organ to the blood). A detailed descrip-tion of the PBPK model can be found in Addidescrip-tional file 1. In brief, the main idea of the PBPK model is that organs with the same capillary wall type (i.e., the non-sinusoidal non-fenestrated blood capillary type, the non-sinusoidal fenestrated blood capillary type and the sinusoidal blood capillary type, respectively) have the same uptake rate for nanoparticles and that the biodistribution via this transca-pillary pathway is size-independent. A sensitivity analysis
for the model structure can be found in the Supplemental Information for Bachleret al. [39], which reveals that the most sensitive parameters are the blood flow to the re-spective organs and the translocation constants. For the here-discussed AuNP-model also the translocation rates from the lung deposition compartment will be among the most sensitive parameters.
For all calculations with the PBPK model an uncertainty analysis was conducted using a Monte Carlo simulation (1000 iterations). To this end, log-normal distributions were used for the physiological and compound-dependent parameters, which were changed randomly in each iter-ation within their given distributions. A full list of parame-ters, along with the associated equations is given in Additional file 1.
Additional file
Additional file 1: Supplementary Material. Contents: Chapter 1: Additional data on the AuNP characterization: UV–Vis spectra, size distribution histograms, TEM images and physicochemical parameters and dose metrics of thein vivo studies that were compared to the CMLs. Chapter 2: Additional data on the CML characterization: LSM images of the CMLs after 72 and 96 h at the ALI and an in-detail discussion on the integrity test with Blue Dextran. Chapter 3: Additional data on the translocation kinetics: Estimation of the number of AuNP per cell exposed and the time-, size- and dose-dependent disposition of the AuNP between the three compartments of the transwell chamber system. Chapter 4: Additional data on the PBPK model: Model methodology, parameterization, parameters, equations and assumptions. And, the predicted translocation fraction and biodistribution of 200 nm gold particles in rats 24 h after intratracheal instillation and the predicted biodistribution of 20 nm AuNP in mice after two hours of inhalation exposure.
Abbreviations
ALI:Air-liquid interface; ALICE: Air-liquid interface cell exposure; AT II: Alveolar type II; AuNP: Gold nanoparticles; CML(s): Cellular monolayer(s); DLS: Dynamic light-scattering; EDTA: Ethylenediaminetetraacetic acid; GIT: Gastrointestinal tract; ICP: Inductively coupled plasma; LSM: Laser scanning microscope; LOD: Limit of detection; MS: Mass spectrometry; NP(s): Nanoparticle(s); PBPK: Physiologically based pharmacokinetic; PBS: Phosphate buffered saline; SD: Standard deviation; TCCC: Triple cell co-culture; TEER: Transepithelial electrical resistance; TEM: Transmission electron microscopy; TiO2: Titanium dioxide. Competing interests
The authors declare that they have no competing interests. Authors’ contributions
GB designed the study, carried out the exposure experiments, implemented the PBPK model, characterized the CMLs, helped to produce and characterize the AuNP, analyzed and interpreted the data and drafted the manuscript. SL was involved in performing the ICP-MS experiments. YU cultured the CMLs and assisted to characterize them. LRL was involved in the production and characterization of the AuNP. APF and KH critically revised the manuscript for important intellectual content. NvG and BRR were the project leaders; they were participating in planning the design of the study and critically revised the manuscript for important intellectual content. All authors read and approved the final manuscript.
Acknowledgements
The authors acknowledge support by the Electron Microscopy Center of the ETH Zurich (EMEZ) and would like to thank Dr. Carola Endes for helping with the preparation of the TCCC and Dr. Wolfgang Kreyling for sharing his data

![Fig. 9 Comparison of the PBPK model to biokinetic data from female Wistar-Kyoto rats [20] 24 h after intratracheal instillation of various sizes of AuNP](https://thumb-eu.123doks.com/thumbv2/123doknet/14976123.671271/8.892.86.805.132.536/comparison-biokinetic-female-wistar-kyoto-intratracheal-instillation-various.webp)