HAL Id: hal-02944378
https://hal.umontpellier.fr/hal-02944378
Submitted on 21 Sep 2020
HAL is a multi-disciplinary open access
archive for the deposit and dissemination of
sci-entific research documents, whether they are
pub-lished or not. The documents may come from
teaching and research institutions in France or
abroad, or from public or private research centers.
L’archive ouverte pluridisciplinaire HAL, est
destinée au dépôt et à la diffusion de documents
scientifiques de niveau recherche, publiés ou non,
émanant des établissements d’enseignement et de
recherche français ou étrangers, des laboratoires
publics ou privés.
To cite this version:
Andrea Tommasi, Lucan Mameri, Marguerite Godard. Textural and Compositional Changes in the
Lithospheric Mantle Atop the Hawaiian Plume: Consequences for Seismic Properties. Geochemistry,
Geophysics, Geosystems, AGU and the Geochemical Society, 2020, �10.1029/2020GC009138�.
�hal-02944378�
Textural and Compositional Changes in the Lithospheric
Mantle Atop the Hawaiian Plume: Consequences
for Seismic Properties
Andréa Tommasi1 , Lucan Mameri1 , and Marguerite Godard1
1Géosciences Montpellier, CNRS and Université de Montpellier, Montpellier, France
Abstract
We characterized the texture, composition, and seismic properties of the lithospheric mantle atop the Hawaiian plume by petrostructural analysis of 48 spinel peridotite xenoliths from four localities in three Hawaiian islands. Coarse‐porphyroclastic peridotites with variable degrees of recrystallization, recorded by growth of strain‐free neoblasts onto the deformed microstructure, predominate. Full evolution of this process produced equigranular microstructures. Some peridotites have coarse‐granularmicrostructures. Coarse‐granular and coarse‐porphyroclastic peridotites have strong orthorhombic or axial‐[100] olivine crystal‐preferred orientations (CPOs). Recrystallization produced some dispersion and, locally, changed the olivine CPO towards axial‐[010]. Enrichment in pyroxenes relative to model melting trends and pyroxenes with interstitial shapes and CPO uncorrelated with the olivine CPO imply
refertilization by reactive melt percolation. The unusual spatial distribution of the recrystallized fraction, Ti enrichment, and Rare Earth Element fractionation in recrystallized, equigranular, and coarse‐granular peridotites support that these microstructures are produced by static recrystallization triggered by melt percolation. However, there is no simple relation between microstructure and chemical or modal composition. This, together with marked variations in mineral chemistry among samples, implies multiple spatially heterogeneous melt‐rock reaction events. We interpret the coarse‐porphyroclastic microstructures and CPO as representative of the original oceanic lithosphere fabric. Annealing changed the microstructure to coarse‐granular, but did not modify significantly the olivine CPO. Recrystallization produced moderate dispersion of the CPO.“Normal” oceanic lithosphere seismic anisotropy patterns are therefore preserved. Yet Fe enrichment, refertilization, and limited heating of the base of the lithosphere may reduce seismic velocities by up to 2%, partially explaining negative velocity anomalies imaged at lithospheric depths beneath Hawaii.
1. Introduction
Hawaii is the archetype of a mantle plume. It displays voluminous intraplate volcanism with a clear age pro-gression and well‐developed bathymetric swell (Morgan, 1971). Body wave tomography models reveal a pancake‐shaped low‐velocity zone in the upper mantle beneath Hawaii, which continues with a more cylindrical shape into the transition zone and lower mantle (Wolfe et al., 2009, 2011). Rayleigh wave tomo-graphy images a broad low‐velocity anomaly surrounded by high velocities in the upper mantle beneath the Hawaiian swell (Laske et al., 2011). Recent multiphase tomography models constrain this low‐velocity anomaly to be composed of a pancake‐shaped anomaly extending from the lithosphere‐asthenosphere boundary (LAB) to ~150‐km depth and a series of discontinuous anomalies, which are stronger SE of Hawaii, at ~250‐ to 400‐km depth (Cheng et al., 2015). Sp receiver function studies imaged reflectors, which were interpreted as the LAB, at 75‐ to 95‐km depth beneath Hawaii (Li et al., 2004; Rychert et al., 2013). Both receiver function and admittance data point to shallowing of the LAB along the island chain towards Kauai (Cadio et al., 2012; Li et al., 2004).
These geophysical observations are consistent with the predictions of numerical models exploring the inter-action of a plume with a fast moving plate (Agrusta et al., 2013, 2015; Ballmer et al., 2011, 2013; Moore et al., 1998; Ribe & Christensen, 1994). These models show that the plume spreads at the base of the lithosphere, producing limited thinning (≤20 km) in response to active small‐scale convection within the plume‐fed asth-enosphere. They also predict multiple partial melting events: major melting at the plume impact point, which can explain the main island‐forming volcanism, and minor melting downstream of the impact
Key Points:
• Reactive melt percolation produced spatially heterogeneous changes in the composition and texture of the mantle lithosphere atop the plume • Refertilization, iron enrichment,
and moderate heating of the base of the lithosphere may have locally lowered seismic velocities • Strong axial‐[100] to orthorhombic
olivine CPO and“normal” oceanic lithosphere seismic anisotropy are preserved Supporting Information: • Supporting Information S1 • Data Set S1 • Data Set S2 • Data Set S3 • Data Set S4 • Data Set S5 Correspondence to: A. Tommasi, [email protected] Citation:
Tommasi, A., Mameri, L., & Godard, M. (2020). Textural and compositional changes in the lithospheric mantle atop the Hawaiian plume: Consequences for seismic properties. Geochemistry,
Geophysics, Geosystems, 21,
e2020GC009138. https://doi.org/ 10.1029/2020GC009138
Author copy of the final (peer-reviewed) version
Article published in Geochem. Geophys. Geosyst. in July 2020
Please, reference to: article Tommasi, A., Mameri, L., Godard, M. (2020) Textural and compositional changes in the
lithospheric mantle atop the Hawaiian plume: Consequences for seismic properties. Geochem. Geophys. Geosyst., 21,
e2020GC009138, doi: 10.1029/2020GC009138.
sphere (Von Herzen et al., 1989). Active‐source surveys on the north-eastern Hawaiian Arch image high P wave velocities (up to 8.65 km/ s) and strong azimuthal P wave anisotropy (9%) at sub‐Moho depths (Morris et al., 1969a; Ohira et al., 2018), typical of an undisturbed old oceanic plate. However, Ohira et al. (2018) also imaged multiple, lat-erally discontinuous mantle reflectors at depths of 30–85 km below the seafloor, which they interpreted as produced by frozen melt layers or lenses. Could the seismic anomalies in the deep lithosphere have partly a compositional origin?
Petrological and geochemical studies of peridotite and pyroxenite xenoliths exhumed by the rejuvenated‐stage volcanism in Oahu con-cluded that the peridotites represent a residual oceanic mantle litho-sphere metasomatically modified by interaction with plume‐related melts andfluids and the pyroxenites, the product of partial crystalli-zation of these melts in the mantle lithosphere at 50 to 70‐km depth (Ducea et al., 2002; Goto & Yokoyama, 1988; Keshav et al., 2007; Sen, 1988; Sen et al., 1993). Trace element and isotopic signatures point to a spatially heterogeneous metasomatism involving melts with variable compositions (Bizimis et al., 2003, 2007; Ducea et al., 2002; Sen, 1988; Sen et al., 1993, 2005). Analysis of the equilibrium temperatures and pressures of the pyr-oxenites implies warming of the base of the lithospheric mantle by the percolating magmas (Keshav et al., 2007; Sen, 1988; Sen et al., 2005). It is not clear, however, whether this warming corresponds to a large‐scale heating of the base of the lithosphere in response to the plume activity or if it is controlled by melt transport and crystallization and, therefore, local and transient.
Microstructures of the Hawaiian peridotite xenoliths are varied. Mercier and Nicolas (1975) classified them into protogranular, porphyroclastic, and equigranular and interpreted the variation in microstructure from protogranular to porphyroclastic and then to equigranular as recording increasingfinite strain. In contrast, Goto and Yokoyama (1988), based on the observation that peridotites withfine‐grained equigranular micro-structures were on average more Fe and Na rich than coarse‐grained ones, proposed that the recrystalliza-tion leading to the development of the equigranular microstructures was related to metasomatism. To explore the effects of the plume activity on the mantle lithosphere atop Hawaii, we analyzed the micro-structures, crystal‐preferred orientations (CPOs), and mineral compositions and calculated equilibrium tem-peratures and seismic properties of 48 spinel peridotites and three garnet‐spinel pyroxenites from four localities in three Hawaiian islands: Salt Lake (SAL, 19 xenoliths) and Pali (PAL, 18 xenoliths) in Oahu, Grove Farm (GF, 11 xenoliths) in Kauai, and Pu'uwai (PU, 3 xenoliths) in Nihau (Figure 1). All xenoliths were exhumed by the small‐volume rejuvenated‐stage alkalic volcanism, which postdates the main, shield volcano formation episodes by 0.6 to 4 Ma (Cousens & Clague, 2015; Jackson & Wright, 1970).
2. Methods
2.1. Mineral Chemistry Analysis and Geothermometry
Major element composition of olivine, orthopyroxene, clinopyroxene, and spinel, as well as garnet in the garnet‐spinel pyroxenites, were analyzed in 39 samples representative of the different microstructural groups and modal composition range using a Cameca SX100 electron microprobe analyser (EPMA) at the
Figure 1. Provenance of the studied mantle xenoliths (stars): Salt Lake (SAL)
and Pali (PAL) in Oahu, Grove Farm (GF) in Kauai, and Pu'uwai (PU) in Nihau, relative to a Rayleigh velocity model at 40‐km depth (Laske et al., 2011). Dots mark the location of seismic stations of the Hawaiian PLUME
experiment used in the inversion; colors indicate stations deployed at different phases of the PLUME experiment.
University of Montpellier. Number of analyzed grains, average compositions, standard deviations, informa-tion on core‐rim variainforma-tions for each sample and analytical condiinforma-tions are presented in the Supporting Information, Table S1.
Trace element compositions of orthopyroxene, clinopyroxene, and garnet in 18 samples from Salt Lake and Pali were measured at the University of Montpellier using a 1991 vintage VG Plasmaquad II turbo ICP‐MS, coupled with a Geolas (Microlas) automated platform housing a 193‐nm Compex 102 laser from LambdaPhysik following the method described in Drouin et al. (2009). Analyses were performed on ~150μm thick sections, cleaned with alcohol to remove carbon coating after EPMA analyses, and dried under nitrogen. Signals were acquired in time‐resolved acquisition, devoting 2 min for the blank and 1 min for measurement of the analytes. The laser wasfired using an energy density of 15 J/cm2at a frequency of 5 Hz using a spot size of 102μm. This resulted in a sensitivity of ~4,000 cps/ppm for In based on measure-ments on the NIST 612 certified reference material. Oxide level, measured using the ThO/Th ratio, was below 0.7%. Data were reduced using the GLITTER software (Van Achterberg et al., 2001) using a linear fit to ratio.43Ca was used as an internal standard and analyte concentrations were calibrated against the
NIST 612 rhyolitic glass using the values given in Pearce et al. (1997). This resulted in a 5% to 11% precision (1 sigma) evaluated by repeated analyses of reference basalt BR (Table S2).
When both orthopyroxene and clinopyroxene were present, equilibrium temperatures were calculated using the two‐pyroxene Fe‐Mg exchange geothermometer from Brey and Koehler (1990) for both cores and rims. When possible, orthopyroxene‐clinopyroxene pairs in contact were used, but textural equilibrium cannot be ensured for all samples. Equilibrium temperatures were also estimated using the Ca and Al in orthopyroxene geothermometers from Brey and Koehler (1990) and Witt‐Eickschen and Seck (1991). When exsolutions were present, calculations were performed using the exsolved compositions; the calculated temperatures record therefore the last equilibrium achieved by the samples before extraction from the mantle. Equilibrium pressures were estimated for two garnet‐spinel pyroxenites from Salt Lake using the orthopyroxene‐garnet barometer of Nickel and Green (1985).
2.2. EBSD Data Acquisition and Treatment
CPOs of olivine, pyroxenes, garnet, and spinel were measured at the SEM‐EBSD facility at Geosciences Montpellier by indexing of electron backscatter diffraction (EBSD) patterns produced by interaction of an incident electron beam with a carefully polished thin section tilted at 20° to the electron beam. Measurements were performed in a JEOL JSM 5600 scanning electron microscope using an acceleration vol-tage of 17 kV and a working distance of 23 mm. Maps covering almost entirely each thin section were obtained using steps between 15 and 35μm, depending on grain size. Indexing rates ranged between 80% and 90%. Lower indexation rates (70–80%) were obtained for a few peridotites (GF1B2F, GF4) that show some alteration along grain boundaries due to reaction with the host basalt. Orthopyroxene was seldom mis-indexed as clinopyroxene. Inaccurate mineral determination and misindexing due to olivine pseudo‐symmetry were corrected by careful post‐acquisition data treatment controlled by comparing EBSD maps and optical microscopy observations.
Modal compositions were approached as the area fraction occupied by each mineral on the EBSD maps, recalculated for a 100% indexation. This method might slightly underestimate the orthopyroxene modal con-tent (by <5%), since this phase tends to have more indexation errors than olivine or clinopyroxene. CPO data are displayed in polefigures, presented as lower hemisphere stereographic projections. Data are presented as one measurement per pixel; this accounts for the area occupied by each orientation, giving more weight to coarse crystals. When the foliation and lineation could be identified, the orientation of the main crystallographic directions—[100], [010], and [001] for olivine and pyroxenes—is plotted relative to the principal axes of the strain ellipsoid X, Y, and Z. In some samples, the orientation of the foliation and lineation could not be defined. To facilitate comparison between different samples, we present the CPO data of all samples rotated into a common orientation, in which the maximum concentration of olivine [100] and [010] axes are parallel to the E–W and the N–S directions of the pole figure, respectively. This reorientation is justified a posteriori by the analysis of the olivine CPO, which is characterized by clear maxima of [100] and [010], consistent with deformation by dislocation creep with dominant activation of the [100](010) slip sys-tem in all samples.
PAL2 CP 15d 69 18 13 1 PAL10 CP 5 69 20 10 1 90.0 9.7 866 867 894 910 920 952 PAL18 CP 4 65 22 13 1 89.9 7.9 874 989 902 903 960 1004 PAL23a CP 15d 70 21 8 1 89.7 9.9 881 868 912 964 954 957 PAL25a CP 10 63 24 12 1 PU1B1 CP 4 68 22 10 0 70SAL11 CG 43 67 28 4 1 90.6 13.5 920 932 947 1008 SAL6‐25 CG 46 79 15 5 1 91.4 18.4 965 965 950 1043 SAL35 CG 46 61 33 5 1 85.0 7.3 950 977 981 992 996 998 SAL38 CG 56 56 36 8 0 88.1 7.8 931 933 954 937 1000 1038 PAL26 CG 25 44 48 7 1 GF1B1 CG 42 77 21 2 0 GF13d‐Du CG 34 98 0 1 0 87.2 43.7 GF13c Rex 11 71 25 4 0 89.8 10.6 776 748 866 896 PAL14a Rex 13 63 21 15 1 GF12 Rex 15 85 14 1 0 90.6 20.5 845 900 890 896 SAL16 Rex 15 73 15 12 0 89.9 10.7 1008 1012 971 1026 1040 1093 PAL25b Rex 18 55 29 14 3 89.0 7.4 911 909 934 921 897 899 PAL21 Rex 20 71 17 10 2 PAL3 Rex 21 50 30 16 4 88.4 6.3 890 886 906 944 984 913 PAL20 Rex 21 62 20 17 1 PAL24 Rex 21 52 33 13 2 88.7 7.2 958 945 953 935 921 945 SAL3 Rex 22 73 13 12 1 88.7 12.7 923 969 940 952 1007 1015 SAL20 Rex 22 73 21 6 0 90.4 10.4 932 947 979 1005 GF2a Rex 23 81 17 2 0 90.5 26.5 975 922 1019 958 SAL2 Rex 24 66 20 12 1 89.8 13.4 942 952 930 940 1028 1025 PALD4 Rex 25 44 35 20 1 88.8 5.1 895 835 909 902 PAL15 Rex 27 89 2 8 1 89.2 19.4 935 886 967 962 PU4A Rex 28 79 19 2 0 89.2 17.5 876 837 917 932 SAL6‐58 Rex 32 60 20 18 1 89.4 7.4 924 921 937 965 981 987 GF1B2 Rex 33 75 20 3 2 PU5‐6 Rex 33 85 11 2 1 88.2 30.8 830 880 909 896 SAL18 Rex 34 78 16 6 0 89.0 11.6 917 966 923 1029 SAL126‐6 Rex 38 72 20 7 0 GF4 Rex 39 58 26 14 2 89.7 12.3 763 752 877 944 GF13d‐Hz Rex 40 82 14 4 0 87.4 17.1 918 976 961 PAL7 Rex 42 68 20 13 0 89.4 6.0 851 864 898 917 928 945 GF8 EQ 50 64 26 9 1 89.5 9.3 787 755 863 924 PAL12 EQ 50 72 23 4 0 88.4 10.2 953 944 1001 991 942 980 GF9 EQ 53 74 14 10 2 89.4 12.7 919 960 GF5 EQ 56 80 20 0 0 90.7 15.8 810 814 856 939 69SAL63a EQ 58 74 19 7 0 89.8 12.6 934 864 985 1056 69SAL41a EQ 59 69 20 9 2 89.5 9.0 933 943 958 999 SAL37b EQ 71 57 35 8 0 PAL8 EQ 76 99 1 0 0 88.4 28.1 SAL33 Mag 5e 30 25 38 2 82.2 998 1011 1017 1022 945 954 1.45 SAL14 Mag 9e 1 2 86 3 74.7 937 993 1.25 SAL7 Mag 8e 2 0 88 2 75.8
Note. Mg# and C# estimated from average chemical composition and modal contents (area %) of each mineral. Abbreviations: CG, coarse‐granular; EQ, equigranular; Mag, magmatic; Rex, recrystallized.
aTwo‐pyroxene thermometer and Ca‐in‐opx thermometer (Brey & Koehler, 1990). bAl‐in‐opx thermometer (Witt‐Eickschen & Seck, 1991). cOrthopyroxene‐
garnet barometer (Nickel & Green, 1985). dHigh apparent recrystallized fraction because a few coarse olivine crystals have low GOS. eGarnet modal fraction (%); there is no recrystallized olivine in the pyroxenites
The strength (intensity) of the olivine CPO was quantified using the dimensionless J index, which is the volume‐averaged integral of squared orientation densities. The J index was calculated using the MTEX toolbox in MATLAB (http://mtex.googlecode.com) (Bachmann et al., 2011; Hielscher and Schaeben, 2008) with orien-tation distribution functions (ODFs) calculated using a“de la Vallée Poussin” kernel with a half width of 10°. This calculation was per-formed using both one‐orientation datum per pixel and the mean orientation of each grain. Thefirst option, which is presented in thefigures, allows relating the CPO strength to variations in grain size. Coarse crystals contribute more to the J index, as they do for the anisotropy of physical properties. In naturally deformed perido-tites, the J index, when calculated using the same parameters as in this study, typically ranges between 1 (random CPO) and 18, with a median at 4.8 (Tommasi & Vauchez, 2015).
The symmetry of the olivine CPO is characterized by the dimen-sionless BA index (Mainprice, Bachmann, et al., 2014). The BA index allows a classification of the olivine CPO symmetry into three types: axial‐[010], characterized by a point concentration of [010] and a girdle distribution of [100] (BA index < 0.35); orthor-hombic, characterized by point concentrations of both [100] and [010] (0.35 < BA index < 0.65); and axial‐[100], characterized by a point concentration of [100] and a girdle distribution of [010] (BA index > 0.65).
The automatic grain detection routine in the MTEX toolbox (Bachmann et al., 2011) is used for quantitative analysis of grain sizes and shapes. Grain boundaries are defined by misorientations between neighboring pixels >15°. Intracrystalline orientation gradients, which are a proxy for the dislocation density, were quan-tified by the analysis of the misorientation of each pixel relative to the average orientation of the grain (M2M). The decrease in the mean M2M value (averaged over the entire sample) is used as a proxy for quan-tifying the degree of recrystallization of the sample. Both dynamic recrystallization and annealing (static recrystallization) result in decrease of the intracrystalline dislocation density due to recovery and growth of grains with low dislocation densities, such as newly crystallized or recrystallized grains. Recrystallized area fractions for olivine are estimated as the area fraction occupied by grains with a spread in orientation (GOS, which is the average M2M in the grain) <1.5° relative to the total area occupied by olivine grains. The sinuosity of grain boundaries is characterized by the shape factor, which is the ratio between the peri-meter of the grain and the periperi-meter of a circle with the same area. The shape factor decreases during annealing.
2.3. Seismic Properties
Seismic properties were calculated using the CPO of all major phases and their respective modal content esti-mated from EBSD maps (Mainprice, 1990; Mainprice, Hielscher, & Schaeben, 2014). In situ seismic proper-ties were estimated using elastic tensors and density of olivine and pyroxenes recalculated based on the geotherm constrained based on the xenoliths equilibrium data and experimentally determined pressure and temperature derivatives (Abramson et al., 1997; Chai et al., 1997a, 1997b; Collins & Brown, 1998; Reichmann & Jacobsen, 2004). Voigt‐Reuss‐Hill averaging was applied in all calculations.
Average seismic properties for the lithospheric mantle beneath Oahu and Kauai‐Nihau were estimated by averaging the elastic constant tensors calculated using the CPO data of the different samples rotated into a common structural reference frame, which assumes a geographically coherent orientation of the foliation and lineation beneath the islands. These values represent therefore maximum estimates of the seismic anisotropy that may be produced by the studied xenolith suite. A similar averaging was also per-formed for each microstructural group to evaluate the effect of changes in the microstructure on seismic anisotropy.
Figure 2. Modal composition as a function of the xenolith origin and
microstructure plotted on a clinopyroxene/orthopyroxene versus olivine modal content diagram for comparison with evolutions predicted by isobaric melting models calculated for an initial modal composition of 55% olivine, 28% opx, 15% cpx, and 2% spinel. Error bars represent ±1% uncertainty in the determination of the modal composition.
(c) (e) (g) (i) (j) (h) (f) (d)
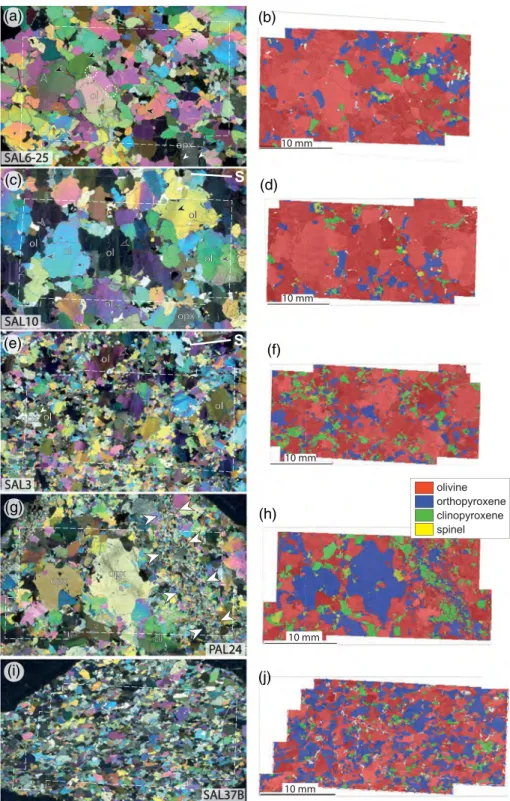
Figure 3. Photomicrographs in cross‐polarized light (a, c, e, g, i) and EBSD phase maps (b, d, f, h, j) illustrating
characteristic microstructures of Hawaii peridotite xenoliths: (a, b) coarse‐granular, (c, d) coarse‐porphyroclastic, (e, f) partially recrystallized coarse‐porphyroclastic with dispersed distribution of the neoblasts, (g, h) partially recrystallized coarse‐porphyroclastic with recrystallization and pyroxene enrichment concentrated in a vein‐like domain (indicated by white arrows in g), and (i, j) equigranular. S in (c, e) marks the trace of the foliation in the thin section plane. White dashed polygons in (a, c, e, g, i) delimit the area covered by the EBSD maps.
3. Results
3.1. Modal Compositions
Lherzolites predominate among Salt Lake (SAL) and Pali (PAL) peridotites (26/34), whereas harzburgites predominate among Grove Farm (GF) and Pu'uwaii (PU) peridotites (9/14, Table 1). Dunites and wehrlites are rare. Comparison of the peridotites modal compositions with those predicted by different melting models highlights that most studied xenoliths have compositions that depart from partial melting trends (Figure 2), implying changes in modal composition in response to reactions with melts. Most often, modal compositions are homogeneous at the sample scale, suggesting diffuse porousflow (Figures 3d, 3f, and 3j). However, pyroxene‐rich layers with diffuse limits record melt focusing in a few samples (Figures 3b and 3h).
3.2. Microstructures
The studied peridotites display coarse‐granular (CG; Figure 3a), coarse‐porphyroclastic (CP; Figure 3c), par-tially recrystallized coarse‐porphyroclastic (Rex; Figures 3e and 3g), or equigranular (EQ; Figure 3i) micro-structures. These microstructural types encompass a continuous variation in grain size, shape factor (sinuosity of grain boundaries), and degree of internal deformation of the olivine crystals (Figure 4). There is no relation between modal composition and microstructure. Most studied Hawaii peridotites dis-play partially recrystallized coarse‐porphyroclastic microstructures (24/48), but this class encompasses a large variation in the degree of recrystallization (10–45%, Table 1). The other microstructures are roughly equally represented (9/48 coarse‐porphyroclastic, 7/48 coarse‐granular, 8/48 equigranular). Except for Pu'uwai, where the three studied samples display coarse‐porphyroclastic microstructures with variable degrees of recrystallization, all microstructural types are observed in every studied locality. The pyroxenites have coarse‐ or medium‐grained magmatic cummulatic microstructures.
Coarse‐granular peridotites have plurimillimetric olivine and orthopyroxene crystals (Figures 3a and 3b). Olivine 2D area‐weighted mean diameters range between 1.7 and 3.6 mm (Figure 4). These peridotites do not display any shape‐preferred orientation, except for GF1B1, which has a weak foliation marked by rare elongated orthopyroxene crystals (Figure 5a). Olivine crystals tend to display low intragranular misorienta-tions (Figures 3a, 4, and 5a), but widely spaced subgrain boundaries are preserved in some crystals (black arrows in Figure 3a). The intensity of intragranular misorientation in olivine varies among the samples
Figure 4. Quantitative microstructural parameters derived from EBSD maps. (a) 2D apparent olivine grain size (defined
as the area‐weighted average of the diameter of circles with the same area as the grains) as a function of the average mean intragranular misorientation (M2M) in olivine. Coarse‐granular peridotites can be distinguished from
coarse‐porphyroclastic peridotites by the lower average intragranular misorientation in olivine, whereas partially recrystallized and equigranular peridotites are characterized by decrease in both grain size and intragranular
misorientations. (b) Decrease in the sinuosity of grain boundaries with increasing recrystallization. The sinuosity of grain boundaries is quantified by the area‐weighted average shape factor (ratio between the perimeter of the grain and the perimeter of a circle with the same area). The recrystallized fraction is quantified by the area fraction composed by grains with low intragranular misorientation (grain orientation spread, GOS < 1.5°). Dashed line in (b) indicates the shape factor of a well‐equilibrated synthetic olivine aggregate composed by polygonal crystals (Demouchy et al., 2019). Data presented in Table 2. Similar data for orthopyroxene and clinopyroxene are presented in Table S3.
(Figure 4, Table 2): it is lowest in SAL6‐25 (average M2M of 1.4°) and highest in GF1B1 (average M2M of 2.3°), which shows a microstructure transitional between coarse‐granular and coarse‐porphyroclastic. Olivine grain boundaries are sinuous or polygonal, forming locally triple junctions at 120° (Figures 3a, 5a, and 5b). Orthopyroxene has very irregular grain shapes (Figure 3b) and sinuous boundaries, which often form cusp‐like shapes when in contact with two olivines (white arrows in Figure 5a). Large orthopyroxene crystals show kink bands (black arrows in Figure 5a) and well‐developed clinopyroxene exsolutions in the cores, but homogeneous cusp‐like terminations (Figure 5a). Clinopyroxenes are usually smaller (≤1 mm) than orthopyroxenes and have interstitial‐like shapes (Figure 3a). Spinels have irregular shapes and are usually associated with pyroxenes (Figure 5b).
Coarse‐porphyroclastic peridotites have a continuous grain size variation with plurimillimetric olivine and orthopyroxene porphyroclasts (Figures 3c and 3d). Olivine 2D area‐weighted mean diameters range between 1.8 and 4.2 mm, with SAL samples presenting the coarser grain sizes (Figure 4). In contrast to coarse‐granular peridotites, coarse‐porphyroclastic peridotites display a weak, but clear shape‐preferred orientation of olivine (Figure 3c). They also show a higher density of intracrystalline deformation features (Figures 3c and 5c), quantified by higher average M2M values in olivine (2.4–3.6°, Figure 4). Olivine‐olivine grain boundaries are sinuous, denoting migration (Figures 3c and 5c). Olivine crystals have undulose extinction and subgrain boundaries preferentially aligned normal to the crystals' elongation (Figure 3c). In rare samples, as in PAL23a, the olivine shape‐preferred orientation has been modified by recrystallization, but the preferential alignment of subgrain boundaries in olivine still marks the normal to the lineation (Figure 5c). Orthopyroxene has very irregular shapes and does not show a shape‐preferred orientation (Figure 3d). Most crystals have kinks and fine clinopyroxene exsolutions; some contain
(d) (c)
Figure 5. Photomicrographs in cross‐ or plane‐polarized light showing characteristic features of (a, b) coarse‐granular
and (c, d) coarse‐porphyroclastic microstructures. (a) Olivine (ol) crystals with straight grain boundaries and no intragranular deformation coexisting with orthopyroxenes (opx) with kinks (black arrows) and clinopyroxene exsolutions, very irregular shapes and cusp‐like terminations along olivine‐olivine grain boundaries (white arrows). (b) Olivine and orthopyroxene crystals with polygonal shapes and interstitial‐shape spinels within a pyroxene aggregate. (c) Coarse‐grained olivine crystals with sinuous grain boundaries, undulose extinction, and well‐developed subgrain boundaries with a preferred orientation at the sample scale (white arrows). (d) Orthopyroxene (opx) with irregular shape and cusp‐like terminations along olivine‐olivine grain boundaries (white arrow), kinks (black arrows), and clinopyroxene exsolutions. L in (c) marks the pastflow direction defined by the olivine CPO, which is at high angle to the apparent lineation defined by the olivine SPO.
rounded olivine inclusions (Figure 5d). Orthopyroxene grain boundaries are curved and, as in coarse‐grained peridotites, tend to form cusp‐like shapes at the contact with two olivine crystals (Figure 5d). Clinopyroxene has very irregular shapes and similar or smaller grain sizes than
Table 2
Microstructural and CPO Parameters for Olivine Derived From EBSD
Sample Microstructure Olivine Rex fraction (%) N° of grains analyzed J index (all) J index (Rex) BA index M2M (°)a Grain size (μm)a Shape factora Aspect ratioa SAL10 CP 10 126 10.43 6.98 0.82 2.45 4235 1.96 1.53 SAL36b CP 15 166 8.98 4.37 0.81 3.55 3580 2.03 1.73 PAL1 CP 20 227 5.48 2.99 0.42 2.83 2826 2.09 1.68 PAL2 CP 15 395 4.81 3.12 0.60 2.36 2210 1.91 1.67 PAL10 CP 5 344 6.17 3.01 0.81 3.51 1930 1.97 1.75 PAL18 CP 4 183 6.44 5.28 0.59 3.26 2360 1.89 1.47 PAL23a CP 15 255 5.31 3.62 0.66 2.30 1806 1.95 1.97 PAL25a CP 11 487 5.38 1.86 0.56 3.23 2234 2.41 1.59 PU1B1 CP 4 287 5.78 2.41 0.60 3.49 2136 2.15 1.86 70SAL11 CG 43 135 8.18 4.21 0.69 1.98 3588 1.99 1.65 SAL6‐25 CG 46 207 6.63 4.24 0.72 1.44 2747 1.93 1.62 SAL35 CG 46 168 6.55 3.35 0.75 1.46 3022 1.86 1.51 SAL38 CG 56 138 6.37 3.84 0.66 1.54 2581 1.84 1.59 PAL26 CG 25 118 5.44 4.40 0.54 1.68 1744 1.77 1.86 GF1B1 CG 42 187 11.38 4.15 0.50 2.29 3480 1.90 1.55 GF13d‐ Du CG 34 265 6.80 4.24 0.42 1.74 1920 2.09 1.83 GF13c Rex 11 573 7.75 4.50 0.79 3.90 2477 2.26 1.68 PAL14a Rex 13 801 4.75 1.80 0.57 3.71 1807 2.09 1.64 GF12 Rex 15 788 8.94 5.31 0.85 3.52 2182 2.22 1.70 SAL16 Rex 15 333 4.24 2.80 0.71 3.11 2124 2.08 1.68 PAL25b Rex 18 1016 3.78 2.44 0.54 2.98 1510 2.31 1.80 PAL21 Rex 20 1675 3.82 2.35 0.72 3.26 1437 2.12 1.83 PAL3 Rex 21 809 3.48 2.43 0.76 3.00 1617 2.28 1.66 PAL20 Rex 21 352 6.22 2.96 0.71 2.64 1568 2.10 1.71 PAL24 Rex 21 1806 3.46 2.01 0.52 4.10 1428 2.21 1.61 SAL3 Rex 22 1155 5.15 2.96 0.70 3.71 2042 2.29 1.54 SAL20 Rex 22 333 4.30 2.70 0.82 3.50 2238 1.92 1.61 GF2a Rex 23 1038 9.49 8.99 0.39 3.36 1370 2.13 1.58 SAL2 Rex 24 1028 4.98 2.98 0.81 2.76 1416 2.00 1.94 PALD4 Rex 25 545 5.81 2.39 0.73 2.76 1730 2.26 1.63 PAL15 Rex 27 575 5.15 2.72 0.49 3.01 1658 1.92 1.58 PU4A Rex 28 1826 2.66 1.73 0.27 2.58 1143 2.01 1.66 SAL6‐58 Rex 32 1173 3.48 2.57 0.74 2.61 1180 2.10 1.87 GF1B2 Rex 33 559 6.51 3.77 0.60 2.87 1168 1.70 1.97 PU5‐6 Rex 33 889 2.92 2.26 0.45 2.21 1182 1.89 1.54 SAL18 Rex 34 272 5.84 3.07 0.43 2.02 2622 1.93 1.66 SAL126‐6 Rex 38 918 4.46 2.50 0.67 2.42 1306 1.92 1.82 GF4 Rex 39 2003 3.03 2.61 0.13 2.37 838 2.13 1.62 GF13d‐ Hz Rex 40 1216 2.72 2.08 0.38 1.80 898 1.94 1.88 PAL7 Rex 42 3543 1.94 1.80 0.77 2.58 645 1.89 1.75 GF8 EQ 50 3035 2.92 2.81 0.52 2.23 662 1.61 1.87 PAL12 EQ 50 3604 2.68 2.25 0.62 2.07 727 1.85 1.69 GF9 EQ 53 1905 2.35 2.25 0.51 1.71 728 1.78 1.75 GF5 EQ 56 1040 3.75 2.90 0.93 1.93 847 1.76 1.63 69SAL63a EQ 58 424 4.39 2.80 0.66 1.51 1424 1.70 1.54 69SAL41a EQ 59 932 3.01 2.65 0.69 1.73 837 1.67 1.71 SAL37b EQ 71 1594 2.36 1.95 0.77 0.97 890 1.92 1.87 PAL8 EQ 76 22078 1.87 1.42 0.31 1.50 369 1.56 1.50
Abbreviations: CG, coarse‐granular; CP, coarse‐porphyroclastic; EQ, equigranular; Rex: recrystallized.
aWeighted (by the grain area) averages over the entire EBSD map. 2D measurements without any topological correction. Aspect ratios are minimum values since
orthopyroxene (Figure 3d). It either forms aggregates with orthopyroxene ± spinel or occurs as isolated, interstitial‐like crystals (Figure 3d). Orthopyroxene exsolutions are common. Spinel occurs as irregularly shaped crystals within aggregates with pyroxenes or as inclusions in olivine.
Partially recrystallized coarse‐porphyroclastic peridotites display variable degrees of recrystallization, recorded asfiner‐grained strain‐free olivine neoblasts that overgrow the coarse‐porphyroclastic microstruc-ture (Figures 3e to 3h). Recrystallized fractions range from 10% to 40% (Figure 4). There are two modes of spatial distribution of the recrystallized fraction. In a few samples, as PAL14A, PAL24, and PALD4, recrys-tallization occurs essentially within planar, vein‐like domains with diffuse limits, 1–8 mm wide, which cross-cut the coarse‐porphyroclastic microstructure (Figures 3g, 3h, 6a, and S1). These domains are enriched in pyroxenes relative to the remainder of the sample (Figure 3h). They are composed byfine‐grained olivine
(c) (d)
(e) (f)
Figure 6. Photomicrographs in cross‐polarized light displaying characteristic features of the partially recrystallized
microstructure. (a) Recrystallization concentrated in a vein‐like domain (delimited by the white arrows). (b) Irregular limit of the recrystallized domain (delimited by the white dashed line) showing polygonal strain‐free neoblasts growing onto olivine (ol) porphyroclasts with well‐developed subgrain boundaries (white arrows). (c, d) Diffusely distributed strain‐free neoblasts with irregular shapes growing onto olivine porphyroclasts with undulose extinction coexisting with orthopyroxenes (opx) with very irregular shapes with embaymentsfilled by olivine neoblasts (arrows in c and d). (e) Strongly recrystallized lherzolite showing elongated olivine porphyroclasts overgrown by heterogeneously distributed olivine neoblasts. (f) Detail of (e) illustrating the subhedral, tablet‐like shapes of the olivine neoblasts and the interstitial shapes of orthopyroxene in recrystallized pockets. In (e), L1is the elongation of olivine porphyroclasts and S2is the shape‐preferred orientation of neoblasts.
neoblasts (GOS < 1.5°) intermixed with orthopyroxene and clinopyroxene (Figure 6b). Both olivine and pyroxene neoblasts have irregular shapes, though olivine‐olivine contacts tend to be straighter, and variable grain sizes. In the vicinity of the recrystallized domains, olivine porphyroclasts tend to display higher densities of subgrain boundaries than farther away (white arrows in Figure 6b). However, in most partially recrystallized peridotites, neoblasts overgrow the preexisting coarse‐granular microstructure in a non‐organized manner (Figures 3e and 3f). They are dispersed in a heterogeneous manner along the grain boundaries of olivine porphyroclasts, without forming neither a clear foliation nor core and mantle structures (Figures 3e, 6c, 6e, and S1). Strongly recrystallized peridotites contain irregular pockets of olivine neoblasts (Figure S1). Isolated olivine neoblasts have usually irregular shapes, but within recrystallized pockets, contacts between olivine neoblasts tend to be polygonal (Figures 6b and 6d). The recrystallization front, that is, the contact between the recrystallized patch and the olivine porphyroclasts, is usually sinuous (Figure S1). In some strongly recrystallized peridotites (>20%), olivine neoblasts display
(a) (b)
(c) (d)
(e) (f)
Figure 7. Photomicrographs in cross‐polarized light displaying characteristic features of the equigranular
microstructure. (a) Strongly recrystallized lherzolite with a weak foliation (S) marked by the shape‐preferred
orientation of the neoblasts. (b) Detail of (a) illustrating the coexistence of elongated olivine (ol) neoblasts with straight grain boundaries and small orthopyroxenes (opx) with interstitial shapes in the recrystallized domains. (c, d) Strongly recrystallized dunite with a few oxidized porphyroclasts enclosed in a matrix of non‐oxidized polygonal neoblasts. (e) Strongly recrystallized harzburgite with coarse orthopyroxene crystals with very irregular shapes with embayments filled by olivine (white arrows). (f) Coexistence of relict olivine porphyroclasts with concave grain boundaries (black arrows), of olivine neoblasts with straight grain boundaries, and of orthopyroxenes with curved grain boundaries forming cusps at triple junctions with two olivine grains (white arrows). S, trace of foliation.
grains in olivine porphyroclasts (L1in Figure 6e).
Equigranular peridotites (Figures 3i, 3j, and 7) are characterized by recrystallized area fractions≥40% and 2D area‐weighted mean grain sizes <1 mm, except for 69SAL63a that has a coarser average grain size of 1.4 mm (Figure 4). As in the partially recrystallized peridotites, contacts between olivine neoblasts tend to be polygonal, but those with olivine porphyroclasts or pyroxenes are usually sinuous. In most samples, the olivine neoblasts have no shape‐preferred orientation, but in SAL37b, 69SAL41a, GF5, and GF8, align-ment of tabular olivine neoblasts results in a weak foliation (Figures 3i, 7a, and 7b). All samples preserve a few olivine porphyroclasts with very irregular shapes and frequent subgrains. In dunite PAL8, the porphyr-oclasts are oxidized, while the neoblasts are not (Figures 7c and 7d). Orthopyroxene occurs either as large‐ or intermediate‐sized porphyroclasts with irregular shapes and sinuous boundaries (Figure 3j), where the embayments arefilled by olivine (white arrows in Figures 7e and 7f), or as small (~500 μm wide) crystals with polygonal or interstitial‐like shapes (Figure 7b). When present, clinopyroxene is smaller than orthopyr-oxene and occurs dispersed in the sample with interstitial‐like shapes (Figure 3j).
3.3. Mineral Chemistry: Major and Minor Elements
Olivine in the peridotites is characterized by a wide range of compositions with Mg# [Mg# = Mg/(Mg + Fe)] from 85 to 91.4. Coevolution of olivine modal content and Mg# during partial melting may explain part of the data, but melt‐rock reactions leading to either dunitization or refertilization are required to explain the Fe‐rich olivine compositions (Mg# < 89) in peridotites with highly variable olivine contents (Figure 8a). Very high melt‐rock ratios are required to account for olivines with Mg# < 88 (Bodinier & Godard, 2014), suggesting that these peridotites might represent reacted wall rock of veins or dykes. There are no significant core‐rim variations in Mg#, except for one equigranular lherzolite, GF9 (Mg# 88.8 in the rims and 89.9 in the cores). However, most Fe‐rich peridotites show heterogeneity in olivine Mg# at the thin section (mm) scale. There is no correlation between the microstructure and olivine Mg# and Ni con-tent. Ni contents in olivine vary from 2,700 to 4,560 ppm (Table S1). The lowest Ni contents in olivines from harzburgites SAL35 and SAL10 are associated with the lowest Mg# (<86), but there is no systematic correla-tion between Mg# and Ni content. Most peridotites show Ni contents in olivine in the range 2,950– 3,300 ppm, in spite of a strong variation in Mg# (88–91.4). The two dunites (PAL8, GF13), as well as coarse‐granular harzburgite PAL1, have olivine with Mg# < 89, but high Ni contents (>3,850 ppm) in oli-vine. In some partially recrystallized peridotites (SAL3, SAL20, PAL1, GF4, GF9, PU5‐6), olivine has lower Ni contents in the rims (−4% to −16%) relatively to the cores.
Orthopyroxene is enstatite with Mg# ranging from 84.5 to 91.7, in equilibrium with Mg# of olivine (Figure 8b). Clinopyroxene is Cr‐rich diopside (Cr2O3= 0.36–1.7 wt.%) with Mg# ranging from 85.7 to
91.7. Mg# in clinopyroxene does not show a unique correlation to the Mg# in olivine (Figure 8c). Comparison of Mg# between olivine, orthopyroxene, and clinopyroxene indicates equilibrium between oli-vine and orthopyroxene in all peridotites, but clinopyroxenes in disequilibrium in many partially recrystal-lized and equigranular peridotites (Figures 8b and 8c). The Mg# ranges and equilibrium states between olivine and pyroxenes observed in the present study (Figures 8b and 8c) are consistent with previous data in Hawaii peridotites (Bizimis et al., 2003; Goto & Yokoyama, 1988; Sen, 1988; Sen et al., 1993). However, the present data set does not corroborate the correlation between Fe enrichment and grain size decrease pre-viously described in Salt Lake peridotites by Goto and Yokoyama (1988). The most extreme Fe enrichment is observed in coarse‐granular peridotites (Figures 8a to 8c).
Both orthopyroxene and clinopyroxene have variable but correlated TiO2contents, ranging between 0.03–
0.25 and 0.05–1.3 wt.%, respectively (Table S1). In both minerals, TiO2contents are anticorrelated with
(a) (d)
(b) (e)
(c) (f)
Figure 8. (a) Whole rock Mg# versus olivine modal content. (b) Orthopyroxene Mg# versus olivine Mg#.
(c) Clinopyroxene Mg# versus olivine Mg#. (d) TiO2content (wt. %) in clinopyroxene versus clinopyroxene modal content compared to theoretical partial melting trends and to refertilization trends documented in the Lherz massif by Le Roux et al. (2007). (e) Al2O3versus Na2O content (wt. %) in clinopyroxene. (f) Spinel Cr# versus olivine Mg#. For comparison, data from previous studies for Hawaii peridotites (Goto & Yokoyama, 1988; Sen, 1988; Sen et al., 1993) are displayed in (b, c, e, f), data for abyssal peridotites from the East Pacific Rise (EPR) compiled by Warren (2016) in (a, f), and Fe‐Mg partition between olivine and clinopyroxene in troctolites from Lissenberg and Dick (2008) in (c). Curves in (a) illustrate compositional evolutions predicted for partial melting (solid black lines) and reactive melt percolation (gray lines) in the mantle (Bodinier & Godard, 2014). Dashed lines show olivine‐forming reactions with melts with different Mg# (numbers of the top of the curves), solid lines, precipitation of clinopyroxene and orthopyroxene with different mass ratios of crystallized minerals versus infiltrated melt (numbers of the top of the curves), and dotted dashed lines show multiple episodes of refertilization, starting with low Mg# melts (74.5), in which the peridotites successively react with the evolved melt resulting from previous infiltration stage. OSMA stands for olivine‐spinel mantle array (Arai, 1994). Error bars represent the variability of compositions within a sample.
age higher Al2O3, Na2O, and Cr2O3and lower CaO contents than peridotites from other localities (Figure 8e
and Table S1), similar to previous data for Oahu peridotites (Bizimis et al., 2003; Sen, 1988; Sen et al., 1993). Spinels show a wide range of compositions (Table S1) with anticorrelated Mg# and Cr# ranging between 12.6–75.3 and 8.4–61.7, respectively. Al‐rich, fertile compositions predominate (Figure 8f). Some samples, independent of microstructural type or locality, display olivines enriched in Fe, spinels enriched in Cr, or both, relatively to the olivine‐spinel mantle array (OSMA; Arai, 1994; Figure 8f). Cr2O3contents in spinel
and clinopyroxene are positively correlated in most samples. TiO2 contents in spinel range between
0.08 wt.% and 1 wt.%, except in dunite PAL8 and in the dunitic and harzburgitic layers of sample GF13C, which have contents of 1.9 wt.%, 3.5 wt.%, and 4.7 wt.%, respectively, consistent with Ti enrichment in spinel during dunite‐forming reactions (Kelemen & Dick, 1995).
Pyroxenite mineral compositions are consistent with previous data on garnet‐spinel pyroxenites from SAL (Keshav et al., 2007; Sen, 1988). Mg# in olivine range from 75–77 in the clinopyroxenites SAL7 and SAL14 to 82.8 in the websterite SAL33 (Table S1). Clinopyroxene and orthopyroxene are in equilibrium with oli-vine. TiO2 and Cr2O3 contents in clinopyroxene are 0.7 wt.% and 0.31 wt.% in the websterite and 1.1–
1.3 wt.% and <0.06 wt.% in the clinopyroxenites. Garnet is Pyr56Alm31Gro13in the clinopyroxenites and
Pyr64Alm23Gro13in the websterite SAL33.
3.4. Trace Element Compositions of Orthopyroxene, Clinopyroxene, and Garnet
The trace element composition of clinopyroxene and garnet from the Salt Lake and Pali peridotites and pyr-oxenites analyzed in the present study (Figure 9) overlaps that of previously studied xenoliths from these localities (Bizimis et al., 2003, 2007; Sen et al., 1993). Although a limited number of samples were analyzed, it sampled almost the entire range of observed compositions.
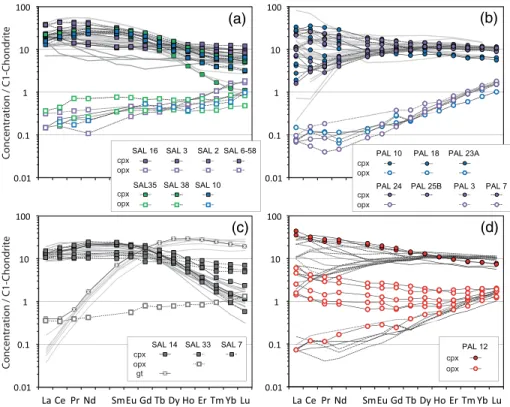
Salt Lake clinopyroxenes are characterized by systematic light Rare Earth Element (LREE) enrichment in both peridotites and pyroxenites. In peridotites (Figure 9a), clinopyroxenes commonly have convex upward chondrite‐normalized REE patterns [(La/Nd)N = 0.6–0.9; (Sm/Yb)N= 2.3–19.8; N = normalized to C1‐
chondrite; Sun & McDonough, 1989], variably depleted heavy REE (HREE) compositions (YbN= 1.2–8.5),
and variable Zr‐Hf anomalies relative to middle REE (MREE) [Zr(‐Hf)/Sm = 0.3–1.8 × primitive mantle; Sun & McDonough, 1989]. LREE enrichment is generally stronger and HREE depletion less prominent in partially recrystallized peridotites (Figure 9a). Partially recrystallized lherzolites SAL16 and SAL6‐58 have distinct clinopyroxene compositions with selective LREE enrichments relative toflatter MREE to HREE seg-ments [(La/Nd)N= 1.6–2.6; (Sm/Yb)N= 0.9–1.3] and systematic negative Zr‐Hf anomalies relative to REE
[Zr(‐Hf)/Sm = 0.3–0.7 × primitive mantle; Sun & McDonough, 1989].
Clinopyroxenes in Salt Like pyroxenites (Figure 9c) also show these two patterns. Clinopyroxenites SAL7 and SAL14 have convex upward chondrite‐normalized REE patterns [(La/Nd)N = 0.6; (Sm/Yb)N = 8–
25.7] and depleted HREE (YbN = 0.9–2.9), while websterite SAL33 displays flatter REE patterns [(La/
Nd)N = 0.9–1; (Sm/Yb)N = 1.9–2]. These compositions indicate extensive clinopyroxene reequilibration
with, and/or precipitation after, LREE‐enriched melts. Orthopyroxenes in Salt Lake peridotites and in web-sterite SAL33 have relatively homogeneous REE patterns characterized by a steady decrease from HREE to LREE [(Ce/Yb)N= 0.1–0.5]. Their compositions are similar or slightly enriched relative to calculated values
of depleted mid‐oceanic ridge basalts (MORB) mantle (DMM) orthopyroxene (D'Errico et al., 2016). These characteristics support extensive reequilibration with LREE‐rich melts having cogenetic links through melt‐rock reaction processes. Coupled trace element and isotopic studies showed that peridotites with con-vex upward REE patterns in clinopyroxenes equilibrated with the melts forming the late Honolulu alkaline olivine basalt series concurrently with the crystallization of garnet‐spinel pyroxenites, which explains their
variable HREE depletion, while peridotites withflat HREE patterns equilibrated with melts formed by a clinopyroxene dissolution‐orthopyroxene precipitation reaction at decreasing melt mass triggered by the percolation of the primitive end‐members of these alkaline olivine basalts into a moderately depleted oceanic mantle lithosphere (Bizimis et al., 2003).
Clinopyroxenes from the Pali peridotites (Figure 9b) have spoon‐shaped patterns with convex upward to flat distributions of MREE to HREE typical of residual clinopyroxenes in abyssal peridotites [(Sm/Yb)N= 0.6–
1.7; e.g., D'Errico et al., 2016], a restricted range of HREE compositions (YbN= 9.9–12.8), and extremely
vari-able LREE fractionations, sometimes within a single sample [(La/Nd)N= 0.25–2.35; (La/Nd)N= 0.5–2.1 in
PAL18]. The most LREE‐enriched clinopyroxenes are HREE depleted [(Sm/Yb)N= 1.3–3; YbN= 6.2–8.5] (cf.
coarse‐porphyroclastic peridotite PAL23A and equigranular peridotite PAL12 in Figures 9b and 9d). Previous studies interpreted these compositions as indicative of small degrees of interaction between a LREE‐rich melt, probably linked to the rejuvenated‐stage Honolulu alkaline olivine basalt series, and ocea-nic lithosphere peridotites (Bizimis et al., 2003; Sen et al., 1993). Pali orthopyroxenes are homogeneous and characterized by a steady decrease from HREE to LREE [(Ce/Yb)N= 0.04–0.15], with compositions
overlap-ping that of orthopyroxenes from abyssal peridotites (e.g., D'Errico et al., 2016). This indicates that they were little affected by melt‐rock interactions, except for equigranular peridotite PAL12. In this sample (Figure 9d), orthopyroxenes have highly variable compositions and fractionations [(Ce/Yb)N= 0.1–2.3], which, together
with the LREE‐rich composition of the clinopyroxenes, support that this equigranular peridotite represents the most reacted end‐member among the studied Pali peridotites.
(a) (b)
(c) (d)
Figure 9. Rare Earth Element (REE) compositions of clinopyroxene, orthopyroxene, and garnet measured in the studied
(a) SAL peridotites, (c) SAL pyroxenites, and (b, d) PAL peridotites. REE compositions are normalized to C1‐chondrites (Sun & McDonough, 1989). In (a), (b), and (d), REE spectra for coarse‐granular peridotites are marked in green, for coarse‐porphyroclastic peridotites in blue, for partially recrystallized peridotites in violet, and for equigranular peridotites in red. In (d), the composition of pyroxenes in equigranular peridotite PAL12 is compared to those of the other PAL peridotites (same line patterns as in b). The REE compositions of clinopyroxene in (a) and (b) are compared to published data for peridotites from Salt Lake Crater (light gray and dark gray patterns for the least and most metasomatized samples) and Pali (light gray patterns), respectively. REE compositions of clinopyroxene and garnet in (c) are compared to published compositions of garnet (light gray patterns) and clinopyroxene (dark gray patterns) in Salt Lake pyroxenites. Data from Bizimis et al. (2003, 2007) and Sen (1988).
which might indicate incomplete reequilibration in response to heat-ing, whereas partially recrystallized peridotites SAL3 and SAL18 show lower rim temperatures relative to core ones. However, most core‐rim variations are within the ±70°C of uncertainty of the ther-mometer. Only coarse‐porphyroclastic peridotite PAL18 shows sig-nificantly lower rim temperatures, denoting cooling. Temperatures estimated using the Ca and Al in orthopyroxene thermometers (Table 1) are similar or higher (most samples) than those obtained with the two‐pyroxene geothermometer. The higher temperatures for orthopyroxene thermometers suggest non‐complete achievement of equilibrium for the slower diffusing Ca and Al (relative to Fe and Mg) in a global cooling history. The higher proportion of non‐equilibrated samples when the Al in orthopyroxene thermometer is considered is consistent with the slower diffusion rates of Al relatively to Ca.On average, Salt Lake peridotites show higher equilibrium temperatures (Figure 10), which may imply equi-libration at higher depths. Grove Farm and Pu'uwai xenoliths display on average lower equilibrium temperatures, suggesting they may sample shallower lithospheric levels. An exception is the partially recrystallized peridotite GF2A, which is equilibrated at >900°C. Interestingly, this sample is among those showing a core‐ rim variation that could denote a late heating event.
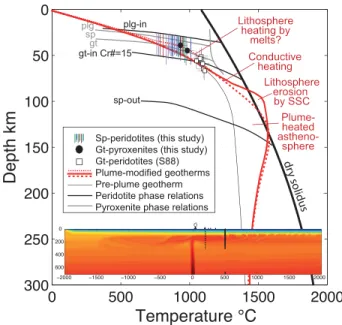
The garnet and spinel pyroxenites SAL14 and SAL33 have equili-brium temperatures and pressures of 1000°C/1.45 GPa and 937° C/1.25 GPa. These pressures and temperatures are on the lower range of the previous thermobarometric determinations on Salt Lake garnet‐bearing xenoliths (Keshav et al., 2007; Sen, 1988). Comparison of these data with geotherms predicted by models simu-lating a plume with a 325°C temperature anomaly impacting a 90 km thick oceanic plate (Agrusta et al., 2015) shows that the equilibrium temperatures of the Salt Lake garnet and spinel pyroxenites are 100– 150° hotter than the modeled geotherm (Figure 11), suggesting additional heating of the lithospheric mantle by melt percolation and crystallization (latent heat). Plotting the equilibrium tempera-tures obtained for the spinel peridotites on the modeled conductive geotherm would imply that they are derived from depths of 35–55 km. Use of the perturbed geotherm that fits the garnet and spinel pyroxenite thermobarometric data lowers the maximum depth to 45 km.
3.6. Crystal‐Preferred Orientations
Figure 12 displays CPO of olivine, orthopyroxene, and clinopyroxene for samples representative of the different microstructural types and, for the partially recrystallized and equigranular peridotites, variable recrystallized area fractions. CPO data for all studied peridotites are presented in Figure S2.
Figure 11. Depth versus temperature diagram comparing the equilibrium
conditions estimated for the Hawaii mantle peridotites and pyroxenites to geotherms predicted downstream of the impact point for a mantle plume with a 325°C thermal anomaly impacting a 90 km thick plate, based on the model presented in the inset at the bottom of thefigure (Agrusta et al., 2015). As no barometers are available for spinel peridotites, pressure ranges are presented as bars, based on the absence of plagioclase and of garnet in the peridotites and their Cr#. The color of the bars indicates the microstructure. Phase transitions after O'Neill (1981) and Klemme (2004). Dry solidus after Ringwood (1975). White squares (S88) indicate Salt Lake garnet peridotite thermobarometry data from Sen (1988).
Figure 10. Core versus rim equilibrium temperatures predicted by the
two‐pyroxene thermometer of Brey and Koehler (1990). Dashed lines define the ±70° uncertainty of the data.
Figure 12. Representative crystal‐preferred orientations (CPOs) of olivine, orthopyroxene, and clinopyroxene for the different microstructural types and, for
partially recrystallized and equigranular peridotites, different recrystallized fractions (% on the top of the sample names). Lower hemisphere stereographic projections with contours at one multiple of uniform distribution intervals. Black arrows indicate pyroxene CPOs not correlated with the olivine ones and gray arrows mark those that are partially correlated (see text for definition of the correlation criterion). Very strong maxima in pyroxenes CPO result from the presence of a few coarse grains in the analyzed area and are not statistically representative. When <100 grains were measured, data are presented as points, instead of density contoured.
Olivine CPO strength and patterns vary in a continuous manner among the different microstructural types (Figure 13). Coarse‐granular and coarse‐porphyroclastic peridotites have strong olivine CPO (J index ≥ 5) with orthorhombic to axial‐[100] patterns, but coarse‐porphyroclastic peridotites have on average CPO pat-terns with a stronger axial‐[100] tendency (0.59 < BA index < 0.82) than coarse‐granular peridotites (0.4 < BA index < 0.76). In partially recrystallized and equigranular peridotites, increase in the recrystallized area fraction is associated with decrease in the CPO strength and with increase in the variability in the oli-vine CPO symmetry (Figure 13). These peridotites have olioli-vine CPO symmetries ranging from axial‐[010] to axial‐[100] (0.27 < BA index < 0.93). However, orthorhombic to axial‐[100] patterns predominate, because the CPOs of the recrystallized grains are more dispersed, but similar to the CPO of the porphyroclasts (Figure S3). In all samples where a shape‐preferred orientation of olivine marks the lineation and foliation, the maximum of olivine [100] axes is subparallel to the lineation and the maximum of [010] is normal to the foliation (Figure 12).
CPOs of both pyroxenes are much more dispersed than the olivine CPO (Figures 12 and S2). Nevertheless, orthopyroxene displays in many samples a CPO correlated with that of olivine, with concentration of [001]opxsubparallel to the [100]olmaximum and weaker maxima of [100]opxor [010]opx(or both) subparallel
to the [010]olmaximum. In some samples, the orthopyroxene CPO is only partially correlated to the olivine
CPO, meaning that other orientations, often at high angle to the maxima described above, are also volume-trically important (gray arrows in Figure 11). Finally, in a few samples, the orthopyroxene CPO is uncorre-lated with the olivine CPO, displaying a strong obliquity to it (black arrow in Figure 12). Coarse‐porphyroclastic peridotite PAL18 (also PAL10, cf. Figure S2) has a correlated orthopyroxene CPO, but it shows a girdle of [001]opxin a plane oblique to the foliation that contrasts with the point concentration
of [100]ol. The degree of correlation between the orthopyroxene and the olivine CPO decreases on average
with increasing recrystallized fraction, but not in a simple linear trend. For instance, equigranular perido-tites in Figure 12 show orthopyroxene CPO rather well correlated with the olivine CPO.
Clinopyroxene CPOs tend to be even weaker than orthopyroxene CPOs. They are often poorly or not corre-lated to the olivine CPO (gray and black arrows in Figure 12). Yet, some samples, like the weakly recrystal-lized peridotite PAL25B and equigranular peridotite SAL37B, show CPO characterized by a [001]cpx
maximum subparallel to the [100]oland [001]opxmaxima, that is, a clinopyroxene CPO well correlated with
both the olivine and orthopyroxene CPO. Other peridotites, like coarse‐porphyroclastic peridotite PAL2, show similar clinopyroxene and orthopyroxene CPO, but that are only partially correlated with the olivine CPO (Figure 12).
Figure 13. (a) Olivine CPO symmetry (BA index) versus CPO strength (J index) in Hawaii peridotites (data presented in
Table 2). (b) Olivine CPO strength (J index) as a function of the recrystallized fraction. In (a), labels indicate the samples with CPO presented in Figure 12. J and BA indexes for mantle xenoliths from Fernando de Noronha (Liu et al., 2019) and Canary Islands (Vonlanthen et al., 2006) in the Atlantic Ocean and French Polynesia in the Pacific Ocean (Tommasi et al., 2004) recalculated using with the same CPO analysis parameters as in the present study are shown for comparison in (a).
3.7. Seismic Properties
We calculated the seismic properties of all studied peridotites at 1000°C and 1.45 GPa, which correspond to the equilibrium conditions of the garnet‐spinel pyroxenite SAL33 (Figure 11). The density, elastic constants, and seismic properties for all individual samples are presented in Tables S3 and S4. The similarity in olivine CPO symmetry (predominance of orthorhombic patterns) results in similar seismic velocity and anisotropy patterns for the majority of the studied Hawaii xenoliths. The intensities of the maximum propagation ani-sotropy of P and of the maximum polarization aniani-sotropy of S waves are positively correlated (Figure 14a). The maximum propagation anisotropy of S2 waves andξ values, which correspond to the azimuthal aniso-tropy of Rayleigh waves and the polarization anisoaniso-tropy of surface waves if theflow direction and the flow plane are horizontal, as expected in a“normal” oceanic lithospheric mantle (Rümpker et al., 1999; Tommasi, 1998), are also correlated (Figure 14b). However, the intensity of these anisotropies varies significantly among the samples (Figures 14a and 14b) due to changes in both the strength of the olivine CPO and the olivine modal content. Variability in the intensity of seismic anisotropy is observed within all microstruc-tural types, but equigranular peridotites have on average lower anisotropies (Figures 14c and 14d). Seismic anisotropy intensity is variable in all well‐sampled localities (for Pu'uwai, we had access to few
(a)
(c) (d)
(b)
Figure 14. Seismic anisotropy of individual samples calculated for a temperature of 1000°C and a pressure of 1.45 GPa.
(a) Maximum S wave polarization anisotropy versus maximum P wave propagation anisotropy. For comparison, data for mantle xenoliths from French Polynesia in the Pacific Ocean (Tommasi et al., 2004) and Fernando de Noronha in the equatorial Atlantic (Liu et al., 2019) are presented. (b) Maximum propagation anisotropy of S2 waves and epsilon (ξ) values, which correspond to the azimuthal anisotropy of Rayleigh waves and the polarization anisotropy of surface waves, respectively, if theflow direction and the flow plane are horizontal, as expected in a “normal” oceanic lithospheric mantle. (c) Maximum S wave polarization anisotropy versus recrystallized fraction. (d) Maximum P‐ and S2 waves propagation anisotropies versus recrystallized fraction.
samples), but average maximum anisotropies are slightly higher for Grove Farm and Salt Lake peridotites relative to Pali (Figure 14).
Since seismic waves average properties over large volumes (tens of kilometers wide), we calculated average seismic properties beneath Oahu and Kauai by averaging the elastic properties of all Salt Lake and Pali peri-dotites and of all Grove Farm and Pu'uwai periperi-dotites, respectively (Table 3). Seismic anisotropy patterns beneath both islands are similar. Thus, we only present the pattern for Oahu, which was calculated based on a larger number of samples (Figure 15). Average seismic properties beneath Oahu are typical of upper mantle rocks deformed under high‐temperature, low‐pressure conditions. P wave velocities range between 7.6 and 8.22 km/s, with a mean at 7.8 km/s. P wave anisotropy is strong (up to 7.9%), with the fastest propa-gation velocities parallel to theflow direction and the slowest velocities normal to the flow plane. S wave polarization anisotropy is also strong (up to 5.2%), with fast polarization parallel to theflow direction. High S wave polarization anisotropy is observed for waves propagating at high angle to theflow direction and low angle to theflow (XY) plane, whereas apparent isotropy is observed for waves propagating within ±30° of theflow direction along the XZ plane. If both the flow direction and the flow plane are horizontal, as expected in the Pacific lithospheric mantle (Rümpker et al., 1999; Tommasi, 1998), Love waves will show weak azimuthal anisotropy (<2%) with a 90° periodicity and fastest propagation (4.6 km/s) at 45° to theflow direction and Rayleigh waves will display strong azimuthal anisotropy (4.3%) with a 180° periodicity and fastest propagation (4.5 km/s) parallel to theflow direction. Surface waves polarization anisotropy will vary as a function of the propagation azimuth, with an azimuthally averagedξ¼vSH2
.
vSV2
of 1.05.
To quantify the effects of the changes in microstructure and associated CPO on the seismic properties, we calculated average seismic properties for each microstructural type (Figure S4). Average patterns for coarse‐granular, partially recrystallized, and equigranular peridotites are almost identical to the one pre-sented in Figure 15. Coarse‐porphyroclastic peridotites display a more hexagonal pattern with a fast symme-try axis, due to the higher proportion of axial‐[100] olivine CPO within this microstructure. However, this
Figure 15. Average seismic properties for Oahu (Salt Lake and Pali) peridotites at 1000°C and 1.45 GPa. From left to right: P wave velocities (Vp; km/s), S wave
polarization anisotropy [AVs = 200 × (Vs1− Vs2)/(Vs1 + Vs2) in %], the bars indicate the orientation of the fast S1 wave polarization plane, S1 wave velocities (Vs1; km/s), S2 wave velocities (Vs2; km/s), and Vp/Vs1 ratio. Lower hemisphere stereographic projections presenting the variation of the property as a function of the propagation direction relative to the structural reference frame (flow direction X and normal to the flow plane Z).
Kauai 1000 1.45 8.9 7.8 6.1 4.5 3.9 4.6 4.7 4.4 1.71 1.05
Note. AVp, maximum P wave propagation anisotropy; AVs, maximum S wave polarization anisotropy; AVs1, maximum propagation anisotropy for the fast S wave; AVs2, maximum propagation anisotropy for the slow S wave;ξ (epsilon), N/L = (1/8*[C11 + C22] − 1/4*C12 + C66/2)/([C44+C55]/2) assuming a hor-izontal foliation.
results solely in minor reduction in the velocities of waves propagating in theflow plane at high angle to the flow direction.
4. Discussion
The present study highlights multiple evidence for modification of the modal composition and mineral chemistry due to interaction between the peridotites composing the Pacific plate and percolating melts. It also documents a variability in microstructure and, to a lesser extent, in olivine and pyroxenes CPO symme-try and intensity. The two processes are generally coupled, although there is no one‐to‐one relation between composition and microstructure.
4.1. Changes in Modal and Mineral Composition Due to Interaction With Plume‐Related Melts
Most studied peridotites, in particular those with coarse‐granular, partially recrystallized, or equigranular microstructures, show enrichment in orthopyroxene or clinopyroxene relative to model peridotite melting trends, suggesting refertilization (Figures 2 and 8a). The interstitial shapes of orthopyroxene and clinopyrox-ene (Figures 3, 5, 6, and 7) and the lack of correlation between the pyroxclinopyrox-enes and the olivine CPOs in many samples (Figure 12) point to crystallization of pyroxenes from a melt after the last main deformation episode that affected this mantle section. Reactive percolation and partial crystallization of basaltic melts, in particu-lar in the lower part of the lithospheric mantle (50‐ to 70‐km depth) beneath Oahu, is also recorded by the relatively common occurrence of spinel‐ and garnet‐bearing pyroxenites among Salt Lake xenoliths (Keshav et al., 2007; Sen, 1988; Sen et al., 1993). Evidence for reactive melt percolation leading to dunitiza-tion is less common (Figure 2), but a few olivine‐rich harzburgites and dunites with coarse‐granular, par-tially recrystallized, or equigranular microstructures are present among the studied peridotites (Table 1). The marked variations in mineral chemistry among samples and, in a lesser extent, within samples (Figure 8) indicate that reactive melt percolation is spatially heterogeneous. This conclusion is consistent with previous petrological and geochemical studies that inferred spatially heterogeneous metasomatism (Bizimis et al., 2003; Ducea et al., 2002; Goto & Yokoyama, 1988; Sen, 1988; Sen et al., 1993). Independent of the melt‐rock reaction type (refertilization or dunitization), reactive melt percolation produced decrease in the Mg# in most studied peridotites (Figures 8a to 8c). Increase in Mg# is solely observed in rare coarse‐granular and recrystallized peridotites. Ti enrichment, due either to increase in the clinopyroxene modal content (further evidence for refertilization) or increase in the Ti content of both clinopyroxene and spinel, is also recorded in many samples, in particular in those with coarse‐granular or recrystallized microstructures (Figure 8d). However, Ti and Fe enrichments are not correlated, implying that the composi-tion of the percolating melts varied in space and, probably, time. Variacomposi-tions in chemical condicomposi-tions through time are, for instance, recorded by the particular microstructure of dunite PAL8, which displays a few oxi-dized olivine porphyroclasts overgrown by non‐oxioxi-dized olivine neoblasts (Figures 7c and 7d), indicating a decrease in oxygen activity. Trace element data for orthopyroxene and clinopyroxene of the Oahu perido-tites (Figure 9) record interactions with alkaline basalts, probably genetically linked to the rejuvenated‐stage Honolulu volcanics (Bizimis et al., 2003). The composition of the reacting melt varied in space and time depending on the degree of melt‐mantle interaction and reactions along the percolation path. Partially recrystallized and coarse‐granular peridotites tend to display more metasomatized REE patterns than coarse‐porphyroclastic peridotites, and the most reacted pyroxenes are observed in the equigranular perido-tite (Figure 9d).
4.2. Changes in the Microstructures and CPO: Melt‐Triggered Recrystallization?
The different microstructures among the Hawaii peridotites were interpreted by Mercier and Nicolas (1975) as recording a gradient infinite strain. In their interpretation, the coarse‐granular peridotites represent undeformed rocks and the porphyroclastic, partially recrystallized, and equigranular microstructures record different stages of a heterogeneously distributed deformation. In this view, the stronger compositional changes observed in partially recrystallized and equigranular would point to melt focusing by the deforma-tion. However, the present study documents a series of observations that do notfit this interpretation. The coarse‐granular peridotites have strong olivine CPO (Figures 12 and 13). This implies that they have been deformed and, subsequently, extensively annealed (recrystallized under static conditions). Grain boundary migration during annealing would result in effective decrease in the dislocation density and