HAL Id: hal-00297534
https://hal.archives-ouvertes.fr/hal-00297534
Submitted on 8 Dec 2005
HAL is a multi-disciplinary open access
archive for the deposit and dissemination of
sci-entific research documents, whether they are
pub-lished or not. The documents may come from
teaching and research institutions in France or
abroad, or from public or private research centers.
L’archive ouverte pluridisciplinaire HAL, est
destinée au dépôt et à la diffusion de documents
scientifiques de niveau recherche, publiés ou non,
émanant des établissements d’enseignement et de
recherche français ou étrangers, des laboratoires
publics ou privés.
measured by eddy covariance and soil enclosure
techniques
M. Pihlatie, J. Rinne, P. Ambus, K. Pilegaard, J. R. Dorsey, Ü. Rannik, T.
Markkanen, S. Launiainen, T. Vesala
To cite this version:
M. Pihlatie, J. Rinne, P. Ambus, K. Pilegaard, J. R. Dorsey, et al.. Nitrous oxide emissions from a
beech forest floor measured by eddy covariance and soil enclosure techniques. Biogeosciences,
Euro-pean Geosciences Union, 2005, 2 (4), pp.377-387. �hal-00297534�
SRef-ID: 1726-4189/bg/2005-2-377 European Geosciences Union
Nitrous oxide emissions from a beech forest floor measured by eddy
covariance and soil enclosure techniques
M. Pihlatie1, J. Rinne1, P. Ambus2, K. Pilegaard2, J. R. Dorsey3,*, ¨U. Rannik1, T. Markkanen4, S. Launiainen1, and T. Vesala1
1Department of Physical Sciences, University of Helsinki, Finland 2Biosystems Department, Risø National Laboratory, Roskilde, Denmark 3Department of Earth Sciences, University of Manchester, UK
4Department of Micrometeorology, University of Bayreuth, Germany
*now at: CNR – ESPM – Ecosystem science, University of California, Berkeley, USA
Received: 17 March 2005 – Published in Biogeosciences Discussions: 20 May 2005
Revised: 22 September 2005 – Accepted: 22 November 2005 – Published: 8 December 2005
Abstract. Spring time nitrous oxide (N2O) emissions from
an old beech (Fagus sylvatica L.) forest were measured with eddy covariance (EC) and chamber techniques. The aim was to obtain information on the spatial and temporal variability in N2O emissions and link the emissions to soil
environmen-tal parameters. Mean N2O fluxes over the five week
measure-ment period were 5.6±1.1, 10±1 and 16±11 µg N m−2h−1 from EC, automatic chamber and manual chambers, respec-tively. High temporal variability characterized the EC fluxes in the trunk-space. To reduce this variability, resulting mostly from random uncertainty due to measuring fluxes close to the detection limit, we averaged the fluxes over one day peri-ods. The variability in the chamber measurements was much smaller and dominated by high small scale spatial variability. The highest emissions measured by the EC method occurred during the first week of May when the trees were leafing and the soil moisture content was at its highest. If chamber tech-niques are used to estimate ecosystem level N2O emissions
from forest soils, placement of the chambers should be con-sidered carefully to cover the spatial variability in the soil N2O emissions. The EC technique, applied in this study, is
a promising alternative tool to measure ecosystem level N2O
fluxes in forest ecosystems. To our knowledge, this is the first study to demonstrate that the EC technique can be used to measure N2O fluxes in the trunk-space of a forest.
1 Introduction
Microbial activity in soil ecosystems is the major source of nitrous oxide (N2O) to the atmosphere. Nitrous oxide acts as
a greenhouse gas in the troposphere accounting for approx-Correspondence to: M. Pihlatie
imately 6% of the radiative forcing of all greenhouse gases. In addition, N2O takes part in ozone depleting reactions in
the stratosphere. An atmospheric life time of 120 years and a global warming potential of about 300 times higher than that of carbon dioxide, in 100-years time horizon, makes N2O an
important factor in the global climate system (IPCC, 2001). Forest soils are a source of N2O to the atmosphere but
the source strengths of different forests are still uncertain. Annual emissions range from near 0 to 20 kg of N2O-N per
hectare, depending on atmospheric N deposition, forest type and management practices (Schmidt et al., 1988; Tietema et al., 1991; Papen and Butterbach-Bahl, 1999; Bowden et al., 2000; Beier et al., 2001). Several soil physical, chemical and biological factors and their interactions control micro-bial N2O production in the soil. In forest ecosystems the
key factors regulating N2O emissions are soil moisture,
tem-perature, and nitrogen availability (Butterbach-Bahl et al., 2002; Schindlbacher et al., 2004; Papen and Butterbach-Bahl, 1999). Increase in soil moisture, temperature or the availability of mineral nitrogen usually stimulates soil mi-crobial processes and consequently N2O production.
High spatial and temporal variability characterizes N2O
emissions from different ecosystems and makes it challeng-ing to reliably estimate the N2O emissions on ecosystem
level (Ambus and Christensen, 1995; Christensen et al., 1996; Weitz et al., 1999; Ishizuka et al., 2005). This spatial and temporal variability results from small scale differences or changes in the substrates for microbial N2O production,
such as nitrate, ammonium and organic material contents. In forest ecosystems one source for the variability in N2O
emis-sions is the death and decay of fine roots, a process that in-creases the availability of nitrogen and carbon substrates for the soil micro-organisms (Silver et al., 2005).
The most commonly used technique in N2O
e.g. Papen and Butterbach-Bahl, 1999; Schulte-Bisping and Brumme, 2003). It has the advantages of being relatively easy and inexpensive to use, and it is especially appropriate when soil fluxes are related to the chemical and microbiolog-ical factors of the soil in small scale. However, soil cham-bers are prone to problems such as: possible modification of the flow at the soil-air interface, un-representativeness of the sampling places, and the disturbance of the chamber collars to the soil ecosystem (see e.g. Hutchinson and Livingston, 2001; Pumpanen et al., 2003; Savage and Davidson, 2003). As opposed to the chamber techniques the micrometeorolog-ical techniques do not disturb the soil and the fluxes are in-tegrated over a large source area giving a tool for ecosystem level flux measurement. Similarly to the automated cham-ber measurements the micrometeorological techniques are often operated continuously and hence give information on the temporal variability in the fluxes.
The most direct micrometeorological flux measurement method, the eddy covariance (EC) method, relies on the mea-surement of variations in vertical wind velocity and trace gas concentration above the source surface with high time res-olution (see e.g. Baldocchi, 2003). The EC method is rou-tinely used to measure fluxes of for example carbon dioxide (CO2) and water vapor (H2O) above vegetation canopies. It
has recently also been adopted for trunk-space measurements of CO2, H2O and NO fluxes (e.g. Yang et al., 1999;
Con-stantin et al., 1999; Wilson and Meyers, 2001; Rummel et al., 2002; Tang et al., 2005). The sub-canopy measurements require steady state conditions, no sources or sinks between the soil surface and measurement height, and an extended level and horizontally homogeneous upwind fetch (Baldoc-chi and Meyers, 1991). According to Wilson and Meyers (2001) the variability of measured fluxes on short time-scales (∼1 h) results mostly from statistical random errors due to single measurement point and finite sampling period. How-ever, the long-term (>1 day) variation of the fluxes is less prone to these sampling errors.
Simultaneous EC and chamber measurements of N2O
fluxes have been conducted on agricultural grassland ecosys-tems, but data from forest ecosystems is lacking (Smith et al., 1994; Christensen et al., 1996; Laville et al., 1997). The spatial variability of N2O emissions from forest ecosystems
has only been addressed using chamber techniques (Ambus and Christensen, 1995; Butterbach-Bahl et al., 2002). To our knowledge, this is the first study to compare EC and chamber techniques to measure N2O fluxes from a forest floor. The
aims of this study were 1) to obtain information on the spa-tial and temporal variability of N2O fluxes, and 2) to link the
variability in N2O emissions to soil environmental
parame-ters.
The measurements took place during the five week field measurement campaign FOXNOTE (Forest Oxidized Nitro-gen Transport Experiment). The experiment was part of the EU project NOFRETETE and took place in an old beech (Fa-gus sylvatica L.) forest in Sorø, Denmark. During the five
week campaign N2O emissions were measured with manual
and automatic chambers, and using the EC technique in the trunk-space of the beech forest. To link the N2O emissions to
environmental parameters, soil extractable mineral nitrogen content, soil temperature and soil moisture, and meteorolog-ical parameters were also measured.
2 Materials and methods
2.1 Site description
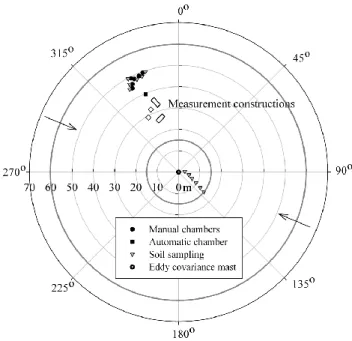
The experiment was conducted in Denmark in the forest Lille Bøgeskov (Small Beech-forest) near Sorø on the is-land of Zeais-land (55◦290N, 11◦390E). The forest is located in a flat terrain and covers about 1.5 square kilometers of mainly of 82 year old beech (Fagus sylvatica L.) trees. Ap-proximately 200 m on the south-east of the measurement site there is a small plantation of Norway spruce (Picea abies (L.) Karsten). The campaign period extended from 2 May to 5 June 2003. The average tree height of beech trees is 25 m and trunk diameter is 38 cm, and the stand density is about 283 stems ha−1 (Pilegaard et al., 2003). Total Leaf Area Index above the measurement height was 5.2 m2m−2 on 26–27 May 2003, as measured with an LAI 2000 Plant Canopy Analyzer (LI-COR, Lincoln, Nebraska, USA). The soil in the area is either Alfisol or Mollisol according to the American Soil Taxonomy system, and it has a pH of 4 to 5 and a 10–40 cm deep organic layer with a C/N ratio of about 20 in the upper organic layers and about 10 in the lower min-eral layers. A detailed description of the site is given in Pi-legaard et al. (2003), and the placing of soil chambers, EC measurement system and soil sampling places are shown in Fig. 1.
2.2 Eddy covariance measurement system
The eddy covariance (EC) measurement system consisted of an ultrasonic 3-D anemometer (Solent 1012, Gill Ltd., Lymington, Hampshire, England) and a tunable diode laser (TDL) trace gas analyzer (TGA100, Campbell Scientific Inc., Logan, Utah, USA). The TDL system consists of a temperature and current controlled single mode diode laser, tuned to an infra red N2O absorption band, mounted in a
liq-uid nitrogen dewar. Concentration measurement is achieved by passing the infra red laser beam through an absorption tube to the sample and reference cells. The reference gas (2000 ppm N2O) is drawn through the reference cell under
same temperature and pressure conditions as the sample air in the sample cell.
The sonic anemometer and the inlet of the TDL were situated below the forest canopy at 3.0 m height (Fig. 2). The sample air was drawn to the TDL analyzer with a Busch rotary-vane pump (RB0021-L) via a diffusive dryer (PD1000, Perma pure Inc.) to remove excess water vapor
Fig. 1. Site map of the beech forest Lille Bøgeskov. Black open cir-cle in the origin represents the eddy covariance mast, black circir-cles the manual chambers, black square the automatic chamber, grey triangles the soil sampling places, and open squares the two mea-surement towers and meamea-surement buildings at the site. Grey lines around the site represent the footprint areas from which 50% (at 15 m) and 85% (at 60 m) of the N2O fluxes originate. Arrows indi-cate prevailing wind directions during the campaign.
that could infer the analysis. Total flow rate of the air en-tering the dryer was 17 l min−1, from which the sample flow
was 14 l min−1 and the purge flow was 3 l min−1, adjusted
with a needle valve and a flow meter attached to the bottom of the dryer, respectively. Sample air leaving the dryer was directed to the TDL analyzer via a 10 m long Teflon tubing with i.d. of 4 mm. The total volume of the inlet system was approximately 0.24 l and that of the sample cell 0.48 l. The residence time in the sample cell was approximately 0.1 s. During the measurement period, pressure inside the sample cells was kept at approximately 70 mbar and the measure-ments were conducted at 10 Hz frequency. The TDL was calibrated once during the measurement period using zero and span (290.3 ppb N2O) calibration gases.
Laurila et al. (2005) used the same system for measuring methane emissions from a municipal landfill. They found the measurement system to have a good high frequency re-sponse with half power frequency of 1.6 Hz and high fre-quency loss of 6% above an open area at the measurement height of 2.5 m.
2.3 Eddy covariance data processing
The vertical flux of the N2O is calculated as the covariance
between the vertical wind velocity (w) and the N2O
concen-tration. Averaging time for flux calculations was 30 min and
TDL
Diffusive dryer
Pump
Sample flow
Purge flow
Fig. 2. Schematic presentation of the eddy covariance (EC) mea-surement system with 3-D anemometer and a TDL analyzer. Ar-rows represent the sample and purge air flow directions in the mea-surement system and the line thickness expresses the inner diameter of the tubing.
all signals were linearly de-trended prior to flux calculations. The lag-time due the residence time of the sample air in the inlet tubing was determined using covariance function be-tween the vertical wind speed and N2O concentration signals.
However, as the fluxes measured were close to the detection limit of the system, the lag-time was not obtained separately for each half-hourly averaging period. Instead, an average lag-time for the whole period was calculated by averaging covariance functions from longer periods. The lag-time ob-tained by this method was two seconds and did not change markedly during the measurements. The lag-time obtained was in the range of the one calculated using the sample flow and volumes of the inlet tubing and the sample cell. The longer averages of the covariance function as well as the au-tocovariance function of the N2O concentration behaved in a
similar way than reported by Wienhold et al. (1994). Since trunk-space EC measurements lack a standard cri-terion for removing low turbulence periods, such as u∗ cri-terion used for above canopy measurements, we filtered the flux data using a criterion for standard deviation of vertical wind speed. All the measurements with standard deviation of vertical wind speed less than 0.07 m s−1 were discarded from further analysis. In these situations the EC-method is not applicable as the turbulent mixing is not sufficient. This threshold limit was found suitable for trunk-space EC
measurements of carbon dioxide at a pine forest site in Fin-land (Launiainen et al., 2005) and also at the site of this study (data not shown). The data filtering removed approximately 78% of the night time (22:00–08:00) data points and about 35% of the day time (08:00–22:00) data points. During the first two weeks of the campaign less data was lost than dur-ing the rest of the campaign when on occasional days almost all of the night time data was removed due to low turbulence. The Lagrangian stochastic trajectory calculation proce-dure (Thomson, 1987) was used for estimation of flux foot-print functions. The simulations were performed releasing 3×10⁴particles from the ground and followed until the up-wind distance from the observation point accounted over 99% of the total flux. A one and half order closure model for neutral stratification by Massman and Weil (1999) was used to parameterize flow statistics within the canopy. A de-tailed description of the model used is given by Markkanen et al. (2003) and Rannik et al. (2000).
According to the footprint analysis, the area contributing 85% to the EC flux lies within 60 m from the EC mast, and the area contributing 50% to the eddy flux lies within 15 me-ters around the measurement mast (Fig. 1).
2.4 Flux detection limit of the eddy covariance system The detection limit of the EC measurement system depends on the signal noise of the TDL instrument (σc)and the stan-dard deviation of vertical wind speed (σw)at the observation level. Flux detection limit (σx)was calculated as
σx=
σwσc
√
Tf (1)
where T is the averaging time and f the measurement fre-quency. The noise level of TDL for N2O (σc)has been esti-mated to be 1 ppb, and the typical standard deviation of ver-tical wind speed (σw)below forest canopy at 3 m height is about 0.15 m s−1. For a 30 min averaging period with 10 Hz measurement frequency the detection limit of the N2O flux
(σx) at Sorø measurement site is 4.6 µg N m−2h−1. For daily mean values of N2O emissions, the detection limit
de-creases to approximately 1 µg N m−2h−1. 2.5 Soil enclosure measurements
Enclosure measurements were conducted with six manual static chambers and one automatic static chamber located north to north-west from the EC mast (Fig. 1). The manual static chamber collars, made of 30 cm diameter and 15 cm long PVC pipes, were pushed ca. 5 cm depth into the soil giving a headspace volume of 7.1 dm3. At the time of gas sampling the chamber collars were closed with Perspex lids equipped with butyl rubber stoppers. Four gas samples were taken at 20 min intervals from the headspace by syringe and needle through the stopper. The manual chamber measure-ments were conducted on weekly basis. Automatic chamber
measurements were conducted with an automated gas sam-pling system (UIT, Dresden, Germany). A 10 cm high stain-less steel collar covering an area of 0.7×0.7 m2was pushed 5 cm into the soil. During a chamber measurement the collar was sealed by a 10 cm high chamber box sliding automat-ically on the collar. During one enclosure three gas sam-ples were taken at 40 min intervals. The automatic chamber was operated in three hour intervals during 7 to 14 May, and thereafter twice a day. All chamber collars had been in place at least 16 weeks prior to the campaign. The gas samples from both manual and automatic chamber systems were in-jected to 3.5 ml pre-evacuated glass vials (Venojects®) un-til analysis by a Shimadzu gas chromatograph 14B (Shi-madzu, Kyoto, Japan) equipped with an Electron Capture Detector, and an automatic headspace sampler (Mikrolab,
˚
Arhus, Denmark). The detection limit for the chamber mea-surements during the measurement period was estimated as 2 µg N m−2h−1.
2.6 Soil measurements
Soil samples were collected on daily basis from 6 to 14 May and thereafter twice a week. The samples were collected from the top 10 cm layer with a 2.5 cm diameter soil core; six samples from the area close to manual soil chambers, and six samples from an area adjacent to the EC measure-ment system (Fig. 1). In total 12 soil samples per each sam-pling day were obtained and frozen on the day of samsam-pling. The soils were melted at +4◦C and sampled for gravimet-ric soil moisture (105◦C; 24 h) and soil extraction with 1M KCl (1:5 w vol−1). Soil extracts were immediately frozen and later analyzed for nitrate (NO3)and ammonium (NH4)
with aBran+Luebbe AutoAnalyzer 3 System (Bran+Luebbe, Norderstedt, Germany). In the field, soil temperature at 2 and 10 cm depths (Pt-100, Risø National Laboratory, Den-mark) and soil volumetric moisture content at 10 cm (TDR, ThetaProbe ML2x, Delta-T) were measured continuously. 2.7 Statistical analysis
Difference between the daily mean fluxes measured by the automatic chamber and the EC were tested during one week period (7 to 14 May) when the automatic chamber was oper-ated every three hours and hence produced up to eight mea-surements per day. Separate comparison of the daily mean EC data and the daily mean chamber data was conducted during two separate days, 7 and 15 May, when both auto-matic and manual chambers were operated. The EC data was sorted to night (22:00–08:00) and day-time (08:00–22:00) data, and separately to wind direction sectors each sector covering 45 degrees (see Fig. 1). The tests of significance of differences between mean fluxes were performed either using a parametric T-test for independent samples or a non-parametric Kruskal-Wallis test (SPSS 12.01, SPSS Inc.). The Pearson correlation analysis was used to test dependencies
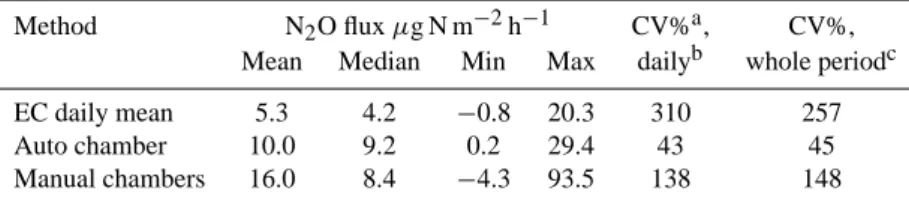
Table 1. Mean, median, minimum and maximum N2O emissions, and the coefficient of variation in the daily averaged eddy covariance
(EC), automatic chamber and manual chamber measurements.
Method N2O flux µg N m−2h−1 CV%a, CV%,
Mean Median Min Max dailyb whole periodc EC daily mean 5.3 4.2 −0.8 20.3 310 257 Auto chamber 10.0 9.2 0.2 29.4 43 45 Manual chambers 16.0 8.4 −4.3 93.5 138 148
aCV%, Coefficient of Variation = (stdev/mean)100%
bMean of all daily coefficients of variation. Daily CV% for the EC includes 3–44 half-hourly flux values per day, automatic chamber
includes 5–8 flux values per day (7–14 May), and manual chambers includes 7 flux values from the 7 chambers per day (6 manual chambers and 1 automatic chamber).
cMean of the CV% over all measurements
between N2O fluxes and soil ammonium, nitrate and
mois-ture contents.
3 Results
3.1 The magnitude and variability of N2O emissions
Average N2O emissions measured with the EC,
auto-matic chamber and manual chambers during the mea-surement period 2 May–5 June were 5.6±1.1, 10±1 and 16±11 µg N m−2h−1, respectively (Table 1). The 10% and 90% percentiles were −6.9 and 19.4 µg N m−2h−1 in the half hourly EC data, 6.0 and 15.0 µg N m−2h−1 in the au-tomatic chamber data and −1.5 and 36.1 µg N m−2h−1 in the manual chamber data. Variation in N2O fluxes over the
whole measurement period, expressed as coefficients of vari-ation, was approximately six times higher in the EC data than in the automatic chamber data, and two times higher in the EC data than in the manual chamber data (Table 1). Most of the variation in the EC fluxes resulted from two factors: statistical uncertainty due to the use of a single measurement point and a rather short finite averaging period (Wilson and Meyers, 2001), and random instrumental errors as the fluxes were measured close to the detection limit.
Daily mean emissions measured by the EC were on av-erage 9 µg N m−2h−1 during the first week of May and on average 4 µg N m−2h−1 during the rest of the cam-paign (Fig. 3a). The highest daily N2O emission to
20 µg N m−2h−1 were measured on the first measurement
day, 2 May (Fig. 3a). Low fluxes were measured between 14 and 24 May after which the emissions peaked again on 25 and 31 May at 8 µg N m−2h−1. Short term variability in the fluxes measured by the EC system, expressed as daily coefficient of variation, was on average 400% during the first half of the measurement period and on average 260% during the last half of the period. The change in the variation was largely due to the change in the TDL setting on 10 May.
Temporal variability in the automatic chamber measure-ments was smaller than that of the EC measuremeasure-ments. The daily coefficient of variation in the automatic chamber data was on average 26% during 7 to 14 May and on average 50% thereafter. N2O emissions measured by the automatic
cham-ber peaked on 12, 18, 25 and 28 May with a maximum daily emission of 17.7 µg N m−2h−1 on 28 May (Fig. 3b). The emissions with manual soil chambers ranged from small neg-ative fluxes to the maximum of 93.4 µg N m−2h−1on 7 May. Spatial variability between the chambers was higher than the temporal variability within the chambers. The temporal co-efficient of variation, calculated as the mean of the coeffi-cients of variation for a single chamber, was 101%, whereas the spatial coefficient of variation, calculated as the mean of daily coefficients of variation between the fluxes measured by different chambers, was 138% (Table 1). One out of six manual chambers gave constantly higher emission val-ues than the other five. If the data from this “hot spot” soil chamber was excluded the average N2O emission over the
whole measurement period was 7.7 µg N m−2h−1instead of 16.0 µg N m−2h−1from all the chambers.
Comparison of the EC and automatic chamber fluxes dur-ing 7 to 14 May shows that on three out of seven days, 7, 10 and 11 May, the fluxes from the automatic chamber were significantly higher than those from the EC measurements (p<0.05, T-test). When the data from the automatic and man-ual chambers were combined, on 7 and 15 May, the chamber and EC fluxes did not differ significantly from each other (p=0.27–0.31).
There was no diurnal cycle in the N2O emissions measured
by the EC or chamber techniques. Night-time (22:00–08:00) N2O emissions measured with the automatic chamber
aver-aged to 9.5±1.1 µg N m−2h−1, and day-time (08:00–22:00) emissions to 10.4±1.3 µg N m−2h−1 (emission ±2×SE). The EC night and day time fluxes averaged to 7.3±1.2 and 5.1±2.2 µg N m−2h−1, respectively. The differences be-tween night and day emissions were not statistically sig-nificant. Mean daily coefficient of variation of 43% in the
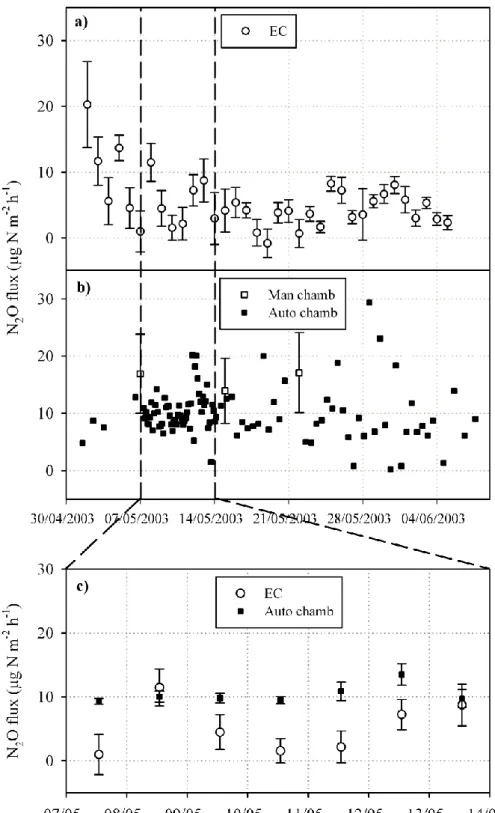
Fig. 3. Nitrous oxide emissions measured by eddy covariance (EC) and chamber techniques. (a) Open circles indicate EC daily mean N2O
emissions ± standard error of the mean (nEC=3-44), (b) Closed squares stand for N2O emission measured by an automatic chamber, and
open squares stand for N2O emissions measured by manual soil chamber. Error bars denote for ±SE (nchambers=6), (c) Comparison of
daily means of the N2O flux measured by the EC and the automatic chamber during 7 to 14 May. Error bars expresses ±SE (nEC=12–38, nchambers=5–8), and n gives the number of measurements used for each mean calculation.
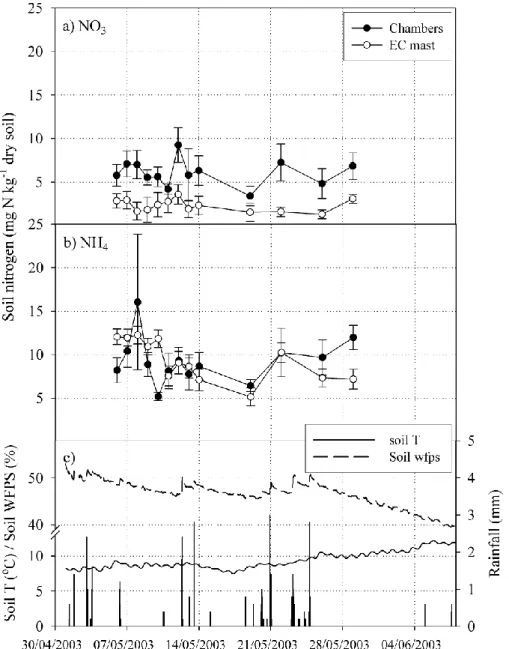
Fig. 4. Soil mineral nitrogen content at 0–10 cm depth of the soil from two areas: close to the soil chambers (black circles), and as an average over all the soil sampling places (open circles). (a) NO3, (b) NH4, (c) soil temperature at 10 cm, soil moisture as percentage of water filled pore space (WFPS%) at 0–6 cm, and rainfall.
automatic chamber data indicates that the diurnal variability in the N2O emissions is very low at that chamber location
(Table 1).
3.2 Influence of soil environmental parameters on N2O
emissions
Soil nitrate (NO3)content fluctuated very little during the
measurement period (Fig. 4a). The two areas, close to the soil chambers and close to the EC mast, differed from each other with respect to soil NO3content (p<0.01). In the area
close to the chambers, NO3content was on average 2.7 times
higher than in the area close to the EC mast (Figs. 4a and
b). Soil NO3peaked on 12 May, after a rainfall event. The
minimum NO3content close to the chambers was measured
on the same day as that of NH4(19 May). Soil NH4content
during the measurement period was on average 9.3 mg N per kg of dry soil (Figs. 4a, b). Temporal variation in soil NH4
was larger than that of soil NO3. Soil NH4content peaked
on 8 May, decreased to a minimum on 19 May, and increased again at the end of May (Fig. 4b).
At the start of the measurement period, soil moisture and NH4contents were at their maximum and soil temperature at
its minimum (Figs. 4b and c). The decrease in soil moisture content throughout the measurement period was disrupted by
Fig. 5. Dependency of daily N2O emissions measured by the EC on
soil mineral nitrogen (NO3and NH4)content during 8 to 19 May
2003.
Fig. 6. Dependency of daily N2O emissions measured by the EC
on soil moisture (wfps%) during 8 to 19 May 2003.
several rainfall events. Soil surface temperature at 10 cm depth increased during the measurement period from ap-proximately 7 degrees of Celsius to 12 degrees of Celsius (Fig. 4c). Fluctuations at the surface were greater than deeper in the soil (data not shown).
The N2O emissions measured with the EC technique
fol-lowed the pattern of soil NO3 and NH4 contents (Figs. 3a
and 4a, b). Emissions of N2O correlated positively with soil
NH4content during a period 8 to 19 May (r2=0.74, p<0.05)
(Fig. 5). The minimum N2O emission was measured on the
same day, 19 May, as the minimum in soil NO3 and NH4
contents. The highest N2O emissions were measured on 2
May when soil moisture was at its highest (above 50% wfps) (Figs. 3a and 4c). The emissions peaked on 13 and on 25 May after a rainfall and consequent increase in soil moisture. Soil N2O emissions correlated positively with soil moisture
content from 8 to 19 May (r2=0.80, p<0.01) (Fig. 6).
Fig. 7. Nitrous oxide emissions from different wind direction sec-tors from the eddy covariance (EC) measurement mast. Black dots represent the mean N2O emission from each of 45 degrees sector, error bars stand for ± standard error of the mean (n=2–260) and the dashed line is drawn to guide the eye of the reader. Numbers in the top of the figure stand for the number of data points from each wind sector.
3.3 Wind direction dependency of N2O fluxes
The average N2O flux was 2–4 µg N m−2h−1 from the
south west direction and above 6 µg N m−2h−1 from all other wind directions (Fig. 7), however, this difference was statistically insignificant (p=0.49). Soil chambers were located north to north-west from the EC mast, a wind sector from which the EC measured a mean N2O
emis-sion of 6.4±2.2 µg N m−2h−1, mean ±SE (Figs. 1 and
7). This flux value is less than the average emission of 15.0±4.9 µg N m−2h−1 measured by the soil chambers on
7, 15 and 22 May.
4 Discussion
We have shown that the chamber techniques and the EC tech-nique deployed in the trunk-space give comparable estimates of the N2O fluxes. During the study period the spatial
vari-ability in the N2O emissions was greater than the temporal
variability. The EC and the chamber fluxes did not differ sig-nificantly from each other except when the EC results were compared to the fluxes from the one automatic chamber only that exhibited a very small temporal coefficient of variation (45%). Christensen et al. (1996) compared EC and cham-ber techniques to measure N2O emissions from an
agricul-tural field. They measured 31 to 55% higher N2O emissions
with the EC technique than with the soil chambers. Still, this difference between the two techniques was within the uncertainty given by the spatial variability of the flux over the measurement area.
In general, we measured much higher variation in the N2O
fluxes with the EC than with the chambers (Table 1). As the fluxes were close to the detection limit of the instrumenta-tion, large part of the variation probably resulted from instru-mental random errors in addition to the statistical sampling uncertainties (Wilson and Meyers, 2001). To decrease this variation and to lower the detection limit we averaged the half hourly flux values over one day periods. This allowed us to compare the low EC fluxes to the results from the cham-bers.
Other causes for the variation in the measured fluxes can be the real temporal and spatial variation in the N2O
emis-sions. At times the soil may have acted as a sink for N2O
as reported by Butterbach-Bahl et al. (1998), Goossens et al. (2001) and Rosenkranz et al. (2005). Indeed, we mea-sured occasionally soil uptake of N2O with the manual soil
chambers. The EC system, averaging fluxes over the foot-print area, may have measured not only zero fluxes but also alternating N2O emissions and N2O uptake. An additional
process, which may increase the variability in the EC data, is N2O emissions from the leaves of the forest trees reported
recently by Pihlatie et al. (2005).
The loss of data during low turbulence periods such as night time has been one of the most negative characteris-tics of the EC method when measuring the exchange of CO2
and H2O. Because we found no diurnal variation in the N2O
emissions, measured by the automatic chamber, the lack of night time measurements does not bias the EC data in this study.
The highest N2O emissions measured with the EC were
measured during the first week of May. This week was rainy and the soil moisture content was at its highest, above 50% of water filled pore space (wfps). In such conditions, anaer-obic microsites may have been created in the soil increasing N2O production by denitrification. Another and parallel
rea-son for higher fluxes during the first week may have been the micrometeorological conditions. As during the period when trees were leafing the requirements for sub-canopy microme-teorological measurements were better fulfilled than later on in the campaign: the canopy of the beech forest remained open and turbulence was more intense in the trunk-space. The beech trees were fully leafed in the middle of May af-ter which also turbulence intensity decreased. A short in-crease in mean wind speed inside the trunk-space was mea-sured during the last measurement week, in June (data not shown).
In previous studies, based on manual chamber measure-ments, the average annual N2O emissions from this beech
forest floor was 5 to 6 µg N m−2h−1 (Ambus et al., 2001; Beier et al., 2001). Our spring time measurements of 6 to 16 µg N m−2h−1 with the EC and chambers, respectively, are in line with this, and also with other emission measure-ments from temperate forest soils (Schmidt et al., 1988; Am-bus and Christensen, 1995; Bowden et al., 2000). In more detail, Beier et al. (2001) studied the total nitrogen cycling
in this beech forest site. They found that the soil NO3 and
NH4contents were similar in areas close to and between tree
stems indicating that the input of nitrogen to the forest floor via stemflow was insignificant to the soil pool of nitrogen. Similarly, Ambus et al. (2001) found no differences in the cumulative N2O emissions measured by chambers from two
areas that differed from each other in soil moisture condi-tions. The results of Ambus et al. (2001) indicate that the ecosystem level variability in N2O emissions in this beech
forest floor is relatively low and, hence, the soil chambers probably cover the spatial variability in the soil fluxes rel-atively well. In our study, however, the soil NO3 content
varied between the two areas of the forest being higher in the area adjacent to the soil chambers than in the area close to the EC mast (Fig. 4a). As the soil chambers were located be-tween 40 to 50 m from the EC mast they contribute less to the eddy flux than the closest tens of meters (Fig. 1). Hence, one reason for the lower N2O fluxes measured by the EC may be
the lower levels of soil substrates, such as NO3, for
micro-bial N2O production in the area surrounding the EC mast as
compared to the area close to the chambers. The lack of soil chambers around the EC mast lowers the reliable compari-son of the EC and the chamber based fluxes. Other factors affecting the comparison are the fact that wind blew only oc-casionally from the north-west direction where the chambers located, and that the EC fluxes were very close to the de-tection limit of the measurement system resulting in a large relative random uncertainty.
The placement of soil chambers is critical in covering the spatial variability of the soil N2O emissions if the data is
used to estimate the ecosystem scale emissions. Since the spatial variability in this forest ecosystem was found to be greater than the temporal variability in the fluxes, the empha-sis should be put on spatial coverage rather than high tem-poral resolution in the measurements. However, our results represent sites with a closed N cycling and low N2O
emis-sions. In ecosystems with greater seasonal changes in the soil available nitrogen, the N2O pulses can contribute more
significantly to the total N2O emissions and hence make
tem-poral variation more important. Our results support the con-clusions of Rummel et al. (2002) that the eddy covariance technique is a promising tool to measure N trace gas fluxes in the trunk-space of a forest. The EC technique used in this study can well be run continuously over extended periods, from several months to years requiring only filling with liq-uid nitrogen and routine checks twice a week. Thus, it can also give information on the seasonal variability in the N2O
fluxes at ecosystem level.
5 Conclusions
We have demonstrated that the EC and the enclosure tech-niques give comparable results of the N2O emissions from
different spatial and temporal scales. Measurements with the chamber technique show a large spatial small scale variation in the N2O fluxes, whereas the EC technique integrates over
the areas of high and low N2O emissions from the soil. For
a true comparison of the two techniques the methods should be applied in a forest ecosystem which has markedly higher N2O fluxes. The data suggests that if N2O emission
measure-ments are based on chamber measuremeasure-ments only, the empha-sis should be put on the placement of the soil chambers to cover the spatial variability in the soil N2O emission. For the
estimation of ecosystem level N2O emissions the large scale
integrative techniques, such as the EC technique, can be a substitutive technique to the enclosure method.
Acknowledgements. European Commission through the project
NOFRETETE (EVK2-CT2001-00106), Magnus Ehrnrooth foun-dation, Nordic Centre of Excellence, Research Unit BACCI and the Finnish Academy financially supported this work. We would also like to thank T. Pohja, E. Siivola and P. T. Sørensen for technical assistance.
Edited by: F. X. Meixner
References
Ambus, P. and Christensen, S.: Spatial and seasonal nitrous ox-ide and methane fluxes in Danish forest-, grassland-, and agroe-cosystems, J. Environ. Qual., 24, 993–1001, 1995.
Ambus, P., Jensen, J. M., Priem´e, A., Pilegaard, K., and Kjøller, A.: Assessment of CH4and N2O fluxes in a Danish beech (Fagus
sylvatica) forest and an adjacent N-fertilised barley (Hordeum vulgare) field: effects of sewage sludge amendments, Nutr. Cycl.
Agroecos., 60, 15–21, 2001.
Baldocchi, D. D. and Meyers, T. P.: Trace gas exchange above the floor of a deciduous forest 1. Evaporation and CO2efflux, J.
Geo-phys. Res., 96(D4), 7271–7285, 1991.
Baldocchi, D. D.: Assessing the eddy covariance technique for evaluating carbon dioxide exchange rater of ecosystems: past, present and future, Global Change Biol., 9, 479–492, 2003. Beier, C., Rasmussen, L., Pilegaard, K., Ambus, P., Mikkelsen,
T., Jensen, N. O., Kj¨oller, A., Prieme, A., and Ladekarl, U. L.: Fluxes of NO−3, NH+4, NO, NO2, and N2O in an old Danish
beech forest, Water, Air and Soil Pollution: Focus 1: 187–195, 2001.
Bowden, R. D., Rullo, G., Stevens, G. R., and Steudler, P. A.: Soil fluxes of carbon dioxide, nitrous oxide, and methane at a produc-tive temperate deciduous forest, J. Environ. Qual., 29, 268–276, 2000.
Butterbach-Bahl, K., Gasche, R., Huber, C. H., Kreutzer, K., and Papen, H.: Inpact of N-input by wet deposition on N-trace gas fluxes and CH4-oxidation in spruce forest ecosystems of the
tem-perate zone in Europe, Atmos. Environ., 32(3), 559–564, 1998. Butterbach-Bahl, K., Rothe, A., and Papen, H.: Effect of tree
dis-tance on N2O and CH4-fluxes from soils in temperate forest
ecosystems, Plant & Soil, 240, 91–103, 2002.
Christensen, S., Ambus, P., Arah, J. R., Clayton, H., Galle, B., Griffith, D. W. T., Hargreaves, K. J., Klemedtsson, L., Lind, A.-M., Maag, A.-M., Scott, A., Skiba, U., Smith, K. A., Welling, A.-M.,
and Wienhold, F. G.: Nitrous oxide emissions from an agricul-tural field: comparison between measurements by flux chamber and micrometeorological techniques, Atmos. Environ., 30(24), 4183–4190, 1996.
Constantin, J., Grelle, A., Ibrom, A., and Morgenstern, K.: Flux partitioning between understorey and overstorey in a boreal spruce/pine forest determined by the eddy covariance method, Agr. Forest Meteorol., 98–99, 629–643, 1999.
Ehhalt, D., Prather, M., Dentener, F., Derwent, R., Dlugokencky, E., Holland, E., Isaksen, I., Katima, J., Kirchhoff, V., Matson, P., Midgley, P., and Wang, M.: Atmospheric Chemistry and Green-house Gases, in: Climate Change 2001: The Scientific Basis, edited by: Houghton, J. T., Ding, Y., Griggs, D. J., et al., 2001 Cambridge University Press, Cambirdge, 881 pp, ISBN 0521-80767-0, 2001.
Goossens, A., De Visscher, A., Boeckz, P., and Van Cleemput, O.: Two-year field study on the emission of N2O from coarse and
middle-textured Belgian soils with different land use, Nutr. Cycl. Agroecos., 60, 23–34, 2001.
Hutchinson, G. L. and Livingston, G. P.: Vents and seals in non-steady-state chambers used for measuring gas exchange between soil and the atmosphere, European J. of Soil Sci., 52, 675–682, 2001.
Ishizuka, S., Iswandi, A., Nakajima, Y., Yonemura, L., Sudo, S., Tsuruta, H., and Muriyarso, D.: Spatial patterns of greenhouse gas emission in a tropical rainforest in Indonesia, Nutr. Cycl. Agroecos., 71(1), 55–62, 2005.
Launiainen, S., Rinne, J., Pumpanen, J., Kulmala, L., Kolari, P., Keronen, P., Siivola, S., Pohja, T., Hari, P., and Vesala, T.: Eddy covariance measurements of CO2and sensible and latent heat
fluxes during a full year in a boreal pine forest trunk-space, Bor. Env. Res., 10, 569–588, 2005.
Laurila, T., Tuovinen, J.-P., Lohila, A., Hatakka, J., Aurela, M., Thum, T., Pihlatie, M., Rinne, J., and Vesala, T.: Measuring methane emissions from a landfill using a cost-effective mi-crometeorological method, Geophys. Res. Lett., 32, 19, L19808, doi:10.1029/2005GL023462, 2005.
Laville, P., H´enault, C., Renault, P., Cellier, P., Oriol, A., Devis, X., Flura, D., and Germon, J. C.: Field comparison of nitrous oxide emission measurements using micrometeorological and chamber methods, Agronomie, 17, 375–388, 1997.
Massman, W. J. and Weil, J. C.: An analytical one-dimensional second-order closure model of turbulence statistics and the La-grangian time scale within and above plant canopies of arbitrary structure, Boundary-Layer Meteorol., 91, 81–107, 1999. Markkanen, T., Rannik, ¨U., Marcolla, B., Cescatti, A., and Vesala,
T.: Footprints and fetches for fluxes over forest canopies with varying structure and density, Boundary-Layer Meteorol., 106, 437–459, 2003.
Papen, H. and Butterbach-Bahl, K.: A 3-year continuous record of nitrogen trace gas fluxes from untreated and limed soil of a N-saturated spruce and beech forest ecosystem in Germany 1. N2O
emissions, J. Geophys. Res., 104(D15), 18 487–18 503, 1999. Pihlatie, M., Ambus, P., Rinne, J., Pilegaard, K., and Vesala, T.:
Plant-mediated nitrous oxide emissions from beech (Fagus
syl-vatica) leaves, New Phytol., 168, 93–98, 2005.
Pilegaard, K., Mikkelsen, T. N., Beier, C., Jensen, N. O., Am-bus, P., and Ro-Poulsen, H.: Field measurements of atmosphere-biosphere interactions in a Danish beech forest, Bor. Environ.
Res., 8, 315–333, 2003.
Pumpanen, J., Kolari, P., Ilvesniemi, H., Minkkinen, K., Vesala, T., Niinist¨o, S., Lohila, A., Larmola, T., Morero, M., Pihlatie, M., Janssens, I., Curiel Yuste, J., Gr¨unzweig, J. M., Reth, S., Subke, J.-A., Savage, K., Kutsch, W., Østreng, G., Ziegler, W., Anthoni, P., Lindroth, A., and Hari, P.: Comparison of different chamber techniques for measuring soil CO2efflux, Agr. Forest Meteorol.,
123, 159–176, 2003.
Rannik, ¨U., Aubinet, M., Kurbanmuradov, O., Sabelfeld, K. K., Markkanen, T., and Vesala, T.: Footprint analysis for measure-ments over a heterogeneous forest, Boundary-Layer Meteorol., 97, 137–166, 2000.
Rosenkranz, P., Br¨uggemann, N., Papen, H., Xu, Z., Seufert, G., and Butterbach-Bahl, K.: N2O, NO and CH4exchange, and
mi-crobial N turnover over a Mediterranean pine forest soil, Biogeo-sciences Discuss., 2, 673–702, 2005,
SRef-ID: 1810-6285/bgd/2005-2-673.
Rummel, U., Ammann, C., Gut, A., Meixner, F. X., and Andreae, M. O.: Eddy covariance measurements of nitric oxide flux within an Amazonian rain forest, J. Geophys. Res., 107(D20), 8050, doi:10.1029/2001JD000520, 2002.
Savage, K. E. and Davidson, E. A.: A comparison of manual and automated systems for soil CO2flux measurements: trade-offs
between spatial and temporal resolution, J. Exp. Bot., 54(384), 891–899, 2003.
Schindlbacher, A., Zechmeister-Bolternstern, S., and Butterbach-Bahl K.: Effects of soil moisture and temperature on NO, NO2,
and N2O emissions from European forest ecosystems, J. Geo-phys. Res., 109, D17302, doi:10.1029/2004JD004590, 2004. Schulte-Bisping, H. and Brumme, R.: Nitrous oxide emission
in-ventory of German forest soils, J. Geophys. Res., 108(D4), 4132, doi:10.1029/2002JD002292, 2003.
Schmidt, J., Seiler, W., and Conrad, R.: Emission of nitrous oxide from temperate forest soils into the atmosphere, J. Atmos. Chem. 6, 95–115, 1988.
Silver, W. L., Thompson, A. W., McGroddy, M. E., Varner, R. K., Dias, J. D., Silva, H., Crill, P., and Kellers, M.: Fine root dy-namics and trace gas fluxes in two lowland tropical forest soils, Global Change Biol., 11, 290–306, 2005.
Smith, K. A., Clayton, H., Arah, J. R. M., Christensen, S., Am-bus, P., Fowler, D., Hargreaves, K. J., Skiba, U., Harris, G. W., Wienhold, F. G., Klemedtsson, L., and Galle, B.: Micrometeoro-logical and chamber methods for measurement of nitrous oxide fluxes between soils and the atmosphere: Overview and conclu-sion, J. Geophys. Res., 99(D8), 16 541–16 548, 1994.
Tang, J., Baldocchi, D. D., and Xu, L.: Tree photosynthesis mod-ulates soil respiration on a diurnal time scale, Global Change Biol., 11, 1298–1304, doi:10.1111/j.1365-2486.2005.00978.x, 2005.
Thomson, D. J.: Criteria for the selection of stochastic models of particle trajectories in turbulent flows, J. Fluid Mech., 180, 529– 556, 1987.
Tietema, A., Bouten, W., and Wartenbergh, P. E.: Nitrous oxide dynamics in an oak-beech forest ecosystem in the Netherlands, For. Ecol. Manage., 44, 53–61, 1991.
Weitz, A. M., Keller, M., Linder, E., and Crill, P. M.: Spatial and temporal variability of nitrogen oxide and methane fluxes from a fertilized tree plantation in Costa Rica, J Geophys. Res., 104(D23), 30 097–30 107, 1999.
Wienhold, F. G., Frahm, H., and Harris, G. W.: Measurements of N2O fluxes from fertilized grassland using a fast response
tun-able diode laser spectrometer, J. Geophys. Res., 99(D8), 16 557– 16 568, 1994.
Wilson, K. B. and Meyers, T. P.: The spatial variability of en-ergy and carbon dioxide fluxes at the floor of a deciduous forest, Boundary-Layer Meteorol., 98, 443–473, 2001.
Yanai, J., Sawamoto, T., Oe, T., Kusa, K., Yamakawa, K., Sakamoto, K., Naganawa, T., Inubushi, K., Ryusuke, H., and Kosaki, T.: Spatial variability of nitrous oxide emissions and their soil-related determining factors in an agricultural field, J. Environ. Qual., 32, 1965–1977, 2003.
Yang, P. C., Black, T. A., Neumann, H. H., Novak, M. D., and Blanken, P. D.: Spatial and temporal variability of CO2
con-centration and flux in a boreal aspen forest, J. Geophys. Res., 104(D22), 27 653–27 661, 1999.