HAL Id: insu-02025944
https://hal-insu.archives-ouvertes.fr/insu-02025944
Submitted on 17 Jul 2019
HAL is a multi-disciplinary open access
archive for the deposit and dissemination of
sci-entific research documents, whether they are
pub-lished or not. The documents may come from
teaching and research institutions in France or
abroad, or from public or private research centers.
L’archive ouverte pluridisciplinaire HAL, est
destinée au dépôt et à la diffusion de documents
scientifiques de niveau recherche, publiés ou non,
émanant des établissements d’enseignement et de
recherche français ou étrangers, des laboratoires
publics ou privés.
Israel With 4,000 Years of Geomagnetic Secular
Variations
Ron Shaar, Erez Hassul, Kate Raphael, Yael Ebert, Yael Segal, Ittai Eden,
Yoav Vaknin, Shmuel Marco, Norbert Nowaczyk, Annick Chauvin, et al.
To cite this version:
Ron Shaar, Erez Hassul, Kate Raphael, Yael Ebert, Yael Segal, et al.. The First Catalog of
Archaeo-magnetic Directions From Israel With 4,000 Years of GeoArchaeo-magnetic Secular Variations. Frontiers in
Earth Science, Frontiers Media, 2018, 6, �10.3389/feart.2018.00164�. �insu-02025944�
Edited by: Yohan Guyodo, UMR7590 Institut de Minéralogie, de Physique des Matériaux et de Cosmochimie (IMPMC), France Reviewed by: Anita Di Chiara, Lancaster University, United Kingdom Chuang Xuan, University of Southampton, United Kingdom *Correspondence: Ron Shaar [email protected] Specialty section: This article was submitted to Geomagnetism and Paleomagnetism, a section of the journal Frontiers in Earth Science Received: 24 May 2018 Accepted: 28 September 2018 Published: 25 October 2018 Citation: Shaar R, Hassul E, Raphael K, Ebert Y, Segal Y, Eden I, Vaknin Y, Marco S, Nowaczyk NR, Chauvin A and Agnon A (2018) The First Catalog of Archaeomagnetic Directions From Israel With 4,000 Years of Geomagnetic Secular Variations. Front. Earth Sci. 6:164. doi: 10.3389/feart.2018.00164
The First Catalog of
Archaeomagnetic Directions From
Israel With 4,000 Years of
Geomagnetic Secular Variations
Ron Shaar1*, Erez Hassul1,2, Kate Raphael1, Yael Ebert1, Yael Segal3,4, Ittai Eden1,Yoav Vaknin5, Shmuel Marco3, Norbert R. Nowaczyk6, Annick Chauvin7and
Amotz Agnon1,2
1The Institute of Earth Sciences, The Hebrew University of Jerusalem, Jerusalem, Israel,2Neev Center for Geoinfomatics,
The Hebrew University of Jerusalem, Jerusalem, Israel,3Department of Geophysics, Tel Aviv University, Tel Aviv, Israel,
4Department of Marine Chemistry, Israel Oceanographic and Limnological Research, National Institute of Oceanography,
Haifa, Israel,5Department of Archaeology and Ancient Near Eastern Cultures, Tel Aviv University, Tel Aviv, Israel,6Helmholtz
Centre Potsdam, GFZ German Research Centre for Geosciences, Potsdam, Germany,7Univ Rennes, CNRS, Géosciences
Rennes, UMR 6118, Rennes, France
The large and well-studied archaeological record of Israel offers a unique opportunity for collecting high resolution archaeomagnetic data from the past several millennia. Here, we initiate the first catalog of archaeomagnetic directions from Israel, with data covering the past four millennia. The catalog consists of 76 directions, of which 47 fulfill quality selection criteria with Fisher precision parameter (k) ≥ 60, 95% cone of confidence (α95)
<6◦ and number of specimens per site (n) ≥ 8. The new catalog complements our published paleointensity data from the Levant and enables testing the hypothesis of a regional geomagnetic anomaly in the Levant during the Iron Age proposed byShaar et al. (2016, 2017). Most of the archaeomagnetic directions show <15◦ angular deviations
from an axial dipole field. However, we observe in the tenth and ninth century BCE short intervals with field directions that are 19◦-22◦different from an axial dipole field and
inclinations that are 20◦-22◦steeper than an axial dipole field. The beginning of the first
millennium BCE is also characterized with fast secular variation rates. The new catalog provides additional support to the Levantine Iron Age Anomaly hypothesis.
Keywords: paleomagnetism, archaeomagnetism, Israel, levantine Iron-Age Anomaly, geomagnetic field, geomagnetic secular variations
INTRODUCTION
Despite decades of intense paleomagnetic research, many details of geomagnetic secular variations have still remained elusive. It is well accepted that secular variations average out globally to an axial dipole field over long geological timescales. Yet, many aspects concerning the spatial and temporal characteristics of secular variations remain unclear, especially when dealing with periods preceding direct human observational data. For example, while regional deviations of field direction from an axial dipole field are widely recognized, neither the degree limits nor the lifetime of these deviations are fully known. Today, the largest deviation from an axial dipole field, between 20◦ and 30◦, occupies a confined area in the southern Atlantic associated with a low field intensity anomaly termed “South Atlantic Anomaly” (SAA) (Thebault et al., 2015). The question whether the SAA is
a typical secular variations characteristic or, instead, a unique geomagnetic phenomenon is yet to be tested. Equivalently, it is not fully understood if rates and amplitudes of secular variations measured during the past few centuries (Jackson et al., 2000) also represent the characteristic behavior of the geomagnetic field in earlier periods. To fill these gaps in knowledge there is a growing need for reliable and precise paleomagnetic datasets in sub-millennial temporal resolution from periods preceding direct measurements of the geomagnetic field.
Archaeomagnetic data from in-situ archaeological structures, such as ovens, furnaces, kilns, and burnt buildings provide an excellent opportunity to capture the direction of the ancient field. When these structures cooled from high temperatures they acquired thermoremanent magnetization (TRM) parallel to the ambient field, thus preserving an instantaneous recording of the ancient field. In many cases, the age of the TRM can be precisely dated using radiocarbon, historical constraints, archaeological correlation, indicative pottery, coins, or a combination of these methods. In this perspective, the long, continuous, well-studied archaeological record of Israel offers a unique opportunity for archaeomagnetic research.
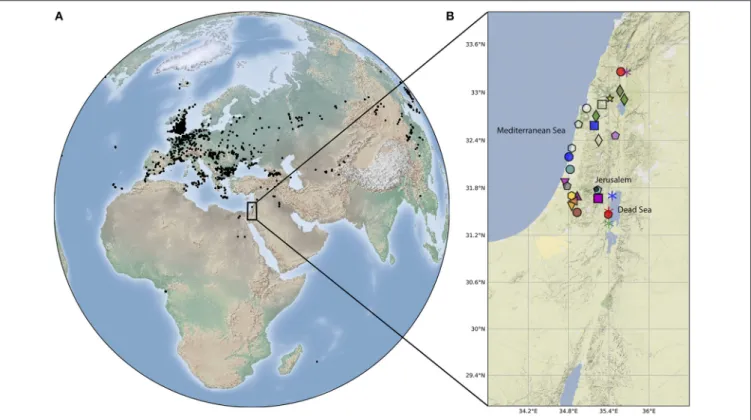
The global role of archaeomagnetic data from Israel is illustrated in Figure 1A, which shows a map of the published archaeomagnetic directional data available in the GEOMAGIA50 database (Korhonen et al., 2008; Brown et al., 2015) from the past four millennia. Our study area is located in an important geographic area that extends the densely scattered data from Europe to the southeast. To date, only several archaeomagnetic directions from Israel were published in journal articles (Aitken and Hawley, 1967; Segal et al., 2003; Shaar et al., 2016; Shahack-Gross et al., 2018). However, there are considerable unpublished data that are available only as unpublished theses (Segal, 2003; Hassul, 2015). The purpose of this work is to gather and compile all the available data from these sources and provide the first catalog of archaeomagnetic directions from Israel. To this end, we have collected the archaeological and the chronological information from the above sources, added new data from 15 additional sites, gathered all the raw paleomagnetic measurement data (if it exists) and translated them to a community standard MagIC format (Tauxe et al., 2016). The combined data were then re-analyzed using identical standards and selection criteria. The resulting catalog includes new secular variations data spanning the past four millennia.
METHODS
Sites and Locations
The Israeli archaeomagnetic catalog is assembled from a collection of several sources: Two unpublished Masters theses: (A)Segal (2003)that also includes two sites published inSegal et al. (2003)and (B)Hassul (2015); Two published articles: (C)
Shaar et al. (2016), and (D)Shahack-Gross et al. (2018); and (E) New data from 15 structures labeled hereafter “this study”. Here, we also revise and augment the directions previously reported in Shaar et al. (2016) with new measurements. Therefore, the paleomagnetic interpretations reported here are slightly different from those previously published and replace the
previous interpretations. In the catalog we follow the standard paleomagnetic hierarchy nomenclature and define “location” as a collection of structures from the same area (i.e., an archaeological site), “site” as a single structure (i.e., cooling unit), “sample” as an oriented piece from a given site, and “specimen” as the part from the sample that was measured.
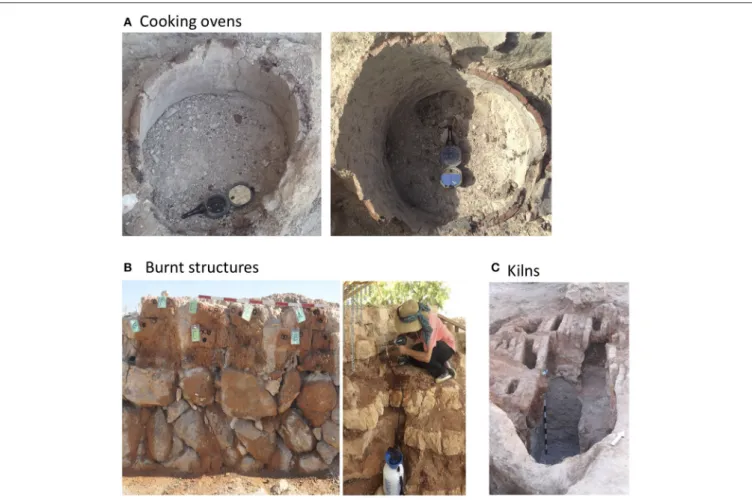
Sites can be classified under one of the three categories shown in Figure 2. Cooking ovens (tabuns, Figure 2A) are rounded structures, typically about 1 m in diameter, frequently found in domestic settings. Although the ovens used fire as a heating source, burnt remains that could be used for radiocarbon dating usually did not survive. Hence, the age of the ovens are typically dated by the age of living stratum in which it was found. Burnt walls (Figure 2B) are in-situ remains of large mud-brick structures, which were burnt as a whole during historical destruction events (e.g., Shahack-Gross et al., 2018). In the case of a large conflagration there may be a large amount of burnt organic material that can be directly dated and cross-correlated with known historical military campaigns, leading to high precision dating, sometimes with an uncertainty of several years (e.g., Tel Megiddo;Finkelstein and Piasetzky, 2009), Tel Hazor (Sandhaus, 2013; Zuckerman, 2013), Tel ‘Eton (Faust, 2008), Bethsaida (Arav, 2014), and Lachish (Ussishkin, 1990)]. Furnaces and kilns (Figure 2C) are large industrial structures that were used to manufacture ceramics. The kilns can be dated from the type of the ceramics and the typology of other finds, such as coins.
The Supplementary Material provides a short summary of the archaeological context and the location of each of the structures. We note that some sites were collected from old and presently inactive excavations, where a revised inspection of the exact archaeological contexts and the corresponding ages is not always possible. Also, in some previously studied sites there might be an ambiguity regarding their precise age because the dates of the corresponding archaeological strata have been refined throughout the years as more archaeo-chronological data have been accumulated. Therefore, we clearly stress the need for a detailed review of the archaeological contexts and the ages in this catalog. This effort requires a thorough and detailed archaeological study that is beyond the scope of this research, but we make such a future investigation possible with the information given in the Supplementary Material.
Sampling and Lab Procedures
Oriented samples were obtained either by drilling standard paleomagnetic cores, 1” in diameter, with a portable electrical drill or by hand samples. In the case of hand samples, orientations of flat surfaces were measured and marked in the field before detaching the oriented samples from the structure (site). In some cases, the material was hardened in the field with epoxy before being measured and removed. Specimens were prepared from the hand samples by sawing small cubes from the sample and gluing them inside non-magnetic paleomagnetic plastic sampling boxes. Samples were oriented in-situ with a Brunton compass prior to detachment and collection for both the cores (using Pomeroy or ASC orientation device) and the hand samples. A declination correction was added to the azimuth measurements
FIGURE 1 | (A,B) Location map. Dots on the world map show locations of all the paleomagnetic data from archaeological and volcanic sources from the past four
millennia available in the GEOMAGIA50 database (Korhonen et al., 2008; Brown et al., 2015). The enlarged map shows locations of archaeomagnetic sites that
passed the acceptance criteria in Table 2 and listed in Table 3. Symbols and colors are as in Figure 3, where closed symbols show data from this study and open
symbols show data fromSegal (2003). Locations of sedimentary cores data shown in Figure 4 are shown with asterisks with the same color code as in Figure 4.
for all sites, except those of Segal (2003) from which we do not have the original measurement data. The latter results in a possible declination offset of theSegal (2003)dataset by 2–3 degrees.
The sampling, the formation, and the condition of the structures (sites) have a considerable effect on the uncertainty of the paleomagnetic directions. Man-made archaeological structures can collapse, break apart, incline or tilt, especially when the archaeological layer had been buried under a heavy overburden before being excavated. Therefore, extra care should be taken during paleomagnetic sampling of archaeological objects. To enable comparison between sites in the catalog, we assign to each site a “site formation quality index” (Qi) with four-scale grading indices (Table 1). The highest score (Qi = 1) is granted when the entire periphery of an oven or kiln was sampled or when several bricks from at least two walls in a burnt structure were sampled. A medium score (Qi = 2) is given when only a segment of a wall, oven, or a furnace was sampled. A low score (Qi = 3) is given to samples with high orientation uncertainty, and Qi=4 indicates poorly oriented samples.
Paleomagnetic Measurements and Data
Analysis
The sample set of Segal (2003) was measured in the paleomagnetic lab in the Geophysical Institute of Israel using a 2G cryogenic magnetometer, and in the paleomagnetic
laboratory at the University of Rennes, France, using a spinner magnetometer and a Leti cryogenic magnetometer. Part of the sample set ofHassul (2015)was measured in the paleomagnetic laboratory at the Helmholtz Centre Potsdam, GFZ Germany using a 2G cryogenic magnetometer. The majority of the data were measured in the paleomagnetic laboratory at the Institute of Earth Sciences, the Hebrew University of Jerusalem using a 2G cryogenic magnetometer. Specimens from all sites underwent progressive demagnetizations with Alternating Field (AF).
All the raw measurement data, except the dataset ofSegal (2003) were translated into the community standard MagIC format (Tauxe et al., 2016) and merged into a single measurement file. All the data with the exception of Segal (2003) were re-analyzed, including previously published data, using the Demag GUI program, which is part of the PmagPy software package (Tauxe et al., 2016). Paleomagnetic directions of specimens and site means were calculated using the principal component analysis technique (Kirschvink, 1980) and Fisher statistics (Fisher, 1953). The interpretations follow a fairly strict set of selection criteria listed in Table 2, accepting only specimens with MAD (Kirschvink, 1980) ≤ 5, DANG (Tauxe and Staudigel, 2004) ≤ 5, and sites with n (number of specimen per site) ≥ 8, k (Fisher, 1953) ≥60, and α95 ≤ 6. The
measurement data and the interpretations (except Segal’s dataset) are available in the MagIC database (https://www2.earthref.org/ MagIC).
FIGURE 2 | Types of archaeomagnegic structures used in this study: (A) Cooking ovens (tabuns) from Herodium (left) and Abel Beth Maacah (right). (B) Burnt structures from Tel ‘Eton (left) and Tel Hazor (right). (C) Ceramic kilns from Yavneh. For a figures and archaeological information of all sites see
Supplementary Material.
TABLE 1 | Site formation Quality Index.
Quality index Description
1 Several bricks from at least two walls in burnt structure; Entire
periphery of a rounded cooking oven or kiln
2 A single wall; A sector of a rounded cooking oven or a furnace
3 Burnt floor; Fired Earth; Unstable part from a
structure/oven/furnace;
4 Original orientation cannot be resolved; Collapsed structure
RESULTS AND DISCUSSION
The catalog consists of 76 paleomagnetic sites collected from 33 different locations (archaeological sites) in Israel. Forty seven sites passing the acceptance criteria in Table 2 are listed in Table 3, and their locations are shown in Figure 1B. The declinations and the inclinations of the accepted sites are shown in Figures 3A,B, where the inclination error bar is the α95value
and the declination error bar is calculated using the equation: △D = sin−1 sin α95
cosI , where D is the declination error and I is the
inclination. Sites that do not pass the criteria in Table 2 are listed
TABLE 2 | Acceptance criteria.
Level Criterion Descriptiona
Specimen MAD ≤ 5 Maximum angular
deviation [1]
DANG ≤ 5 Deviation Angle [2]
Site N ≥ 8
k ≥ 60 Fisher precision index [3]
α95≤6 95% confidence angle [3]
Age uncertainty σage<±100
years
Site formation quality index Qi ≤ 2 See Table 1
aNumber in brackets refer to the following references: [1]:Kirschvink (1980); [2]Tauxe and
Staudigel (2004); [3]Fisher (1953).
in Table 4. In the catalog we distinguish between sites that have all their measurement data available in the MagIC database and can be downloaded and re-interpreted by others using different criteria (labeled “this study” in Tables 3, 4 and marked with filled symbols in Figures 1, 3) and sites of which we have only the site’s mean parameters (labeled “Segal, 2003” in Tables 3, 4 and marked with open symbols in Figures 1, 3).
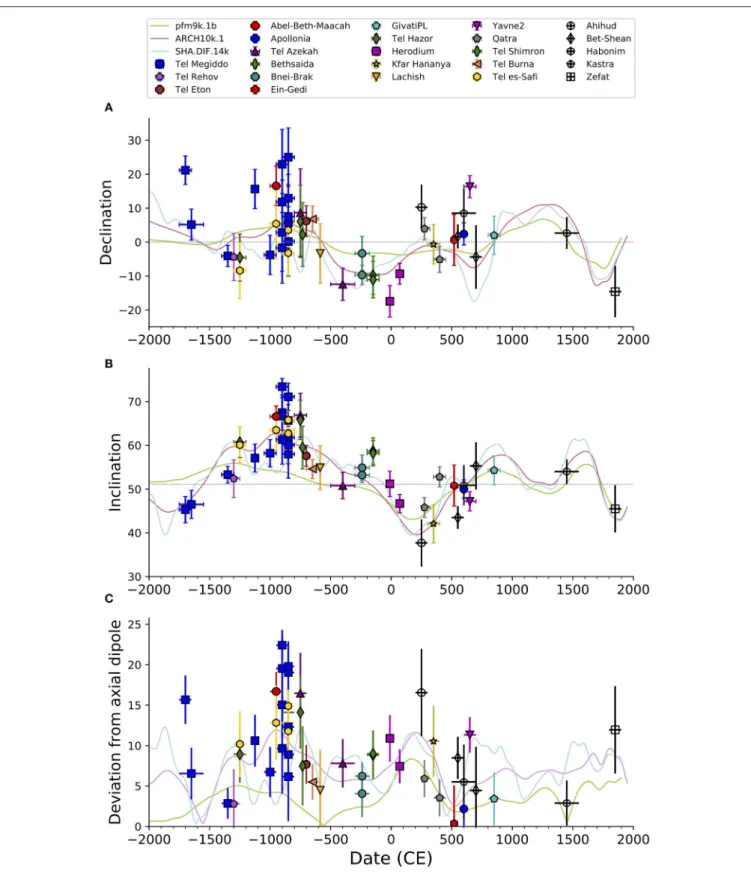
From Figures 3A,B it can be seen that some periods have several coeval sites that show overlapping directions and demonstrate internal consistency and cross correlation between archaeological locations. These include: the fourteenth century BCE with two sites (Tel Megiddo and Tel Rehov); the thirteenth century BCE with two sites (Tel es-Safi and Tel Hazor); the beginning of the eighth century BCE with two sites (Tel Azekah, Tel Hazor,) the end of the eighth century with two sites (Bethsaida, Tel ‘Eton), the third century BCE with two sites (Bnei Brak), and the second century BCE with two sites (Tel Shimron). An exceptional period with inconsistent directions is the tenth to ninth century BCE, which includes 11 sites from Tel Megiddo and Tel es-Safi, with non-overlapping directions. We interpret the latter as a time interval with fast changes in the geomagnetic field, and discuss this result in section Non-axial Dipole Field During the Iron Age Anomaly below.
Comparison With Global Models
The continuous curves in Figure 3 show the predictions of three global spherical harmonic models of the geomagnetic field that use archaeomagnetic data as a data source: ARCH10K.1 (Constable et al., 2016), pfm9k.1b (Nilsson et al., 2014), and SHA.DIF.14k (Pavon-Carrasco et al., 2014). The pfm9k.1b model that is largely based on sedimentary data is smoother than the other two models. To first order, the archaeomagentic-based models nicely predict the trends in the direction of the Levant’s geomagnetic field, but with a lower amplitude. During the past 2.5 millennia only two time intervals do not fit the models: the first century BCE and the seventh century CE. In earlier periods several misfits are observed in pfm9k.1b and SHA.DIF.14k between the eighteenth century BCE and seventh century BCE, especially in periods with high positive declination and high (steep) inclination. Model ARCH10K.1 show the best fit to our data. It is likely that with the new data in the current catalog, misfits will be minimized in future geomagnetic models that will be refined by the new data.
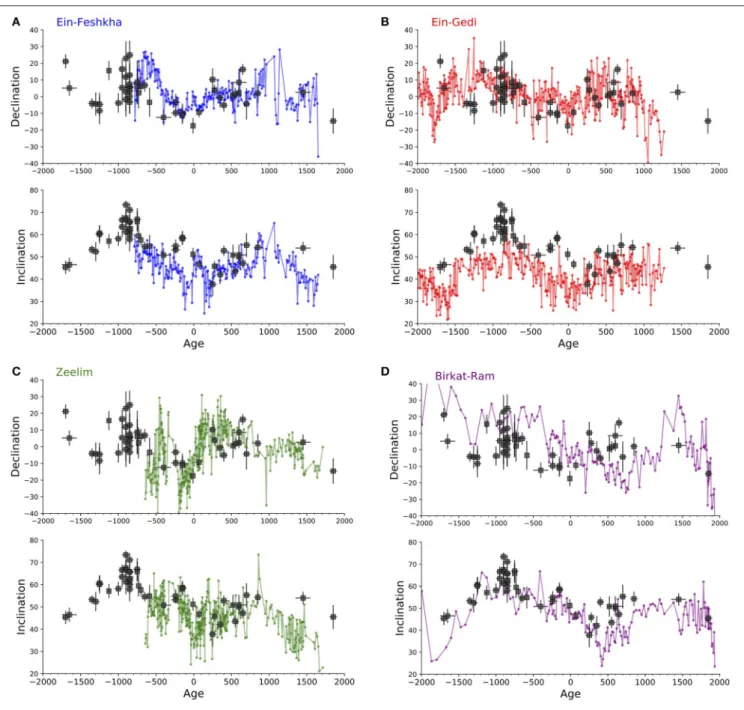
Comparison With Sedimentary Data
There are several advantages of archaeomagnetism over sedimentary magnetic data. The archaeomagnetic TRM does not suffer from inclination shallowing, lock-in depth, and post-depositional effects associated with depositional remanent magnetization (DRM). Hence, paleomagnetic directions from archaeomagnetism can sometimes provide better precision and age control than sedimentary data. However, sedimentary magnetism provides continuous datasets spanning much larger time intervals than archaeomagnetism. Both types of records are available in Israel and we compare them in Figure 4 that shows data from four Holocene cores available in the GEOMAGIA50 database (Brown et al., 2015). Figures 4A–C show data from three piston cores raised from the Holocene Dead Sea (Frank et al., 2007a,b). These cores were obtained without azimuthal orientation andFrank et al. (2007a,b)corrected their declination profile by setting the mean declination value of the core top to zero. Their age model is based on a large number of radiocarbon measurements (Migowski et al., 2004). Given the uncertainty in the age models of the Dead Sea cores, there is
fairly good agreement between the archaeomagnetic and the sedimentary data, especially for the past two millennia. The high inclination values observed in the ninth century BCE are not observed in the sedimentary data. This could be a result of inclination shallowing, post depositional magnetization, and smoothing of the sedimentary data. As the Holocene Dead Sea sediments are dominated by authigenic greigite (Ron et al., 2006; Frank et al., 2007b; Thomas et al., 2016; Ebert et al., 2018) a complicated magnetic acquisition mechanism is expected. Thus, differences between the archaeomagnetic and the sedimentary data are likely. Figure 4D shows data from a core taken in the Birket Ram maar lake in northern Israel, which was dated using only two radiocarbon ages (Frank et al., 2002). Here, the trends in the inclination and the declination profiles agree with the archaeomagnetic data, but the temporal resolution in Birket-Ram is much lower than at the Dead Sea. In summary, we observe a reasonable correlation between the sedimentary and the archaeomagnetic data highlighting the potential of combining these two types of records into a single joint master secular variation curve for the Levant. Yet, owing to the large uncertainties in both the sedimentary magnetic acquisition mechanism and the sedimentary age models this challenge requires a more detailed investigation.
Non-axial Dipole Field During the Iron Age
Anomaly
Shaar et al. (2016, 2017) hypothesized a positive local geomagnetic anomaly in the Levant between 1050 BCE to 750 BCE which they termed “The Levantine Iron Age Anomaly” (LIAA). The paleointensity data from the Levant supporting the LIAA hypothesis (Figure 5A) show high field values between the mid-Eleventh century BCE and the eighth century BCE and two geomagnetic spikes (virtual axial dipole moment, VADM > 160 ZAm2) (Ben-Yosef et al., 2009, 2017; Shaar et al., 2011, 2016). Fourteen sites in Figure 3, from Tel Megiddo, Tel es-Safi, Tel Azekah, Tel Hazor, and Bethsaida cover the interval between 900 and 750 BCE. Of these sites, 12 show inclinations above 60◦, while two sites from Tel Megiddo show exceptionally high inclinations of 73◦(mgq05t2,Shaar et al., 2016) and 71◦(QTMB;
Hassul, 2015; this study), considerably higher than the expected geocentric axial dipole (GAD) inclination in Jerusalem (51◦). We
note that one site in Segal (2003)dataset (Ceramic kiln from Kfar Menachem, see Supplementary Material) showed an even higher inclination of 81◦around this time. Yet, this site did not pass the selection criterion for the age as the age of the kiln was not supported by any direct dating method, only by a correlation with nearby archaeological sites. The declinations during the Levantine Iron Age Anomaly interval show large scatter in the ninth century with declinations ranging from −3◦ to 23◦, and closely grouped values around 5◦in the eighth century. The angle between the archaeomagnetic directions and the axial dipole field (Figure 3C) show exceptionally high values between 19◦and 22◦
around the ninth century in Tel Megiddo. These are from two sites fromShaar et al. (2016)(mgq05t1, mgq05t2) and from two sites from this study (QTMA, QTMB). Today, angular deviations from the axial dipole exceeding 20◦ occur only in the southern
T A B L E 3 | P a le o m a g n e tic m e a n s o f si te s p a ss in g a c c e p ta n c e c rit e ria . L o c a ti o n S it e L a t, L o n Q i T y p e A g e D e c In c n k α9 5 R e fe re n c e s D e v ia ti o n fr o m G A D A b e l-B e th -M a a c a h A B L 6 (3 3 .2 5 7 , 3 5 .5 8 0 ) 1 O ve n − 9 5 0 (− 1 ,0 0 0 , − 9 0 0 ) 1 6 .6 6 5 .5 2 9 1 2 9 2 .4 T h is st u d y 1 6 .7 A p o llo n ia A P L -1 (3 2 .1 9 2 , 3 4 .8 0 7 ) 1 K iln 6 0 0 (5 7 5 , 6 2 5 ) 2 .4 4 9 .5 2 0 2 4 6 2 .1 T h is st u d y 2 .2 B n e i-B ra k B B K 1 (3 2 .0 3 3 , 3 4 .8 2 5 ) 1 K iln − 2 4 0 (− 3 0 0 , − 1 8 0 ) − 9 .7 5 2 .9 6 0 1 1 9 1 .7 T h is st u d y 6 .2 B n e i-B ra k B B K 2 (3 2 .0 3 3 , 3 4 .8 2 5 ) 1 K iln − 2 4 0 (− 3 0 0 , − 1 8 0 ) − 3 .3 5 4 .6 1 2 2 2 4 2 .9 T h is st u d y 4 .1 H e ro d iu m H E R 1 (3 1 .6 6 6 , 3 5 .2 4 2 ) 2 O ve n − 1 0 (− 1 5 , − 4 ) − 1 7 .4 5 1 .3 2 0 1 2 5 2 .9 T h is st u d y 1 0 .9 H e ro d iu m H E R 2 (3 1 .6 6 6 , 3 5 .2 4 2 ) 1 O ve n 7 0 (6 6 ,7 1 ) − 9 .3 4 6 .8 4 1 1 1 7 2 .1 T h is st u d y 7 .4 Q a tr a G E D 1 (3 1 .8 2 2 , 3 4 .7 7 9 ) 1 O ve n 2 7 5 (2 5 0 , 3 2 0 ) 3 .9 4 5 .8 2 5 1 5 5 2 .3 T h is st u d y 5 .9 Q a tr a G E D 2 (3 1 .8 2 2 , 3 4 .7 7 9 ) 1 O ve n 4 0 0 (3 5 0 , 4 5 0 ) − 5 .1 5 2 .7 1 7 2 3 5 2 .3 T h is st u d y 3 .5 Te lB u rn a B U R 2 (3 1 .6 3 4 , 3 4 .8 6 8 ) 1 O ve n − 6 5 0 (− 7 0 0 , − 6 0 0 ) 6 .8 5 4 .8 2 2 2 0 6 2 .2 T h is st u d y 5 .5 Te lE to n Te l-E to n -S tr u c tu re (3 1 .4 8 9 , 3 4 .9 2 8 ) 1 B u rn t S tr u c tu re − 7 0 1 (− 7 0 2 , − 7 0 0 ) 6 .2 5 7 .9 3 1 1 2 1 2 .4 T h is st u d y 7 .7 Te lM e g id d o M G 1 8 T 1 (3 2 .5 8 5 , 3 5 .1 8 4 ) 2 O ve n − 1 ,7 0 0 (− 1 ,7 5 0 , − 1 ,6 5 0 ) 2 1 .2 4 4 .4 1 5 1 6 9 3 T h is st u d y 1 5 .7 Te lR e h o v rv d 0 9 t1 (3 2 .4 5 7 , 3 5 .4 9 8 ) 1 O ve n − 1 ,3 0 0 (− 1 ,3 5 0 , − 1 ,2 5 0 ) − 4 .4 5 1 .7 8 1 6 5 4 .3 T h is st u d y 2 .8 Te lS h im ro n S H M T 1 (3 2 .7 0 3 , 3 5 .2 1 0 ) 2 O ve n − 1 5 0 (− 2 0 0 , − 1 0 0 ) − 9 .8 5 7 .9 1 7 1 3 9 3 T h is st u d y 8 .8 Te lS h im ro n S H M T 2 (3 2 .7 0 4 , 3 5 .2 1 0 ) 1 O ve n − 1 5 0 (− 2 0 0 , − 1 0 0 ) − 1 1 .1 5 7 .4 2 1 1 1 9 2 .9 T h is st u d y 9 .0 Y a vn e 2 Y R 2 (3 1 .8 6 3 , 3 4 .7 4 8 ) 1 K iln 6 5 0 (6 0 0 , 7 0 0 ) 1 6 .3 4 7 .2 2 9 1 4 7 2 .2 T h is st u d y 1 1 .3 Te lM e g id d o m g h 1 2 t1 (3 2 .5 8 5 , 3 5 .1 8 4 ) 1 O ve n − 1 1 2 5 (− 1 ,1 5 0 , − 1 ,1 0 0 ) 1 5 .6 5 6 .4 1 6 1 3 6 3 .2 S h a a r e t a l. (2 0 1 6 ) , T h is st u d y 1 0 .6 Te lM e g id d o m g k0 9 t1 (3 2 .5 8 5 , 3 5 .1 8 4 ) 2 O ve n − 1 ,3 5 0 (− 1 ,4 0 0 , − 1 ,3 0 0 ) − 4 .1 5 2 .4 1 2 5 4 3 1 .9 S h a a r e t a l. (2 0 1 6 ) , T h is st u d y 2 .9 Te lM e g id d o m g q 0 4 t1 (3 2 .5 8 5 , 3 5 .1 8 4 ) 1 O ve n − 8 5 0 (− 9 0 0 , − 8 0 0 ) 5 .6 5 9 .4 1 4 8 6 4 .3 S h a a r e t a l. (2 0 1 6 ) , T h is st u d y 8 .9 Te lM e g id d o m g q 0 5 t1 (3 2 .5 8 5 , 3 5 .1 8 4 ) 1 O ve n − 9 0 0 (− 9 5 0 , − 8 5 0 ) 2 2 .9 6 7 1 5 9 0 4 S h a a r e t a l. (2 0 1 6 ) , T h is st u d y 1 9 .5 Te lM e g id d o m g q 0 5 t2 (3 2 .5 8 5 , 3 5 .1 8 4 ) 2 O ve n − 9 0 0 (− 9 5 0 , − 8 5 0 ) 1 1 .8 7 2 .9 1 5 3 9 6 1 .9 S h a a r e t a l. (2 0 1 6 ) , T h is st u d y 2 2 .4 B e th sa id a B S G (3 2 .9 1 0 , 3 5 .6 3 1 ) 1 B u rn t S tr u c tu re − 7 3 2 (− 7 4 0 , − 7 3 0 ) 2 .2 5 8 .5 1 0 9 9 4 .9 H a ss u l( 2 0 1 5 ) , T h is st u d y 7 .5 E in -G e d i E G T (3 1 .4 6 2 , 3 5 .3 9 2 ) 2 O ve n 5 2 0 (5 0 0 ,5 3 8 ) 0 .6 5 1 .1 1 4 7 2 4 .7 H a ss u l( 2 0 1 5 ) , T h is st u d y 0 .4 G iv a tiP L H G T B (3 1 .7 7 4 , 3 5 .2 3 5 ) 1 O ve n 8 5 0 (8 0 0 , 9 0 0 ) 2 5 4 .3 1 5 1 3 5 3 .3 H a ss u l( 2 0 1 5 ) , T h is st u d y 3 .4 K fa r H a n a n ya B H K (3 2 .9 2 2 , 3 5 .4 1 8 ) 1 F u rn a c e 3 5 0 (3 0 0 , 4 0 0 ) − 0 .6 4 0 .6 1 6 7 1 4 .4 H a ss u l( 2 0 1 5 ) , T h is st u d y 1 0 .5 L a c h is h T L G (3 1 .5 6 5 , 3 4 .8 4 8 ) 2 B u rn t S tr u c tu re − 5 8 6 (− 5 9 0 , − 5 8 0 ) − 3 .3 5 5 .1 1 0 9 5 5 H a ss u l( 2 0 1 5 ) , T h is st u d y 4 .5 Te lA ze ka h A S TA (3 1 .7 0 0 , 3 4 .9 3 0 ) 1 O ve n − 7 5 0 (− 8 0 0 , − 7 0 0 ) 8 .7 6 7 1 5 6 0 5 H a ss u l( 2 0 1 5 ) , T h is st u d y 1 6 .5 Te lA ze ka h A W T (3 1 .7 0 0 , 3 4 .9 3 0 ) 2 O ve n − 4 0 0 (− 5 0 0 , − 3 0 0 ) − 1 2 .4 5 0 .8 2 6 9 1 3 H a ss u l( 2 0 1 5 ) , T h is st u d y 7 .8 Te lH a zo r H K P (3 3 .0 1 7 , 3 5 .5 6 7 ) 1 B u rn t S tr u c tu re − 1 ,2 5 0 (− 1 ,3 0 0 , − 1 ,2 0 0 ) − 4 .5 5 9 .6 1 1 1 7 3 3 .5 H a ss u l( 2 0 1 5 ) , T h is st u d y 8 .9 (C o n ti n u e d )
T A B L E 3 | C o n tin u e d L o c a ti o n S it e L a t, L o n Q i T y p e A g e D e c In c n k α9 5 R e fe re n c e s D e v ia ti o n fr o m G A D Te lH a zo r N T H (3 3 .0 1 7 , 3 5 .5 6 7 ) 1 O ve n − 7 5 0 (− 8 0 0 , − 7 0 0 ) 6 .1 6 4 .8 1 2 9 3 4 .5 H a ss u l( 2 0 1 5 ) , T h is st u d y 1 4 .1 Te lM e g id d o C H E B (3 2 .5 8 5 , 3 5 .1 8 4 ) 1 O ve n − 8 5 0 (− 9 0 0 , − 8 0 0 ) 0 .2 5 7 .2 8 1 0 3 5 .5 H a ss u l( 2 0 1 5 ) , T h is st u d y 6 .2 Te lM e g id d o E Q T (3 2 .5 8 5 , 3 5 .1 8 4 ) 2 O ve n − 9 0 0 (− 9 5 0 , − 8 5 0 ) 2 .9 6 0 .6 1 2 6 2 5 .6 H a ss u l( 2 0 1 5 ) , T h is st u d y 9 .7 Te lM e g id d o M Q T 1 (3 2 .5 8 5 , 3 5 .1 8 4 ) 1 O ve n − 9 0 0 (− 9 5 0 , − 8 5 0 ) − 1 .7 6 6 .1 1 2 1 0 7 4 .2 H a ss u l( 2 0 1 5 ) , T h is st u d y 1 5 .0 Te lM e g id d o M T S L (3 2 .5 8 5 , 3 5 .1 8 4 ) 2 O ve n − 1 ,6 5 0 (− 1 ,7 5 0 , − 1 ,5 5 0 ) 5 .2 4 5 .5 9 2 6 3 3 .2 H a ss u l( 2 0 1 5 ) , T h is st u d y 6 .5 Te lM e g id d o Q T M A (3 2 .5 8 5 , 3 5 .1 8 4 ) 1 O ve n − 8 5 0 (− 9 0 0 , − 8 0 0 ) 2 5 6 5 .1 8 2 3 2 3 .6 H a ss u l( 2 0 1 5 ) , T h is st u d y 1 9 .0 Te lM e g id d o Q T M B (3 2 .5 8 5 , 3 5 .1 8 4 ) 2 O ve n − 8 5 0 (− 9 0 0 , − 8 0 0 ) 7 .5 7 0 .6 1 2 1 9 8 3 .1 H a ss u l( 2 0 1 5 ) , T h is st u d y 1 9 .8 Te le s-S a fi S T 1 (3 1 .7 0 0 , 3 4 .8 4 7 ) 1 O ve n − 9 5 0 (− 1 ,0 0 0 , − 8 0 0 ) 5 .4 6 3 .6 1 5 7 2 4 .6 H a ss u l( 2 0 1 5 ) , T h is st u d y 1 2 .8 Te le s-S a fi S T 2 (3 1 .7 0 0 , 3 4 .8 4 7 ) 2 O ve n − 8 5 0 (− 9 0 0 , − 8 0 0 ) 3 .6 6 5 .9 1 0 5 6 3 2 H a ss u l( 2 0 1 5 ) , T h is st u d y 1 4 .9 Te le s-S a fi S T 3 (3 1 .7 0 0 , 3 4 .8 4 7 ) 2 O ve n − 8 5 0 (− 9 0 0 , − 8 0 0 ) − 3 .2 6 2 .7 1 1 2 0 1 3 .2 H a ss u l( 2 0 1 5 ) , T h is st u d y 1 1 .8 Te le s-S a fi T L F (3 1 .7 0 0 , 3 4 .8 4 7 ) 2 O ve n − 1 ,2 5 0 (− 1 ,3 0 0 , − 1 ,2 0 0 ) − 8 .4 6 0 .1 9 1 5 7 4 .1 H a ss u l( 2 0 1 5 ) , T h is st u d y 1 0 .2 A h ih u d A h ih u d (3 2 .8 0 0 , 3 5 .0 7 0 ) 1 K iln 2 5 0 (2 0 0 , 3 0 0 ) 1 0 .3 3 6 .3 1 0 6 7 .7 5 .4 S e g a l( 2 0 0 3 ) , T h is st u d y 1 6 .5 B e t-S h e a n B e t-S h e a n 2 (3 2 .4 0 0 , 3 5 .2 5 0 ) 2 K iln 7 0 0 (6 5 0 , 7 5 0 ) − 4 .4 5 4 .7 8 8 4 .9 5 .4 S e g a l( 2 0 0 3 ) , T h is st u d y 4 .5 B e t-S h e a n B e t-S h e a n 4 (3 2 .4 0 0 , 3 5 .2 5 0 ) 2 H yp o c a u st 5 5 0 (5 0 0 ,6 0 0 ) 1 .7 4 2 .7 9 3 3 3 .1 2 .6 S e g a l( 2 0 0 3 ) , T h is st u d y 8 .5 H a b o n im H a b o n im (3 2 .3 0 0 , 3 4 .8 5 0 ) 1 O ve n 1 ,4 5 0 (1 ,3 5 0 , 1 ,5 5 0 ) 2 .7 5 3 .5 1 9 1 3 3 .9 2 .8 S e g a l( 2 0 0 3 ) , T h is st u d y 2 .9 K a st ra K a st ra 1 (3 2 .6 0 0 , 3 4 .9 5 0 ) 2 O ve n 6 0 0 (5 0 0 , 7 0 0 ) 8 .5 5 0 1 2 7 7 .7 4 .6 S e g a l( 2 0 0 3 ) , T h is st u d y 5 .5 Z e fa t Z e fa t 2 (3 2 .8 5 0 , 3 5 .3 0 0 ) 1 B u rn t P it 1 ,8 5 0 (1 ,8 0 0 , 1 ,9 0 0 ) − 1 4 .6 4 4 .2 8 8 2 .5 5 .4 S e g a l( 2 0 0 3 ) , T h is st u d y 1 1 .9 Te lM e g id d o M G D A -E ,H -I (3 2 .5 8 5 , 3 5 .1 8 4 ) 1 B u rn t S tr u c tu re − 1 ,0 0 0 (− 1 ,0 5 0 , − 9 5 0 ) − 3 .8 5 7 .4 2 1 1 0 4 3 .1 S h a h a c k-G ro ss e t a l., 2 0 1 8 6 .7 Te lM e g id d o M G D F (3 2 .5 8 5 , 3 5 .1 8 4 ) 2 B u rn t S tr u c tu re − 8 5 0 (− 9 0 0 , − 8 0 0 ) 1 2 .9 6 1 .1 1 7 1 1 2 3 .4 S h a h a c k-G ro ss e t a l., 2 0 1 8 1 2 .3
FIGURE 3 | Archaeomagnetic directions of sites that passed acceptance criteria (Tables 2, 3) relocated to Jerusalem. (A) Declination. (B) Inclination. (C) Angle
between the archaeomagnetic direction and a geocentric axial dipole field. Lines show predictions of global geomagnetic models [(Nilsson et al., 2014;
Pavon-Carrasco et al., 2014; Constable et al., 2016)]. Locations of sites map is shown in Figure 1. The highest inclinations, declinations and azimuthal deviations from axial dipole occurred in the ninth century during the Levantine Iron Age Anomaly (Figure 5).
T A B L E 4 | P a le o m a g n e tic m e a n s o f si te s fa ili n g a c c e p ta n c e c rit e ria . L o c a ti o n S it e L a t, L o n Q i T y p e A g e D e c In c n k α9 5 R e fe re n c e s D e v ia ti o n fr o m G A D A kk o TA T (3 2 .9 2 1 , 3 5 .0 8 8 ) 1 O ve n − 6 5 0 (− 7 0 0 , − 6 0 0 ) 1 7 .8 5 2 .1 1 5 5 1 5 .4 H a ss u l( 2 0 1 5 ) , T h is st u d y 1 1 .1 G iv a tiP L H G TA (3 1 .7 7 4 , 3 5 .2 3 5 ) 3 O ve n 3 6 3 (3 0 0 , 4 0 0 ) − 1 5 .6 4 1 .6 4 5 1 1 4 .1 H a ss u l( 2 0 1 5 ) , T h is st u d y 1 4 .3 H e ro d iu m H K T (3 1 .6 6 0 , 3 5 .2 4 1 ) 2 O ve n − 1 0 (− 1 5 , − 4 ) 9 .1 5 6 .2 1 5 5 0 5 .5 H a ss u l( 2 0 1 5 ) , T h is st u d y 7 .4 H e ro d iu m H M T (3 1 .6 6 0 , 3 5 .2 4 1 ) 2 O ve n 7 2 (7 1 , 7 4 ) 4 .7 5 6 8 1 9 1 2 .9 H a ss u l( 2 0 1 5 ) , T h is st u d y 5 .7 H e ro d iu m H T H B (3 1 .6 6 0 , 3 5 .2 4 1 ) 2 O ve n − 1 0 (− 1 5 , − 4 ) − 2 5 .5 4 9 .4 3 7 5 2 .3 H a ss u l( 2 0 1 5 ) , T h is st u d y 1 6 .3 H ip p o s H F T (3 2 .7 7 8 , 3 5 .6 5 9 ) 1 O ve n 7 4 9 (7 0 0 , 7 5 0 ) 6 .9 6 5 .7 1 7 2 4 7 .5 H a ss u l( 2 0 1 5 ) , T h is st u d y 1 5 .0 H ip p o s H S B (3 2 .7 7 8 , 3 5 .6 5 9 ) 3 O ve n 3 6 3 (3 3 0 , 3 8 0 ) − 6 1 .4 − 7 7 2 6 1 8 0 H a ss u l( 2 0 1 5 ) , T h is st u d y 1 3 3 .7 Ja m ju m H JK (3 1 .6 6 9 , 3 5 .1 0 1 ) 2 O ve n 3 0 0 (2 0 0 , 4 0 0 ) 1 .7 4 9 .8 1 4 5 3 5 .5 H a ss u l( 2 0 1 5 ) , T h is st u d y 1 .7 N a b iS a m w ill N S T-A (3 1 .8 3 2 , 3 5 .1 8 0 ) 1 O ve n 6 3 (0 , 1 0 0 ) − 9 .3 4 7 .4 1 4 2 3 8 .4 H a ss u l( 2 0 1 5 ) , T h is st u d y 7 .1 Te lA ze ka h TA N A (3 1 .7 0 0 , 3 4 .9 3 0 ) 2 O ve n − 1 ,0 0 0 (− 1 ,5 0 0 , 1 ,0 0 0 ) − 1 6 .8 3 9 .1 1 2 1 0 2 4 .3 H a ss u l( 2 0 1 5 ) , T h is st u d y 1 6 .8 Te lA ze ka h TA N B (3 1 .7 0 0 , 3 4 .9 3 0 ) 2 O ve n − 1 ,0 0 0 (− 1 ,5 0 0 , 1 ,0 0 0 ) 6 .8 4 4 .7 1 1 2 5 9 .4 H a ss u l( 2 0 1 5 ) , T h is st u d y 7 .8 Te lH a zo r N T H B (3 3 .0 1 7 , 3 5 .5 6 7 ) 2 O ve n − 7 5 0 (− 9 0 0 , − 8 0 0 ) 7 .5 5 7 .6 7 1 5 3 4 .9 H a ss u l( 2 0 1 5 ) , T h is st u d y 7 .9 Te lM e g id d o M T H M (3 2 .5 8 5 , 3 5 .1 8 4 ) 2 O ve n − 1 ,1 0 0 (− 1 ,1 5 0 , − 1 ,0 5 0 ) 0 .6 6 4 .2 6 2 6 1 3 .3 H a ss u l( 2 0 1 5 ) , T h is st u d y 1 3 .1 Y a vn e 1 Y R (3 1 .8 6 4 , 3 4 .7 9 3 ) 3 O ve n 6 6 0 (6 0 0 , 7 0 0 ) − 1 3 .6 3 9 .3 1 1 7 4 5 .3 H a ss u l( 2 0 1 5 ) , T h is st u d y 1 5 .2 A te re t A te re t ki tc h e n (3 2 .9 0 0 , 3 5 .4 0 0 ) 1 O ve n 1 ,1 7 9 (1 ,1 7 8 , 1 ,1 8 0 ) 1 3 4 7 8 5 7 .9 6 .5 S e g a l( 2 0 0 3 ) , T h is st u d y 9 .5 A te re t A te re t lim e h o le (3 2 .9 0 0 , 3 5 .4 0 0 ) 2 O ve n 1 ,1 7 9 (1 ,1 7 8 , 1 ,1 8 0 ) 3 0 .6 4 9 .5 6 9 .2 1 8 .9 S e g a l( 2 0 0 3 ) , T h is st u d y 1 9 .5 B e t-S h e a n B e t-S h e a n 1 (3 2 .4 0 0 , 3 5 .2 5 0 ) 2 K iln 7 0 0 (6 5 0 ,7 5 0 ) − 8 .1 5 6 .3 8 4 7 .7 7 .2 S e g a l( 2 0 0 3 ) , T h is st u d y 7 .1 B e t-S h e a n B e t-S h e a n 3 (3 2 .4 0 0 , 3 5 .2 5 0 ) 2 K iln 7 0 0 (6 5 0 , 7 5 0 ) 0 .7 5 6 7 4 1 .9 8 .2 S e g a l( 2 0 0 3 ) , T h is st u d y 4 .9 K a st ra K a st ra 2 (3 2 .6 0 0 , 3 4 .9 5 0 ) 2 O ve n − 1 0 0 (− 1 5 0 , − 5 0 ) 5 .4 3 9 .5 5 1 0 8 .1 6 S e g a l( 2 0 0 3 ) , T h is st u d y 1 2 .2 K a st ra K a st ra 3 (3 2 .6 0 0 , 3 4 .9 5 0 ) 2 O ve n 5 5 0 (4 0 0 , 7 0 0 ) 4 .4 4 9 .1 3 4 6 5 .3 3 .7 S e g a l( 2 0 0 3 ) , T h is st u d y 3 .4 K fa r m e n a h e m K fa r m e n a h e m (3 1 .7 5 0 , 3 4 .8 0 0 ) 2 K iln − 7 0 0 (− 9 0 0 , − 5 0 0 ) − 6 .7 8 0 .9 9 6 9 .5 5 .6 S e g a l( 2 0 0 3 ) , T h is st u d y 2 9 .9 N a h e f N e h e f 1 (3 2 .8 2 0 , 3 5 .2 0 0 ) 2 K iln 2 5 0 (1 5 0 , 3 5 0 ) − 2 .9 2 6 7 5 9 .8 6 .8 S e g a l( 2 0 0 3 ) , T h is st u d y 2 5 .2 N a h e f N e h e f 2 (3 2 .8 2 0 , 3 5 .2 0 0 ) 2 K iln 2 5 0 (1 5 0 , 3 5 0 ) − 0 .3 3 2 .8 3 4 9 0 .1 3 .7 S e g a l( 2 0 0 3 ) , T h is st u d y 1 8 .3 Y o d fa t Y o d fa t (3 2 .7 2 0 , 3 5 .1 5 0 ) 1 K iln 6 0 (5 0 , 7 0 ) − 1 5 .3 5 5 .2 7 1 4 3 .9 4 .4 S e g a l( 2 0 0 3 ) , T h is st u d y 1 0 .0 Z e fa t Z e fa t 1 (3 2 .8 5 0 , 3 5 .3 0 0 ) 1 B u rn t P it 1 ,8 5 0 (1 ,8 0 0 , 1 ,9 0 0 ) − 1 3 .1 4 1 .4 7 7 2 .1 6 .2 S e g a l( 2 0 0 3 ) , T h is st u d y 1 3 .2 Te lM e g id d o C W V (3 2 .5 8 5 , 3 5 .1 8 4 ) 2 B u rn t S tr u c tu re − 1 ,0 0 0 (− 1 ,1 0 0 , − 7 5 0 ) − 8 .8 5 7 .4 1 2 1 1 1 4 .1 S h a h a c k-G ro ss e t a l., 2 0 1 8 8 .1 Te lM e g id d o IB W (3 2 .5 8 5 , 3 5 .1 8 4 ) 4 B u rn t S tr u c tu re − 1 ,0 0 0 (− 1 ,0 5 0 , − 9 5 0 ) − 1 7 6 .7 5 5 .1 7 5 3 0 .1 S h a h a c k-G ro ss e t a l., 2 0 1 8 7 3 .8 Te lM e g id d o M T Q K (3 2 .5 8 5 , 3 5 .1 8 4 ) 2 O ve n − 1 ,0 0 0 (− 1 ,0 5 0 , − 9 5 0 ) 2 1 .3 6 2 .4 5 7 2 9 .1 S h a h a c k-G ro ss e t a l., 2 0 1 8 1 6 .1 Te lM e g id d o M c w (3 2 .5 8 5 , 3 5 .1 8 4 ) 4 B u rn t S tr u c tu re − 1 ,0 0 0 (− 1 ,0 5 0 , − 9 5 0 ) − 1 0 1 .2 8 1 .3 1 1 8 1 7 .8 S h a h a c k-G ro ss e t a l., 2 0 1 8 4 1 .4
FIGURE 4 | Comparison between sedimentary paleomagnetic data (colored symbols) and archaeomagnetic data from this study (black symbols). (A,C) Dead Sea cores data from Ein-Feshkha (A), Ein-Gedi (B), and Zeelim (C); (D) Birket Ram Maar lake. Sedimentary data were downloaded from the GEOMAGIA50 database (Brown et al., 2015) followingFrank et al. (2002, 2007a,b).
hemisphere in the area affected by the South Atlantic Anomaly (Thebault et al., 2015; Figure 7 inShaar et al., 2016).
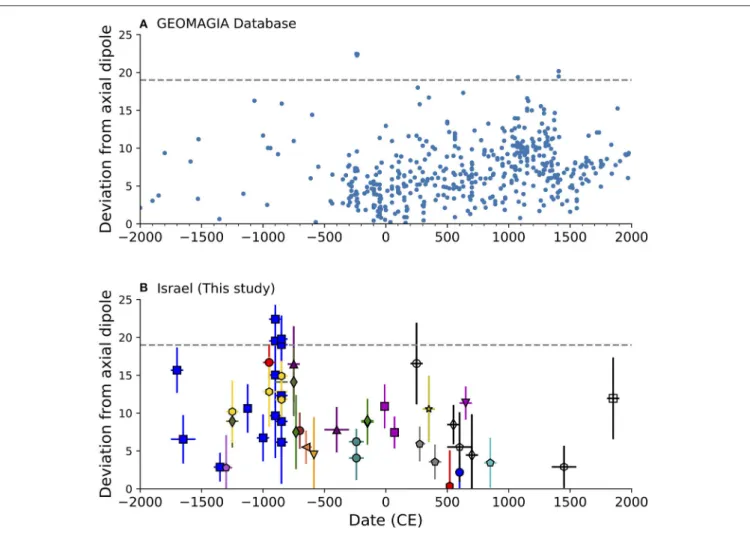
To inspect how irregular is the angular deviation from axial dipole field during the Iron Age Anomaly, we gathered all the global archaeoamgnetic and volcanic data from the past four millennia from the GEOMAGIA50 database (shown in Figure 1A). We applied the same acceptance criteria to the global data, and plot on Figure 6 the angular deviation from axial dipole. Only 1% show angular deviations larger than 19◦, demonstrating that the high inclination high declination episode in the tenth–ninth century BCE is a
unique phenomenon. Altogether the new archaeomagnetic data covering the LIAA show large azimuthal deviations from an axial dipole (Figures 3C, 6) and steep inclinations (Figures 3B, 5B), corroborating the LIAA hypothesis ofShaar et al. (2016, 2017).
Archaeo-Chronological Applications
The forty seven archaeomagnetic data points reported here comprise a significant first step toward a master archaeomagnetic curve for the Levant, from which archaeomagnetic dating can be developed, using an approach similar to that described inLanos (2004)andPavon-Carrasco et al. (2014). Still, even in the absence
FIGURE 5 | The Levantine Iron Age anomaly. (A) Archaeointensity data from the Levant. Data from Israel, Jordan, and Cyprus [compilation of (Shaar et al., 2016) with
data of (Ben-Yosef et al., 2017)] are shown in black, and data from Syria are shown in gray (for references list seeShaar et al., 2016). (B) Inclination profile from this
study, showing that the highest inclinations occur during the Levantine Iron Age anomaly, supporting the hypothesis of a local non-dipolar anomaly.
of a continuous secular variation curve, archaeo-chronological insights can be obtained by merely comparing archaeomagnetic data from structure whose age is not tightly constrained, with the available data. The burnt structure MGDF from Shahack-Gross et al. (2018) is an example of this approach. For dating the destruction that caused the fire at this archaeological level,Shahack-Gross et al. (2018)compared the paleomagnetic direction of MGDF with the available archaeomagnetic directions of periods with known destructions in Megiddo (Late Bronze III, Late Iron I, Iron IIA, and Iron IIB) and found that only one period fit to the archaeomagnetic data. Another promising potential of archaeomagnetism is the opportunity to use archaeomagnetic time-series of fast variation in the geomagnetic field, such as the Iron Age, to complement radiocarbon data, in particular for periods when the radiocarbon calibration curve is flat. For a more detailed review on addressing the Iron Age chronology problems with archaeomagnetism seeStillinger et al. (2016, 2018)andHerve and Lanos (2017).
SUMMARY AND CONCLUSIONS
We initiate here the first catalog of archaeomagnetic directions from Israel, with 76 sites that have been collected and analyzed since 2003. From this catalog, 47 sites pass a set of strict selection criteria and serve as a basis for future development of a master archaeomagnetic secular variation curve for the Levant. The measurement data of this catalog can be approached from MagIC database (https://www2.earthref. org/MagIC) and the archaeological information is provided in the Supplementary Material of this article. Some misfits with the global models prior to the second half of the first millennium BCE imply that more archaeomagnetic data are needed to refine our knowledge of fast secular variations during early periods in the Holocene. The most prominent feature in the new catalog is the high inclinations and high declination interval in the ninth century BCE. During this interval two sites, one published here, and another published inShaar et al.
FIGURE 6 | Angular deviations from axial dipole. (A) Global paleomagnetic data from archaeological and volcanic sources downloaded from the GEOMAGIA50
database passing the acceptance criteria listed in Table 2. (B) This study. The horizontal line shows high values exceeding 19◦during the Levantine Iron Age Anomaly
(Figure 5).
(2016), show steep inclinations exceeding 70◦, while the axial
dipole inclination in Jerusalem area is 51◦. Four other sites,
two published here, and two published in Shaar et al. (2016), show angular deviations from an axial dipole between 19◦ and
22◦. Only <1% of the published archaeomagnetic data from the past four millennia show angular deviations exceeding 19◦ suggesting an unusual field behavior. The large angular deviation occurred during a period with extremely high field intensity in the Levant, providing additional support to the Levantine Iron Age Anomaly hypothesis ofShaar et al. (2016, 2017)of a regional high field anomaly at the beginning of the first millennium BCE.
AUTHOR CONTRIBUTIONS
EH, RS, KR, YE, YS, YV, SM, AA, and IE collected the samples. EH, RS, YE, YS, YV, SM, NN, IE, and AC made or conducted the measurements. All authors contributed to data analyses and manuscript preparation. RS compiled the data, made the final interpretations, figures and tables.
FUNDING
This study was supported by Israel Science Foundation grant 1364/15 to RS and 1181/12 to AA, German-Israeli Foundation (GIF) Young Scientists program grant I-2398-301.8/2015 to RS and Ministry of National Infrastructure, Energy, and Water Resources grant 215-17-027 to RS. Work by IE and YE was supported by Alpha–Research Program in the Sciences of the Future Scientists, Center for the Advancement of the Gifted and Talented in Israel (https://www.madaney.net/en/homepage).
ACKNOWLEDGMENTS
We kindly thank all the archaeologists who helped in the sampling process and provided their most appreciated assistance: Israel Finkelstein (Tel Megiddo), Ruth Shahack Gross (Tel Megiddo), Amihai Mazar (Tel Rehov), Uri Davidovich (Tel Rehov), Aren Maeier (Tel es-Safi), Oded Lipschitss (Tel Azekah), Sharon Zuckerman (Tel Hazor), Shlomit Bechar (Tel Hazor), Amnon Ben-Tor (Tel Hazor), Rami Arav (Bethsaida),
Eli Yannai (Yavne1), Liat Ziv (Yavne2), Ron Beeri (Bnei Brak), Avraham Faust (Tel Eton), Arthur Segal and Michael Eisenberg (Susita-Hippos), Nava Panitz-Cohen (Abel Beth Maacah), Naama Yahalom-Mack (Abel Beth Maacah), Oren Tal (Apollonia), Gideon Hadas (Ein Gedi), Doron Ben-Ami (Givati), Boaz Zissu (Jamjum), Alla Nagorski (Qatra), Itzick Shai (Tel Burna), Mario Martin (Tel Shimron). We wish to thank Yotam Asscher from the Israeli Antiquity Authority (IAA) for his help. We acknowledge the long standing support of
the Israeli Antiquity Authority in the Israeli archaeomagnetic project. We thank Prof. John Hall for his review of the final manuscript.
SUPPLEMENTARY MATERIAL
The Supplementary Material for this article can be found online at: https://www.frontiersin.org/articles/10.3389/feart. 2018.00164/full#supplementary-material
REFERENCES
Aitken, M. J., and Hawley, H. N. (1967). Archaeomagnetic Measurements in Britain—IV. Archaeometry 10, 129–135. doi: 10.1111/j.1475-4754.1967.tb00624.x
Arav, R. (2014). “A chronicle of inevitable destruction: stages in the conquest and destruction of Bethsaida by Tiglath-Pileser III,” in Bethsaida in Archaeology, History and Ancient Culture: A Festschrift in Honor of John Greene, T. ed J. Harold Ellens (Newcastle: Cambridge Scholars Publishing), 2–25.
Ben-Yosef, E., Millman, M., Shaar, R., Tauxe, L., and Lipschits, O. (2017). Six centuries of geomagnetic intensity variations recorded by royal Judean stamped jar handles. P. Natl. Acad. Sci. U.S.A. 114, 2160–2165. doi: 10.1073/pnas.1615797114
Ben-Yosef, E., Tauxe, L., Levy, T. E., Shaar, R., Ron, H., and Najjar, M. (2009). Geomagnetic intensity spike recorded in high resolution slag deposit in Southern Jordan. Earth Planet Sci. Lett. 287, 529–539. doi: 10.1016/j.epsl.2009.09.001
Brown, M. C., Donadini, F., Korte, M., Nilsson, A., Korhonen, K., Lodge, A., et al. (2015). GEOMAGIA50.v3: 1. general structure and modifications to the archeological and volcanic database. Earth Planets Space 67, 1–31. doi: 10.1186/s40623-015-0232-0
Constable,. C., Korte, M., and Panovska, S. (2016). Persistent high paleosecular variation activity in southern hemisphere for at least 10 000 years. Earth Planet Sci. Lett. 453, 78–86. doi: 10.1016/j.epsl.2016. 08.015
Ebert, Y., Shaar, R., Emmanuel, S., Nowaczyk, N., and Stein, M. (2018). Overwriting of sedimentary magnetism by bacterially mediated mineral alteration. Geology 46, 291–294. doi: 10.1130/G39706.1
Faust, A. (2008). Settlement and demography in seventh-century Judah and the extent and intensity of Sennacherib’s campaign. Palest. Explor. Q. 140, 168–194. doi: 10.1179/174313008X341528
Finkelstein, I., and Piasetzky, E. (2009). Radiocarbon-dated destruction layers: a skeleton for Iron Age chronology in the Levant. Oxford J. Archaeol. 28, 255–274. doi: 10.1111/j.1468-0092.2009.00328.x
Fisher, R. A. (1953). Dispersion on a sphere. Proc. Roy. Soc. Lond. 217, 295–305. doi: 10.1098/rspa.1953.0064
Frank, U., Nowaczyk, N. R., and Negendank, J. F. W. (2007a). Palaeomagnetism of greigite bearing sediments from the Dead Sea, Israel. Geophys. J. Int. 168, 904–920. doi: 10.1111/j.1365-246X.2006. 03263.x
Frank, U., Nowaczyk, N. R., and Negendank, J. F. W. (2007b). Rock magnetism of greigite bearing sediments from the Dead Sea, Israel. Geophys. J. Int. 168, 921–934. doi: 10.1111/j.1365-246X.2006.03273.x
Frank, U., Schwab, M. J., and Negendank, J. F. W. (2002). A lacustrine record of paleomagnetic secular variations from Birkat Ram, Golan Heights (Israel) for the last 4400 years. Phys. Earth Planet In. 133, 21–34. doi: 10.1016/S0031-9201(02)00085-7
Hassul, E. (2015). Archaeological Destruction Layers–a Key to High Accuracy Archaeo-Magnetics, Archeo- Seismic and Chronostratigraphy Studies. The Hebrew University of Jerusalem, Jerusalem.
Herve, G., and Lanos, P. (2017). Improvements in Archaeomagnetic Dating in Western Europe from the Late Bronze to the Late Iron Ages: An Alternative to the Problem of the Hallstattian Radiocarbon Plateau. Archaeometry 60, 870–883. doi: 10.1111/arcm.12344
Jackson, A., Jonkers, A. R. T., and Walker, M. R. (2000). Four centuries of geomagnetic secular variation from historical records. Philos. Transac. R. Soc. Lond. Ser. A Math. Phys. Eng. Sci. 358, 957–990. doi: 10.1098/rsta.2000.0569 Kirschvink, J. (1980). The least-squares line and plane and the analysis
of paleomagnetic data. Geophys. J. R. Astronom. Soc. 699–718. doi: 10.1111/j.1365-246X.1980.tb02601.x
Korhonen, K., Donadini, F., Riisager, P., and Pesonen, L. J. (2008). GEOMAGIA50: an archeointensity database with PHP and MySQL. Geochem. Geophys. Geosyst. 9. doi: 10.1029/2007GC001893
Lanos, P. (2004). “Bayesian inference of calibration curves: application to archaeomagnetism,” in Tools for Constructing Chronologies: Crossing Disciplinary Boundaries. eds C. Buck and A. Millard (London: Springer), 43–82. doi: 10.1007/978-1-4471-0231-1_3
Migowski, C., Agnon, A., Bookman, R., Negendank, J. F. W., and Stein, M. (2004). Recurrence pattern of Holocene earthquakes along the Dead Sea transform revealed by varve-counting and radiocarbon dating of lacustrine sediments. Earth Planet Sci. Lett. 222, 301–314. doi: 10.1016/j.epsl.2004.02.015
Nilsson, A., Holme, R., Korte, M., Suttie, N., and Hill, M. (2014). Reconstructing Holocene geomagnetic field variation: new methods, models and implications. Geophys. J. Int. 198, 229–248. doi: 10.1093/gji/ggu120
Pavon-Carrasco, F. J., Osete, M. L., Torta, J. M., and De Santis, A. (2014). A geomagnetic field model for the Holocene based on archaeomagnetic and lava flow data. Earth Planet Sci. Lett. 388, 98–109. doi: 10.1016/j.epsl.2013.11.046 Ron, H., Nowaczyk, N. R., Frank, U., Marco, S., and McWilliams, M. O. (2006).
Magnetic properties of Lake Lisan and Holocene Dead Sea sediments and the fidelity of chemical and detrital remanent magnetization. Geol. Soc. Am. Special Papers 401, 171–182. doi: 10.1130/2006.2401(11)
Sandhaus, D. (2013). Hazor in the Ninth and Eighth Centuries B.C.E. Near East Archaeol. 76, 110–117. doi: 10.5615/neareastarch.76.2.0110
Segal, Y. (2003). Paleomagnetic Secular Variation of the Last 4 Millennia Recorded in Dead Sea Sediments and Archeological Sites in Israel. Tel Aviv University, Tel Aviv.
Segal, Y., Marco, S., and Ellenblum, R. (2003). Intensity and direction of the geomagnetic field on 24 August 1179 measured at Vadum Iacob (Ateret) Crusader fortress, northern Israel. Isr. Earth Sci. J. 52, 203–208. doi: 10.1560/5LEY-1H5Q-ECGQ-BE0T
Shaar, R., Ben-Yosef, E., Ron, H., Tauxe, L., Agnon, A., and Kessel, R. (2011). Geomagnetic field intensity: how high can it get? How fast can it change? Constraints from Iron Age copper slag. Earth Planet Sci. Lett. 301, 297–306. doi: 10.1016/j.epsl.2010.11.013
Shaar, R., Tauxe, L., Goguitchaichvili, A., Devidze, M., and Licheli, V. (2017). Further evidence of the Levantine Iron Age geomagnetic anomaly from Georgian pottery. Geophys. Res. Lett. 44, 2229–2236. doi: 10.1002/2016GL071494
Shaar, R., Tauxe, L., Ron, H., Ebert, Y., Zuckerman, S., Finkelstein, I., et al. (2016). Large geomagnetic field anomalies revealed in Bronze to Iron Age archeomagnetic data from Tel Megiddo and Tel Hazor, Israel. Earth Planet Sci. Lett. 442, 173–185. doi: 10.1016/j.epsl.2016.02.038
Shahack-Gross, R., Shaar, R., Hassul, E., Ebert, Y., Forget, M., Nowaczyk, N., et al. (2018). Fire and collapse: untangling the formation of destruction layers using archaeomagnetism. Geoarchaeology 33, 513–528. doi: 10.1002/gea.21668. Stillinger, M. D., Feinberg, J. M., Ben-Yosef, E., Shaar, R., Hardin,
J. W., and Blakely, J. A. (2018). A rejoinder on the value of archaeomagnetic dating; integrative methodology is the key to addressing
Levantine Iron Age chronology. Near East Archaeol. 81, 141–144. doi: 10.5615/neareastarch.81.2.0141
Stillinger, M. D., Hardin, J. W., Feinberg, J. M., and Blakely, J. A. (2016). Archaeomagnetism as a complementary dating technique to address the Iron Age chronology debate in the levant. Near East Archaeol. 79, 90–106. doi: 10.5615/neareastarch.79. 2.0090
Tauxe, L., Shaar, R., Jonestrask, L., Swanson-Hysell, N. L., Minnett, R., Fairchild, L., et al. (2016). PmagPy: software package for paleomagnetic data analysis and a bridge to the Magnetics Information Consortium (MagIC) Database. Geochem. Geophys. Geosyst. 17, 2450–2463. doi: 10.1002/2016GC 006307
Tauxe, L., and Staudigel, H. (2004). Strength of the geomagnetic field in the Cretaceous normal superchron: new data from submarine basaltic glass of the Troodos Ophiolite. Geochem Geophys Geosyst. 5. doi: 10.1029/2003GC 000635
Thebault, E., Finlay, C. C., Beggan, C. D., Alken, P., Aubert, J., Barrois, O., et al. (2015). International geomagnetic reference field: the 12th generation. Earth Planets Space 67:79. doi: 10.1186/s40623-015-0228-9
Thomas, C., Ebert, Y., Kiro, Y., Stein, M., Ariztegui, D., and Team, D. S. (2016). Microbial sedimentary imprint on the deep Dead Sea sediment. Depos. Rec. 2, 118–138. doi: 10.1002/dep2.16
Ussishkin, D. (1990). The assyrian attack on Lachish: the archaeological evidence from the southwest corner of the site. Tel. Aviv. 17, 53–86.
Zuckerman, S. (2013). Hazor in the early Bronze Age. Near East Archaeol. 76, 68–73. doi: 10.5615/neareastarch.76.2.0068
Conflict of Interest Statement: The authors declare that the research was conducted in the absence of any commercial or financial relationships that could be construed as a potential conflict of interest.
Copyright © 2018 Shaar, Hassul, Raphael, Ebert, Segal, Eden, Vaknin, Marco, Nowaczyk, Chauvin and Agnon. This is an open-access article distributed under the terms of the Creative Commons Attribution License (CC BY). The use, distribution or reproduction in other forums is permitted, provided the original author(s) and the copyright owner(s) are credited and that the original publication in this journal is cited, in accordance with accepted academic practice. No use, distribution or reproduction is permitted which does not comply with these terms.
![FIGURE 5 | The Levantine Iron Age anomaly. (A) Archaeointensity data from the Levant. Data from Israel, Jordan, and Cyprus [compilation of (Shaar et al., 2016) with data of (Ben-Yosef et al., 2017)] are shown in black, and data from Syria are shown in gray](https://thumb-eu.123doks.com/thumbv2/123doknet/14797713.604691/12.892.74.824.97.683/figure-levantine-anomaly-archaeointensity-levant-israel-jordan-compilation.webp)