HAL Id: hal-00297209
https://hal.archives-ouvertes.fr/hal-00297209
Submitted on 4 Jun 2007
HAL is a multi-disciplinary open access
archive for the deposit and dissemination of
sci-entific research documents, whether they are
pub-lished or not. The documents may come from
teaching and research institutions in France or
abroad, or from public or private research centers.
L’archive ouverte pluridisciplinaire HAL, est
destinée au dépôt et à la diffusion de documents
scientifiques de niveau recherche, publiés ou non,
émanant des établissements d’enseignement et de
recherche français ou étrangers, des laboratoires
publics ou privés.
upper troposphere from limb emission spectra of the
Michelson Interferometer for Passive Atmospheric
Sounding (MIPAS)
N. Glatthor, T. von Clarmann, H. Fischer, B. Funke, U. Grabowski, M.
Höpfner, S. Kellmann, M. Kiefer, A. Linden, M. Milz, et al.
To cite this version:
N. Glatthor, T. von Clarmann, H. Fischer, B. Funke, U. Grabowski, et al.. Global peroxyacetyl
nitrate (PAN) retrieval in the upper troposphere from limb emission spectra of the Michelson
Interfer-ometer for Passive Atmospheric Sounding (MIPAS). Atmospheric Chemistry and Physics, European
Geosciences Union, 2007, 7 (11), pp.2775-2787. �hal-00297209�
www.atmos-chem-phys.net/7/2775/2007/ © Author(s) 2007. This work is licensed under a Creative Commons License.
Chemistry
and Physics
Global peroxyacetyl nitrate (PAN) retrieval in the upper
troposphere from limb emission spectra of the Michelson
Interferometer for Passive Atmospheric Sounding (MIPAS)
N. Glatthor1, T. von Clarmann1, H. Fischer1, B. Funke2, U. Grabowski1, M. H¨opfner1, S. Kellmann1, A. Linden1, M. Milz1, T. Steck1, and G. P. Stiller1
1Forschungszentrum Karlsruhe, Institut f¨ur Meteorologie und Klimaforschung, Karlsruhe, Germany 2Instituto de Astrof´ısica de Andaluc´ıa (CSIC), Granada, Spain
Received: 6 December 2006 – Published in Atmos. Chem. Phys. Discuss.: 29 January 2007 Revised: 14 May 2007 – Accepted: 21 May 2007 – Published: 4 June 2007
Abstract. We use limb emission spectra of the Michelson
Interferometer for Passive Atmospheric Sounding (MIPAS) onboard the ENVIronmental SATellite (ENVISAT) to derive the first global distribution of peroxyacetyl nitrate (PAN) in the upper troposphere. PAN is generated in tropospheric air masses polluted by fuel combustion or biomass burning and acts as a reservoir and carrier of NOxin the cold free
tropo-sphere. PAN exhibits continuum-like broadband structures in the mid-infrared region and was retrieved in a contigu-ous analysis window covering the wavenumber region 775– 800 cm−1. The interfering species CCl
4, HCFC-22, H2O,
ClONO2, CH3CCl3and C2H2were fitted along with PAN,
whereas pre-fitted profiles were used to model the contri-bution of other contaminants like ozone. Sensitivity tests consisting in retrieval without consideration of PAN demon-strated the existence of PAN signatures in MIPAS spectra ob-tained in polluted air masses. The analysed dataset consists of 10 days between 4 October and 1 December 2003. This period covers the end of the biomass burning season in South America and South and East Africa, in which generally large amounts of pollutants are produced and distributed over wide areas of the southern hemispheric free troposphere. Indeed, elevated PAN amounts of 200–700 pptv were measured in a large plume extending from Brasil over the Southern At-lantic, Central and South Africa, the South Indian Ocean as far as Australia at altitudes between 8 and 16 km. Enhanced PAN values were also found in a much more restricted area between northern subtropical Africa and India. The most sig-nificant northern midlatitude PAN signal was detected in an area at 8 km altitude extending from China into the Chinese Sea. The average mid and high latitude PAN amounts found at 8 km were around 125 pptv in the northern, but only be-Correspondence to: N. Glatthor
tween 50 and 75 pptv in the southern hemisphere. The PAN distribution found in the southern hemispheric tropics and subtropics is highly correlated with the jointly fitted acety-lene (C2H2), which is another pollutant produced by biomass
burning, and agrees reasonably well with the CO plume de-tected during end of September 2003 at the 275 hPa level (∼10 km) by the Measurement of Pollution in the Tropo-sphere (MOPITT) instrument on the Terra satellite. Simi-lar southern hemispheric PAN amounts were also observed by previous airborne measurements performed in Septem-ber/October 1992 and 1996 above the South Atlantic and the South Pacific, respectively.
1 Introduction
Peroxyacetyl nitrate (PAN) is generated in air masses pol-luted by fuel emissions or by biomass burning and is a pos-sible indicator of photochemical smog. Its production is ini-tialized by the reaction of hydrocarbons with the hydroxyl radical (OH) and subsequently with O2to form the
perox-yacetyl radical CH3C(O)OO as specific intermediate. The
reversible reaction of the peroxyacetyl radical with nitrogen dioxide produces PAN
CH3C(O)OO + NO2⇋CH3C(O)OONO2. (1)
PAN was first detected in the Los Angeles area during smog episodes (Stephens et al., 1956). Phytotoxic episodes with PAN amounts of more than 15 ppbv were observed in South-ern California in the 1980s (Temple et al., 1983). Even higher amounts of more than 30 ppbv were measured in 1997 in Mexico City (Gaffney et al., 1999). Since the 1980s PAN production has decreased in North America and Europe, but increased in Eastern Asia. The PAN amounts in clean air ar-eas are generally substantially lower, namely between 50 and
100 pptv (Singh et al., 2000a). Widespread southern hemi-spheric PAN pollution extending from South America over the South Atlantic, East and South Africa, the Southern In-dian Ocean as far as Australia has been observed during the annual biomass burning period in South America and South Africa in September and October (Singh et al., 1996, 2000a). The thermal decomposition rate of PAN is highly temper-ature dependent, resulting in lifetimes between 1 h at 298 K and about 5 months at 250 K (Singh, 1987). However, due to photolysis its mean lifetime is restricted to 3 months. Be-cause of its temperature sensitivity PAN can only be trans-ported over a few hundred kilometres in the lower tropo-sphere, but over distances of more than 10 000 km in the cold upper troposphere (Singh, 1987). Thus it serves as a reservoir and carrier of NOxin this height region. When these polluted
air masses warm up, PAN is destroyed and NO2is released
(Eq. 1), which is photolysed at wavelengths less than 420 nm. This leads to formation of nitric oxide (NO) and atomic oxy-gen:
NO2+hν (λ < 420 nm) −→ NO + O, (2)
Subsequently, atomic oxygen reacts with O2 and produces
tropospheric ozone:
O + O2+M −→ O3+M. (3)
Thus, PAN can contribute to the pollution of remote clean air areas, but has also strong influence on the oxidising power of the atmosphere. After photolytic destruction during day-time re-formation of PAN at night is possible. The fact, that contrary to ozone it has no important natural sources in the stratosphere, is an advantage of PAN over ozone as indica-tor of upper tropospheric hydrocarbon-NOxphotochemistry
(Singh, 1987).
Up to now there exists no global dataset of upper-tropospheric PAN. Only a few airborne campaigns covering supra-regional areas have been performed in the free tropo-sphere, e.g. the Global Tropospheric Experiment/Transport and Atmospheric Chemistry Near the Equator-Atlantic (GTE/TRACE A) experiment above the Tropical and South Atlantic (Singh et al., 1996) and the Pacific Exploratory Mis-sion (PEM) Tropics-A campaign above the Pacific (Singh et al., 2000a). These missions were dedicated to study the ex-tent and composition of the southern hemispheric biomass burning plume during September/October 1992 and 1996, re-spectively. Another airborne campaign off the west coast of North America, the Intercontinental Transport and Chemical Transformation 2002 (ITCT 2K2) project, was carried out to investigate the intercontinental PAN transport from East Asia (Roberts et al., 2004). Most of the other PAN data avail-able are groundbased measurements in the boundary layer in highly polluted as well as very remote regions (Temple et al., 1983; Beine et al., 2000; Gaffney et al., 1999; Jacobi et al., 1999). Whereas all these airborne and groundbased
measurements employed in-situ techniques, only quite re-cently the first detection of upper-tropospheric PAN in infra-red remote sensing spectra of MIPAS/ENVISAT and of the balloon-borne MIPAS instrument (MIPAS-B2) was reported (Allen, 2005a; Remedios et al., 2006, 2007). The MIPAS-B2 instrument is described in Fischer and Oelhaf (1996) and in Friedl-Vallon et al. (2004).
In this paper we present the first global distribution of PAN derived from spaceborne mid infra-red emission spectra. In detail, we will describe the retrieval method, give an error estimation, discuss sensitivity tests, and present the global PAN distribution observed between 4 October and 1 Decem-ber 2003. This period covers the end of the biomass burn-ing season in South America, Central and South Africa and in Australia. Thus, a widespread distribution of elevated PAN amounts and of other pollutants was expected in the southern hemispheric tropical and subtropical upper tropo-sphere. While this paper is focused on the description of the PAN retrieval scheme and on the presentation of the re-trieved PAN distribution, a more detailed investigation of the biomass burning plume by combined analysis of several pol-lutants and by trajectory calculations will be presented in a subsequent paper.
2 Michelson Interferometer for Passive Atmospheric Sounding
The Michelson Interferometer for Passive Atmospheric Sounding (MIPAS) was launched onboard the Sun-synchronous polar-orbiting European ENVIronmental SATellite (ENVISAT) on 1 March 2002. It is a limb-viewing Fourier transform infrared (FTIR) emission spectrometer covering the mid-infrared spectral region from 685 to 2410 cm−1. Its wide spectral coverage and high spectral
resolution, which is 0.035 cm−1 (unapodised) for spectra
of the original full resolution measurement mode evaluated here, enables simultaneous observation of numerous trace gases (Fischer and Oelhaf, 1996; European Space Agency (ESA), 2000). This measurement mode consists of rearward limb-scans covering tangent altitudes between about 6 and 68 km within 17 altitude steps. The step-width is 3 km up to 42 km and increases up to 8 km above 52 km. The level-1B radiance spectra used for PAN retrieval are data versions 4.61–4.62 provided by the European Space Agency (ESA) (Nett et al., 2002). Several data processors, amongst others one at the Institut f¨ur Meteorologie und Klimaforschung (IMK), have been developed for near-real time and off-line retrieval of profiles of atmospheric trace species from level-1B MIPAS spectra (von Clarmann et al., 2003a). The PAN distribution presented in this paper was produced with the retrieval processor of the IMK, which was developed to produce consistent datasets containing considerably more trace species than included in the operational dataset provided under ESA responsibility.
3 Retrieval method and error estimation
The retrievals performed with the IMK data processor consist of inversion of MIPAS level-1B spectra to vertical profiles of atmospheric state parameters by constrained non-linear least squares fitting (e.g., Rodgers, 2000, and references therein) in a global-fit approach:
xi+1= xi+(KTS−y1K + R + λI) −1
×(KTS−y1(ymeas− y(xi)) − R(xi− xa)), (4)
where xi+1is the vector of the unknown state parameters
cal-culated in iteration i+1, ymeasis the measurement vector, and y(xi) is the result of the radiative transfer model using the
parameters xi of iteration number i. Sy is the measurement
noise covariance matrix, K is the Jacobian matrix contain-ing the partial derivatives ∂y(xi)/∂xi, R is a regularization
matrix, λI (scalar times unity matrix) is a damping term as proposed by Levenberg (1944) and Marquardt (1963), and xa is an a-priori profile used to constrain the retrieval
re-sult. To avoid any influence on the shape of the retrieved PAN profiles, an all-zero a-priori profile is chosen, whereas a midlatitude PAN profile of the Model for OZone And Re-lated chemical Tracers (MOZART) (Horowitz et al., 2003) is used as first-guess. Application of a smoothing constraint is necessary to attenuate instabilities, because the retrieval grid used has an altitude spacing of 1 km up to 44 km and of 2 km between 44 and 70 km, which means oversampling in comparison with the height distance between the tangent alti-tudes. Similar as in other retrievals of MIPAS data performed at IMK, Tikhonov’s regularization scheme is used with a first derivative operator as constraint (Steck, 2002, and references therein).
Radiative transfer calculations are performed with the Karlsruhe Optimized and Precise Radiative Algorithm (KO-PRA) (Stiller, 2000). Prior to PAN many other trace species are evaluated in the retrieval chain. First, spectral shift, the temperature profile and the tangent heights are fitted. Thereafter various trace gas profiles are retrieved in a suc-cessive manner, in which the major species H2O, O3, CH4,
N2O, and HNO3are analysed first. The fitted profiles of all
these species are used to model their radiative contribution in the PAN retrieval unless they are joint-fitted again. Beside each target species, one continuum profiles and one height-independent zero level calibration corrections are jointly fit-ted for each microwindow. The retrieval strategy is described in more detail in, e.g., von Clarmann et al. (2003b), Glatthor et al. (2004) and H¨opfner et al. (2004) and references therein. Cloud-flagging, i.e. removal of cloud-contaminated spectra prior to retrieval, is performed following the standard method applied at IMK, using a threshold of 4.0 (Glatthor et al., 2006).
Since PAN is a relatively heavy and complex molecule (141 atomic mass units), the line positions are very dense and the line wings of its single rotational-vibrational transi-tion lines overlap, which leads to broadband continuum-like
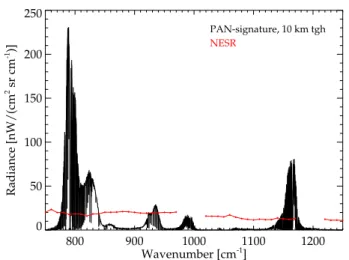
800 900 1000 1100 1200 Wavenumber [cm-1] 0 50 100 150 200 250 Radiance [nW/(cm 2 sr cm -1 )] PAN-signature, 10 km tgh NESR
Fig. 1. PAN signatures at 10 km altitude (black), displayed as dif-ference spectrum between model calculations for a tropical atmo-sphere containing a PAN amount of ∼200 pptv (at 10 km) and for a tropical PAN-free atmosphere. The main features are the bands centred at 794, 930, 991 and 1163 cm−1. The red curves show the typical noise-equivalent spectral radiance (NESR) in MIPAS spec-tra from channels A, AB and B (only low-wavenumber edge).
signatures. For this reason spectroscopic data are available as tabulated absorption cross sections only. In our retrievals PAN is modelled using a cross section dataset provided by the University of Leicester, which consists of measurements at three temperatures, 250, 273 and 295 K, with a nominal unapodised spectral resolution of 0.25 cm−1 (Allen et al.,
2005b, c). Based on model calculations for a climatological tropical atmosphere, the most prominent atmospheric PAN band is that centred at 794 cm−1(the ν
16 NO2stretch),
fol-lowed by a second band at 1163 cm−1(the ν
10C-O stretch)
and other considerably weaker bands. Figure 1 shows the difference spectrum for a tangent altitude of 10 km between an atmosphere containing a PAN amount of ∼200 pptv (at 10 km) and a PAN-free atmosphere. Comparison with the noise-equivalent spectral radiance (NESR) of MIPAS indi-cates that for this PAN amount a signal-to-noise ratio of larger than 10 can be obtained in the band at 794 cm−1.
Af-ter test of different sizes of the analysis window, PAN re-trievals were finally performed in one contiguous microwin-dow in the wavenumber region 775–800 cm−1, which covers
the strongest signatures of the band at 794 cm−1. Due to the
large amount of MIPAS data to be analysed, the weaker part of this band between 800 and 830 cm−1as well as the band
at 1163 cm−1were not used for retrieval to save
computa-tion time. However some sample consistency tests were per-formed, in which the whole band at 794 cm−1as well as the
band at 1163 cm−1were evaluated. For correct modelling of
the CO2Q-branch at 792 cm−1radiative transfer calculations
were performed with inclusion of CO2line-mixing. Because
of its relatively weak signal and broadband structure, PAN requires a careful retrieval to separate its signature from the
atmospheric continuum and from other broadband species, namely CCl4, HCFC-22, ClONO2and CH3CCl3, which also
contribute to the atmospheric signal in this spectral inter-val. Thus, beside PAN these species as well as H2O and
C2H2, one continuum profile and one height-independent
offset (one microwindow only) were also fitted. The results of preceding retrievals were used to model the temperature profile and the contribution of other interfering species like ozone, because test calculations had demonstrated that joint-fit of these species had only little influence on the retrieved PAN profile.
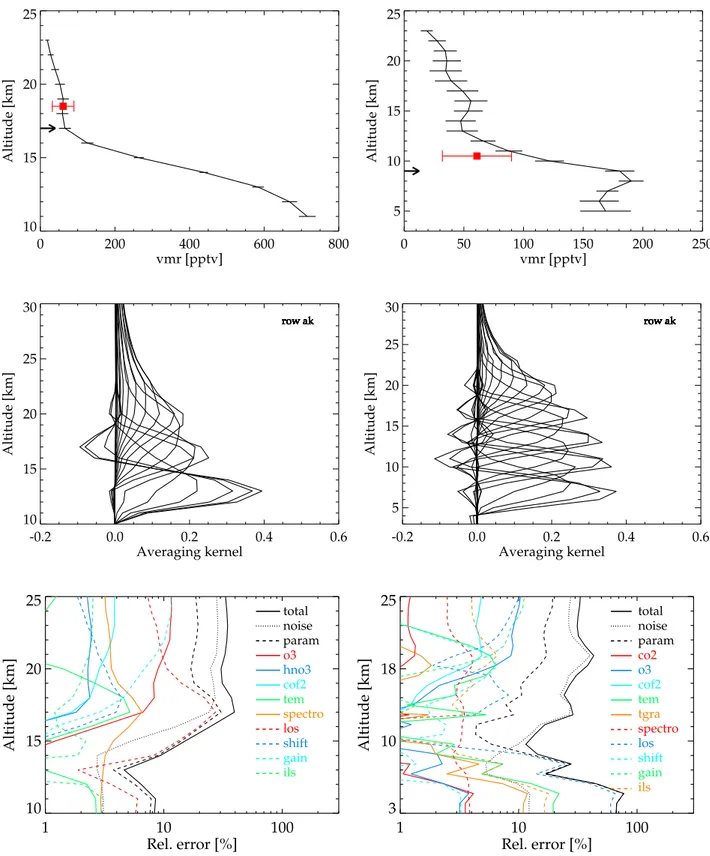
Figure 2 shows a PAN profile obtained on 21 October, 2003, over Eastern Africa (top left) and another profile from the same orbit obtained above northern midlatitudes (top right). Over East Africa a PAN volume mixing ratio (vmr) as high as 700 pptv was detected at the lowermost height use-able for retrieval at this geolocation (11 km, due to clouds). Towards higher altitudes PAN decreases to 65 pptv at the tropopause (17 km) and to 50 pptv at 20 km. The midlatitude profile exhibits PAN values of ∼175 pptv in the troposphere, a rapid decrease at the tropopause and also values around 50 pptv in the lowermost stratosphere. The corresponding averaging kernels (middle panels) indicate, that at the trop-ical geolocation a PAN signal is obtainable between 11 and 23 km and at the midlatitude geolocation, which is not con-taminated by clouds, between 5 and 23 km. The calculated number of degrees of freedom is 2.4 for the tropical and 4.6 for the midlatitude geolocation. The higher midlatitude value is due to higher temperatures between 11 and 25 km and further extension of the scan into the troposphere. In both cases the height resolution is 3.5–6 km (degrading with al-titude). The averaging kernels show that the PAN amounts retrieved in the lowermost stratosphere have a certain tro-pospheric contribution. Nevertheless, these PAN values are in good agreement with PAN amounts reported by Singh et al. (2000b) for the lower stratosphere above the Northern At-lantic (solid red squares).
The diagrams at the bottom of Fig. 2 show the total esti-mated PAN retrieval error, measurement noise and the major error components for both geolocations, in which all error components are 1-sigma uncertainties. The error estimation is based on the actual retrieved temperatures, tangent heights, PAN profiles and simulated spectra and Jacobians of the fi-nal iteration (cf. Glatthor et al., 2004). The error contribu-tions displayed for the tropical (left) and midlatitude geolo-cation (right) are not exactly the same, because due to dif-ferent atmospheric conditions slightly difdif-ferent components proved important (only components larger than 2% or 4%, respectively, are shown). The meaning of the various error sources listed in the legend is the following: total: total re-trieval error; noise: measurement noise; param: total con-tribution of all error components except of noise; o3, hno3, cof2, co2: errors due to uncertain knowledge on the respec-tive trace gases; tem, los, tgra: errors due to uncertainty in the temperature profile, in instrumental pointing and in the
horizontal temperature gradient (1 K, 150 m and 1 K/100 km assumed, respectively); spectro, shift, gain, ils: errors caused by uncertain knowledge on PAN spectroscopic data, fre-quency calibration, gain calibration and on instrumental line shape (3.2%, 0.0005 cm−1, 1% and 3% assumed). The errors
caused by temperature and instrumental pointing are some-what overestimated, because the basing uncertainties of 1 K and 150 m are assumed uncorrelated and rather conservative in comparison with the estimated standard deviation result-ing from the precedresult-ing retrieval of temperature and line-of-sight. The error contribution of the joint-fitted gases CCl4,
HCFC-22, ClONO2, CH3CCl3, H2O and C2H2 is assumed
zero.
For the tropical geolocation the total error is minimal (5%) at the lowermost useable tangent height (13 km), because here the sensitivity of the retrieval is maximal, expressed by the maximum of the averaging kernel at this altitude. Due to the considerably smaller averaging kernel the error is larger at 11 km. Towards higher altitudes, where the PAN amount declines rapidly, the total error increases to 40% at the tropopause (17 km) and remains above 30% in the strato-sphere. The stratospheric error estimates do not approach or exceed 100%, because, among other things, the smooth-ing error is not taken into account in our error assessment. Measurement noise increases from 3% at 13 km to more than 25% at the tropopause. Except for 13 km, uncertain knowl-edge on the instrumental line-of-sight (LOS) is the dominant error contribution in the altitude range 10–17 km. Further important error sources in this altitude range are the uncer-tainties in spectroscopic data, instrumental line shape (ILS), temperature and, above 15 km, in the ozone vmr. The spec-troscopic uncertainty is around 3% at most altitudes, which corresponds to the assumed 1-sigma error of 3.2% of the PAN cross sections at 250 K (cf. Allen et al., 2005b, c). Uncertain knowledge on ILS and temperature causes errors of up to 3 and 4%, respectively, in the altitude range 10– 17 km. The error due to unknown knowledge on ozone, as calculated from the estimated standard deviation (ESD) of the pre-fitted ozone profile, is 7% at 17 km, but decreases rapidly towards lower altitudes. At the northern midlatitude geolocation (bottom right), where considerably lower PAN amounts were detected, the total error amounts to 14–20% between 7 and 12 km. Towards lower altitudes the total error increases strongly up to 75% at 5 km because of decreasing sensitivity of the retrieval (cf. Fig. 2, middle right). Due to declining PAN amounts the error increases up to 30% in the lower stratosphere. The main error component below 9 km is the uncertainty in LOS and above 9 km the noise error, the latter ranging from 5% at 8 km to 25% in the strato-sphere. Further major error components are the same as at the East African location. The upper tropospheric total er-rors derived here are considerably smaller than the natural variability of PAN, which, e.g., in a compilation given by Roberts et al. (2004) ranges from 20 to 700 pptv.
0 200 400 600 800 vmr [pptv] 10 15 20 25 Altitude [km] 0 50 100 150 200 250 vmr [pptv] 5 10 15 20 25 Altitude [km] -0.2 0.0 0.2 0.4 0.6 Averaging kernel 10 15 20 25 30 Altitude [km] row ak row ak row ak row ak row ak row ak row ak row ak row ak row ak row ak row ak row ak row ak row ak row ak row ak row ak row ak -0.2 0.0 0.2 0.4 0.6 Averaging kernel 5 10 15 20 25 30 Altitude [km] row ak row ak row ak row ak row ak row ak row ak row ak row ak row ak row ak row ak row ak row ak row ak row ak row ak row ak row ak row ak row ak row ak row ak row ak 1 10 100 Rel. error [%] 10 15 20 25 Altitude [km] total noise param o3 hno3 cof2 tem spectro los shift gain ils 1 10 100 Rel. error [%] 3 10 18 25 Altitude [km] total noise param co2 o3 cof2 tem tgra spectro los shift gain ils
Fig. 2. Left: (top) PAN vmr-profile measured by MIPAS on 21 October, 2003, in polluted air masses over Eastern Africa (12.9◦S, 37.2◦E); due to cloud-contamination no PAN data are available from below 11 km; the error bars represent the noise error; the black arrow indicates the tropopause height and the red square the average PAN amount in the lowermost stratosphere given by Singh et al. (2000b) along with the scatter of the dataset; (middle) rows of the respective averaging kernel plotted versus altitude; (bottom) total retrieval error (solid black line), noise error (dotted black line), total parameter error (dashed black line), and contributions of various other error sources (see legend, detailed explanation in Sect. 3). Right: Same as left but for a geolocation from the same orbit at northern midlatitudes (51.4◦N, 153.7◦W).
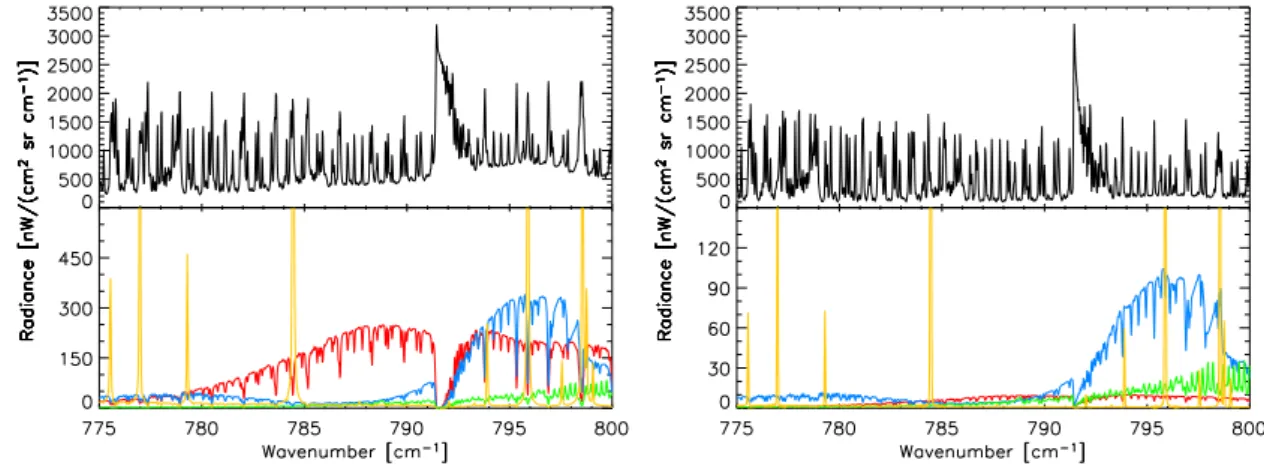
Fig. 3. Left: Modelled spectrum (black) and contributions of fitted PAN (red), CCl4(blue), HCFC-22 (green) and H2O (brown) for 13 km altitude at an East-African geolocation (12.9◦S, 37.2◦E), where high PAN amounts of 600 pptv were retrieved. The contributions of PAN, CCl4, HCFC-22 and H2O are the differences between model spectra with and without the respective gas. The top ends of the H2O lines are cut to zoom the broadband contributors. Right: Same as left, but for 19 km altitude.
An additional error source is the fact that the lowest labo-ratory temperature, for which PAN cross sections have been determined is 250 K, whereas the upper tropospheric tem-perature often is considerably lower, e.g. 210 K at 13 km alti-tude at the East African geolocation. To estimate the possible bias resulting from this discrepancy, test retrievals were per-formed using the PAN cross section data sets for 273 K or 295 K only. Thereby the retrieved PAN amount at this geolo-cation, which due to the low temperatures had been evaluated using the cross sections for 250 K in the standard retrieval, increased by 13% and 26% at 13 km altitude, respectively. Provided that this linear dependence on temperature maps to laboratory PAN cross sections actually required for colder upper tropospheric temperatures, this would mean that the re-trieval overestimates the “true” PAN amount at 13 km at this geolocation by 23%. For a general estimation of this effect, average temperatures were calculated for the southern hemi-spheric area of high PAN amounts (cf. Sect. 5), which were 247, 236, 221, 209 and 199 K for the altitudes of 8, 10, 12, 14 and 16 km. Under the assumption of linearity this means that the retrieved PAN amounts at these altitudes would have to be reduced by 2, 8, 14, 19 and 23%, respectively.
Figure 3 shows the modelled spectrum and the retrieved signatures of PAN, CCl4, HCFC-22 and H2O for the East
African geolocation at tangent altitudes of 13 km (left) and 19 km (right). To maintain clarity the weak signatures of the other joint-fit parameters ClONO2, CH3CCl3and C2H2
are not shown. At 13 km PAN exhibits a broadband sig-nature of up to more than 200 nW/(cm2sr cm−1) (bottom
left). The broadband structures of CCl4 and HCFC-22 are
mainly interfering between 792 and 800 cm−1, but only
lit-tle at lower wavenumbers, which enables a separation of the PAN signal. At 19 km the signature of PAN has decreased to 10 nW/(cm2sr cm−1) (bottom right), which is a factor of
2 lower than the instrumental NESR and also lower than the contributions of CCl4and HCFC-22. Although the
signal-to-noise ratio is enhanced by the extension of the low PAN sig-nature over a considerable number of gridpoints, this shows that the retrieved stratospheric PAN amounts have a large un-certainty.
4 Sensitivity tests
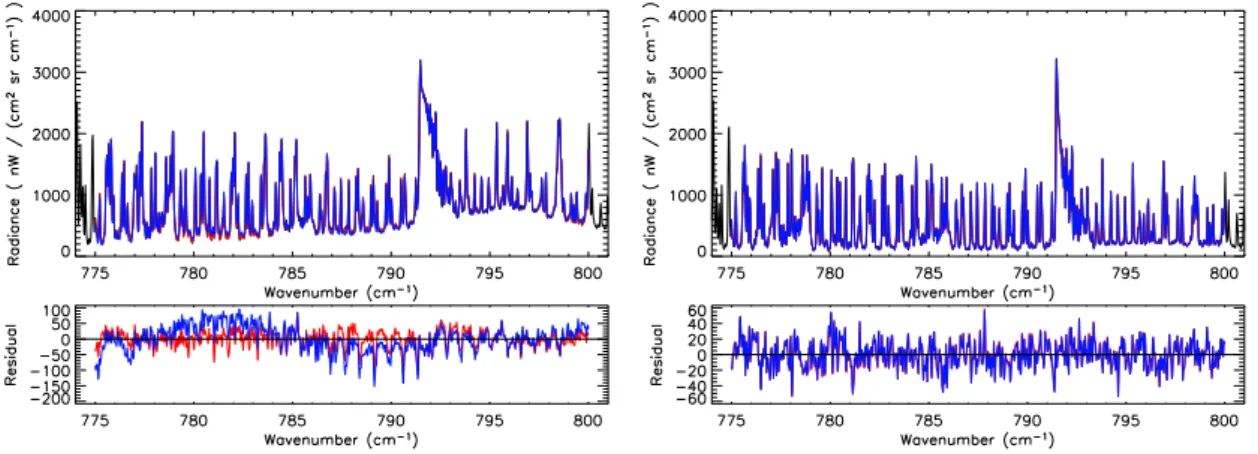
To check the retrieved PAN amounts we investigated, if the measured MIPAS spectra can be modelled just as well by complete neglect of PAN. Figure 4 (left) shows the MIPAS spectrum from 13 km altitude obtained on 21 October 2003 on orbit 8585 at the above presented East African geoloca-tion (12.9◦S, 37.2◦E), where a high PAN vmr of 600 pptv
was retrieved. Further it contains fitted spectra and residuals resulting from retrieval with and without inclusion of PAN, i.e. assuming a PAN-free atmosphere in the latter case and re-trieval of the joint-fit gases only. The residuals clearly show that the fit without consideration of PAN is much worse than the adjustment with modelling of PAN, confirming the large PAN amount retrieved at this altitude. This is also expressed by the RMS deviation between measured and modelled spec-tra, which is reduced from 41.2 nW/(cm2sr cm−1) for the
re-trieval without PAN to 26.9 nW/(cm2sr cm−1), i.e. by 35%,
for the retrieval with inclusion of PAN. For comparison the result of the same test for 19 km altitude at the same geoloca-tion, where a very low PAN amount of 50 pptv was retrieved, is also shown (Fig. 4, right). In this case the residuals are nearly equal (RMS of 16.82 and 16.76 nW/(cm2sr cm−1)),
indicating that retrieval without inclusion of PAN is techni-cally almost just as good. However the comparably good fit for the PAN-free atmosphere is obtained with a slightly nega-tive, i.e. unphysical, amount of CH3CCl3. This phenomenon
Fig. 4. Left: MIPAS spectrum from 13 km altitude, obtained on 21 October 2003 over Eastern Africa (12.9◦S, 37.2◦E) (black), as well as fitted spectra and residuals with (red) and without (blue) inclusion of PAN. Residuals are in the same units as the radiance plots themselves. Right: Same as left, but for 19 km altitude.
becomes even much stronger at 13 km, where neglect of PAN leads to large negative CH3CCl3and ClONO2amounts.
The result of this sensitivity test for the whole orbit 8585 is displayed in Fig. 5, where the ratio of the RMS-values from retrieval without and with inclusion of PAN is plotted against the retrieved PAN amount. The colour code indicates the tangent height of the respective spectra. For data points from altitudes of 16 km or higher the RMS-ratio is very close to unity for values below 100 pptv, indicating no sensitiv-ity to PAN. These altitudes are at or above the tropopause, where indeed only low PAN amounts are expected. How-ever, at lower altitudes of 7–14 km there are other points with PAN amounts below 100 pptv and larger RMS-ratios of up to 1.1. This indicates an altitude-dependent PAN significance-threshold of ∼100 pptv at altitudes of 16 km or higher and of ∼60 pptv for lower altitudes. In addition, there is a subset of datapoints, which show a linear correlation of the RMS-ratio with the retrieved PAN amounts, meaning an increasingly worse fit without consideration of PAN. For these data points, which are from altitudes between 7 and 13 km, the RMS-ratio increases up to more than 1.6 for fitted PAN amounts of 200–600 pptv.
PAN detection in MIPAS/ENVISAT spectra, but follow-ing a somewhat different method, has also been reported by Allen (2005a) and by Remedios et al. (2006).
Additional tests performed in our investigation consisted in correlation between the retrieved PAN and the jointly fitted CCl4, HCFC-22 and CH3CCl3amounts and showed no
cor-relation or anticorcor-relation. This ensured that the broadband signatures of these species were not erroneously interpreted as PAN. 0 100 200 300 400 500 600 PAN [pptv] 1.0 1.2 1.4 1.6 1.8
RMS-ratio [NO PAN/PAN]
km 6 8 10 12 14 16 18
Fig. 5. Ratio of RMS-values resulting from retrievals without and with inclusion of PAN plotted versus retrieved PAN amounts for or-bit 8585 of 21 October 2003. Data are color-coded with the tangent height; tangent heights higher than 18 km are also coded red.
5 Discussion
5.1 Observed PAN distribution
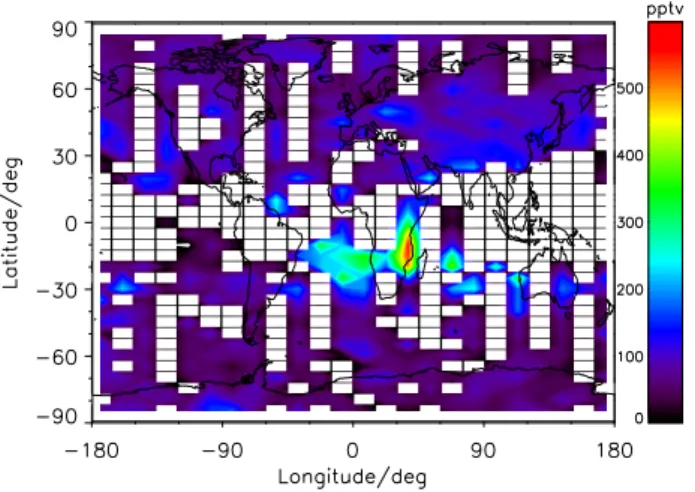
The analysed dataset consists of 150 orbits from 10 days be-tween 4 October and 1 December, 2003, namely 4, 13, 21 and 26 October, 1, 4, 11, 21 and 24 November, and 1 December. This period covers the end of the biomass burning season in the southern hemisphere. Figure 6 exemplarily shows the global PAN distribution retrieved from single spectra for 21 October 2003 at 12 km altitude. The white areas, which are mainly located in the tropics and subtropics, are data gaps caused by cloud contamination. Nevertheless a contiguous area of high PAN values (250–600 pptv) extending from the
Fig. 6. Global PAN distribution on 21 October 2003 at 12 km alti-tude, obtained from MIPAS data. The white areas are data gaps due to cloud contamination.
Southern Atlantic to East Africa is visible, which we attribute to extensive biomass burning. Interrupted by data gaps, this area seems to be continued above the Southern Indian Ocean as far as Australia. To enhance the spatial data coverage we show the PAN distribution averaged over the whole period in the next two plots.
The zonal average of the whole dataset (Fig. 7) exhibits clear differences between the northern and southern hemi-spheric PAN distribution. In the southern hemisphere there is a large plume containing elevated PAN amounts of more than 100 pptv between the equator and about 50◦S in the
al-titude range 7–15 km, which is obviously caused by biomass burning. Maximum values of more than 200 pptv are be-tween 20◦S and 40◦S at altitudes from 7 to 10 km. There
is another, but much more restricted, region of elevated PAN amounts in the northern hemispheric tropics, which contains maximum PAN amounts of 100–150 pptv. No data are avail-able in the northern tropics below 8 km due to permanent cloud contamination of the MIPAS spectra. Further there are also elevated PAN amounts throughout the northern hemi-spheric mid and high latitudes, decreasing from 150 pptv at 7 km to 75 pptv at 11 km. The major reason for these values is probably industrial pollution. However, we cannot exclude any other pollution source like boreal forest fires. In compar-ison to the northern hemisphere, the upper tropospheric PAN values at southern high latitudes, which are much less indus-trially polluted, are much lower, namely between 75 pptv at high midlatitudes and 25 pptv above the Antarctic. At strato-spheric altitudes above 15 km the situation is reversed. Here, obviously due to beginning subsidence over the Arctic, the northern hemispheric mid and high latitude PAN amounts are lower than those from the southern hemisphere.
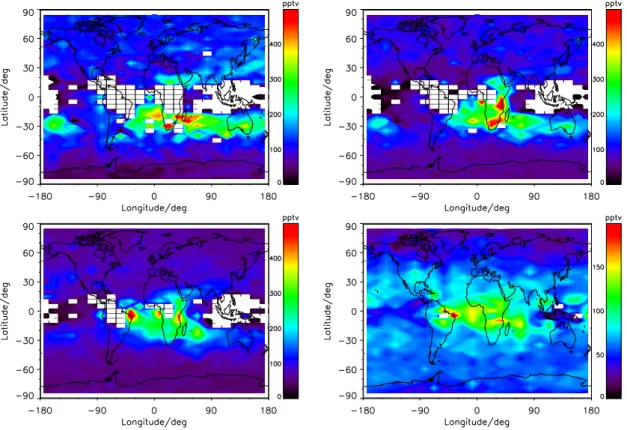
Figure 8 shows the averaged global PAN distribution at 8, 10, 12 and 16 km altitude. At 8 km there are still large data gaps in the tropics due to cloud-contamination. The
Fig. 7. Latitudinal PAN distribution, averaged zonally and over 10 days between 4 October and 1 December, 2003.
most prominent feature is a contiguous band of high PAN amounts in the southern hemispheric tropics and subtrop-ics, which extends from the tropical and subtropical Atlantic over Southern Africa, the Southern Indian Ocean and Aus-tralia as far as to the West Pacific. The PAN values in this band are generally between 200 and 300 pptv and increase up to 500 pptv above Southern Africa and the adjacent dian Ocean. The high PAN amounts above the Western In-dian Ocean are represented by 15 individual profiles. As al-ready mentioned above, we attribute this feature to southern hemispheric biomass burning. In the northern hemispheric subtropics, a more restricted area of elevated PAN is visi-ble at 8 km, extending from the African Sahel zone to In-dia and, possibly strengthened by additional sources of PAN, further northeast above China and the Chinese Sea. At 10 km high PAN values appear above the whole southern and east-ern Africa. At 12 km the area of high southeast-ern hemispheric PAN amounts does not extend so far east and ends at the West Australian coast. However, high PAN amounts of 400– 500 pptv are now visible above North-East Brasil, i.e. in an area which was masked by clouds below. At 16 km altitude, where deterioration by clouds has mostly disappeared and the global coverage is nearly complete, the highest PAN amounts of up to 200 pptv cover an area extending from tropical Brasil above the Southern Atlantic and tropical Africa to the South-ern Indian Ocean. Like in Fig. 7, the northSouth-ern mid and high latitude PAN values are lower than those from the southern hemisphere.
In order to check on a qualitative basis, if the observed southern hemispheric tropical and subtropical PAN distri-bution can be caused by biomass burning, fire counts of the Tropical Rainfall Measuring Mission (TRMM) satellite (Giglio et al., 2000) were inspected for the time period 25 September until 1 December 2003. Indeed, numerous fire count clusters were found in South America, Central and
Fig. 8. Global PAN distribution at 8, 10, 12 and 16 km altitude (top left to bottom right) averaged over 10 days between 4 October and 1 December, 2003. The white areas are data gaps due to cloud contamination.
Southern Africa and in Australia over the whole period, indicating intensive biomass burning (http://tsdis.gsfc.nasa. gov/tsdis/Fire/fireintro.html). This is also confirmed by fire counts of the Moderate Resolution Imaging Spectroradiome-ter (MODIS) experiment on the Terra satellite published by Edwards et al. (2006, Fig. 5a). As mentioned in Sect. 1, a more detailed and quantitative investigation of the biomass burning plume by combined analysis of several pollutants and trajectory calculations starting above the observed fire count clusters will be presented in a subsequent paper.
Figure 9 shows daily averages of the PAN values in an area containing the southern hemispheric plume (left) and from the same latitude band but from a much less polluted area above the Central and Eastern Pacific (right) at 8, 12, 16 and 20 km altitude. Comparison of both plots shows that the PAN values in the area containing the biomass burning plume are strongly enhanced at 8 and 12 km and moderately elevated at 16 km throughout the observation period, which basically justifies the temporal averaging performed above. At 8 km the PAN amounts in the plume range from 200 to 370 pptv, whereas they are around 200 and 80 pptv at 12 and 16 km. The corresponding values above the Pacific are much lower, about 130, 90 and 60 pptv, respectively. At 8 km alti-tude these PAN values seem also to be moderately enhanced. As mentioned above, the stratospheric PAN amounts from
20 km are only little significant, but exhibit approximately the same values in both areas.
5.2 Correlation of southern hemispheric PAN with joint-fitted C2H2
Contrary to PAN the joint-fitted trace gas acetylene (C2H2)
exhibits narrow transition lines in MIPAS spectra (e.g. a well separated line at 776.1 cm−1), which can not be
misinter-preted by other continuum-like structures. Since C2H2 is
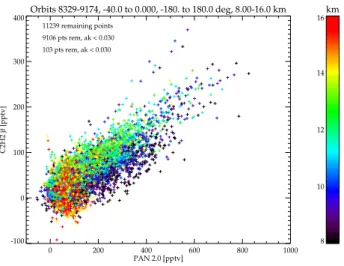
another, although not unique, product of biomass burning (Singh et al., 1996), it is suited for a cross-check of the PAN amounts retrieved in the southern hemispheric tropics and subtropics. In Fig. 10 the PAN and C2H2data from the
lat-itude band 0◦to 40◦S, i.e. from the biomass burning zone
and the adjacent background region, are plotted against each other for the altitude region 10–16 km. The high correla-tion between both datasets (r=0.79) confirms the measured southern hemispheric PAN distribution. The slightly nega-tive C2H2values are mainly associated with PAN values
be-low 100 pptv from altitudes of 15–16 km, which are anyway only little significant (cf. Sect. 4).
10 20 30 40 50 60 Day from 1 October, 2003
0 100 200 300 400 500 vmr [pptv] 8 km 12 km 16 km 20 km 10 20 30 40 50 60
Day from 1 October, 2003 0 100 200 300 400 500 vmr [pptv] 8 km 12 km 16 km 20 km
Fig. 9. Left: Daily averages of PAN amounts measured in the biomass burning zone (0◦–30◦S and 60◦W–135◦E) at 8 km (black), 12 km (red), 16 km (blue) and 20 km altitude (green). Right: Same as left, but for an adjacent background zone above the South Pacific (0◦–30◦S, 90◦W–180◦W). Orbits 8329-9174, -40.0 to 0.000, -180. to 180.0 deg, 8.00-16.0 km 0 200 400 600 800 1000 PAN 2.0 [pptv] -100 0 100 200 300 400 C2H2 jf [pptv] 11239 remaining points 9106 pts rem, ak < 0.030 103 pts rem, ak < 0.030 km 8 10 12 14 16
Fig. 10. Correlation between PAN and joint-fitted C2H2amounts, measured by MIPAS on 10 days between 4 October and 1 Decem-ber, 2003, in the latitude band 0◦to 40◦S between 8 and 16 km altitude; correlation coefficient r=0.79.
5.3 Comparison with other space- and airborne measure-ments
The biomass burning plume detected in the MIPAS PAN dis-tribution (cf. Fig. 8) is in reasonably good agreement with the area of enhanced CO observed by the Measurement of Pol-lution in the Troposphere (MOPITT) instrument on the Terra satellite (Edwards et al., 2006, Figs. 1b and 4a), which these authors also attribute to biomass burning in South America, South Africa and Australia. During the last week of Septem-ber 2003 MOPITT measured a plume of elevated CO (up to ∼160 ppbv), which on the 275 hPa (∼10 km) level mainly covered tropical Brasil, the Southern tropical and subtropi-cal Atlantic, Southern Africa as well as the Western Indian Ocean, and less distinct extended until Western Australia. During the subsequent period 1–9 October 2003, which
cor-responds to the beginning of our measurement period, MO-PITT observed a band of high CO total columns at 30◦S,
which even circumscribed the globe.
A qualitative comparison can also be made with airborne in-situ PAN measurements performed by the NASA Global Tropospheric Experiment (GTE) in September/October 1992 over the South Atlantic and the Pacific Exploratory Mission (PEM) in September/October 1996 over the remote South Pacific (Singh et al., 1996, 2000a). These campaigns were dedicated to study the distribution of species in pollution plumes originating from biomass burning regions in South America and South Africa. Over the South Atlantic average PAN amounts of about 300 pptv were found in the altitude region 3–11 km. This agrees well with the average of MI-PAS Southern Atlantic (10◦S to 30◦S) PAN data, which is
between 330 pptv at 8 km and 230 pptv at 11 km (cf. Fig. 8). For the remote South Pacific these authors report average PAN values of about 60 pptv between 5 and 11 km altitude, whereas the MIPAS values in this region (0◦ to 30◦S and
90◦W to 150◦W) are between 115 pptv at 8 km and 80 pptv
at 11 km.
Enhanced northern hemispheric PAN as displayed in Fig. 7 and Fig. 8 (top left) has also be found by Kotchenruther et al. (2001) and Roberts et al. (2004), who report on PAN amounts of about 200 pptv in the altitude region 6–8 km off the westcoast of the United States and attribute these measurements to long-range transport of industrial pollution from East-Asia. Further, Remedios et al. (2007) retrieved PAN amounts of 260–180 pptv in the altitude region 7.5– 10.5 km from MIPAS-B2 spectra obtained over the Western Mediterranean region. Elevated PAN values at high northern latitudes as shown in Fig. 7 have also been measured by e.g. Bottenheim and Gallant (1989), who report on PAN-vmrs of up to 300 pptv at 7 km altitude at 70◦N and attribute their
observations to arctic haze episodes caused by industrial pol-lution.
6 Summary and conclusions
We have used spaceborne mid-infrared measurements of MI-PAS to derive the first global upper tropospheric PAN dis-tribution. The evaluated dataset consists of ten days cover-ing the period 4 October to 1 December 2003. PAN was re-trieved in the wavenumber region 775–800 cm−1, which
cov-ers its most prominent mid-infrared signature. Beside PAN the interfering broadband species CCl4, HCFC-22, CH3CCl3
and ClONO2 as well as H2O and C2H2 were joint-fitted.
PAN profiles were derived for the upper troposphere and lower stratosphere, with about 2.5–4.5 degrees of freedom (depending on useable tangent heights) and a height reso-lution of 3.5–6 km. The total retrieval error, obtained from an analytical error analysis, ranges from 5% for strongly en-hanced tropical PAN amounts (600 pptv at 13 km) to 14–20% for moderate midlatitude PAN amounts (175 pptv) near the tropopause. The error increases up to 75% towards mid-latitude lower tropospheric altitudes and to more than 30% in the lower stratosphere. An additional uncertainty results from incomplete coverage of the upper tropospheric temper-atures by the PAN cross section data set used. Due to this dis-crepancy the “true” PAN amounts in the cold tropical upper troposphere might be overestimated by up to ∼30%. A sen-sitivity test to check the retrieved PAN data showed a degra-dation of the fit quality for retrievals without consideration of PAN, which increased with the PAN amount obtained be-fore. Further, this test indicated a PAN significance-threshold of ∼60 pptv for altitudes up to ∼15 km and of ∼100 pptv above.
The analysed period covers the end of the biomass burn-ing season in the southern hemispheric tropics and subtrop-ics, in which large amounts of pollutants inclusive PAN are produced, uplifted into the free troposphere and distributed over large areas. Indeed, high PAN amounts were found in the southern hemispheric tropics and subtropics in the alti-tude range 8 to 16 km. At 8 km elevated PAN values formed a nearly worldwide band extending from Brasil over the South-ern Atlantic, Central and South Africa, the SouthSouth-ern Indian Ocean and Australia as far as to the South Pacific, whereas they were more confined to the area between Brasil and the Western Indian Ocean at higher altitudes. The PAN amounts in this biomass burning area ranged from 200 to 500 pptv at 8 km and from 100 to 200 pptv at 16 km. Enhanced PAN amounts were also found in a much more restricted area between northern subtropical Africa and India. The most significant PAN signal at northern hemispheric midlatitudes with values of up to 250 pptv was detected in an adjacent area extending from China into the Chinese Sea. The average mid and high latitude PAN values at 8 km altitude were 125 pptv in the northern and between 75 and 50 pptv in the southern hemisphere.
During the analysed period numerous fire count clusters were observed in the southern hemispheric tropics and sub-tropics by the TRMM satellite. Further, the southern
hemi-spheric PAN distribution is well correlated with the joint-fitted C2H2, which is another pollutant produced by biomass
burning, and there is good agreement with the CO distribu-tion measured by the MOPITT experiment in late Septem-ber and early OctoSeptem-ber 2003. On average, the retrieved PAN amounts are also consistent to airborne PAN measurements performed during the southern hemispheric biomass burning periods of 1992 and 1996. These correspondencies confirm the southern hemispheric PAN distribution observed by MI-PAS and its characteristics as biomass burning plume. A more detailed investigation of this plume by combined anal-ysis of several pollutants will be given in a subsequent paper.
Acknowledgements. The authors like to thank the European Space Agency for giving access to MIPAS level-1 data. Meteorological analysis data have been provided by ECMWF. The IMK team has partially been supported by funds of the IMACCO project (virtual institute).
Edited by: P. Hartogh
References
Allen, G.: The infrared remote sensing of peroxyacetyl nitrate in the upper troposphere, Ph.D. thesis, University of Leicester, http: //www.leos.le.ac.uk/publications, 2005a.
Allen, G., Remedios, J. J., Newnham, D. A., Smith, K. M., and Monks, P. S.: Improved mid-infrared cross-sections for perox-yacetyl nitrate (PAN) vapour, Atmos. Chem. Phys., 5, 47–56, 2005b.
Allen, G., Remedios, J. J., and Smith, K. M.: Low temperature mid-infrared cross-sections for peroxyacetyl nitrate (PAN) vapour, Atmos. Chem. Phys., 5, 3153–3158, 2005c.
Beine, H. J. and Krognes, T.: The seasonal cycle of peroxyacetyl nitrate in the European Arctic, Atmos. Environ., 34, 933–940, 2000.
Bottenheim, J. W. and Gallant, A. J.: PAN over the Arctic; ob-servations during AGASP-2 in April 1986, J. Atmos. Chem., 9, 301–316, 1989.
Edwards, D. P., Emmons, L. K., Gille, J. C., Chu, A., Atti´e J.-L., Giglio, L., Wood, S. W., Haywood, J., Deeter, M. N., Massie, S. T., Ziskin, D. C., and Drummond, J. R.: Satellite–observed pol-lution from Southern Hemisphere biomass burning, J. Geophys. Res., 111, D14312, doi:10.1029/2005JD006655, 2006.
European Space Agency: Envisat, MIPAS An instrument for atmo-spheric chemistry and climate research, ESA Publications Divi-sion, ESTEC, P.O. Box 299, 2200 AG Noordwijk, The Nether-lands, SP-1229.
Fischer, H. and Oelhaf, H.: Remote sensing of vertical profiles of atmospheric trace constituents with MIPAS limb-emission spec-trometers, Appl. Opt., 35(16), 2787–2796, 1996.
Friedl-Vallon, F., Maucher, G., Kleinert, A., Lengel, A., Keim, C., Oelhaf, H., Fischer, H., Seefeldner, M., and Trieschmann, O.: Design and characterisation of the ballon–borne Michelson In-terferometer for Passive Atmospheric Sounding (MIPAS–B2), Appl. Opt., 43(16), 3335–3355, 2004.
Gaffney, J. S., Marley, N. A., Cunningham, M. M., and Doskey, P. V.: Measurements of peroxyacyl nitrates (PANS) in Mexico
City: implications for megacity air quality impacts on regional scales, Atmos. Environ., 33, 5003–5012, 1999.
Giglio, L., Kendall, J. D., and Tucker, C. J.: Remote sensing of fires with the TRMM VIRS, Int. J. Rem. Sens., 21, 203–207, 2000. Glatthor, N., von Clarmann, T., Fischer, H., Funke, B., Grabowski,
U., H¨opfner, M., Kellmann, S., Kiefer, M., Linden, A., Milz, M., Steck, T., Stiller, G. P., Mengistu Tsidu, G., and Wang, D.-Y: Spaceborne ClO observations by the Michelson Interferome-ter for Passive Atmospheric Sounding (MIPAS) before and dur-ing the Antarctic major warmdur-ing in September/October 2002, J. Geophys. Res., 109, D11307, doi:10.1029/2003JD004440, 2004. Glatthor, N., von Clarmann, T., Fischer, H., Funke, B., Gil-L´opez, S., Grabowski, U., H¨opfner, M., Kellmann, S., Linden, A., L´opez-Puertas, M., Mengistu Tsidu, G., Milz, M., Steck, T., Stiller, G. P, and Wang, D.-Y.: Retrieval of stratospheric ozone profiles from MIPAS/ENVISAT limb emission spectra: a sensi-tivity study, Atmos. Chem. Phys., 6, 2767–2781, 2006,
http://www.atmos-chem-phys.net/6/2767/2006/.
H¨opfner, M., von Clarmann, T., Fischer, H., Funke, B., Glatthor, N., Grabowski, U., Kellmann, S., Kiefer, M., Linden, A., Mengistu Tsidu, G., Milz, M., Steck, T., Stiller, G. P., and Wang, D.-Y: First spaceborne observations of Antarctic stratospheric ClONO2 recovery: Austral spring 2002, J. Geophys. Res., 109(D11), D11308, doi:10.1029/2004JD004609, 2004.
Horowitz, L. W., Walters, S., Mauzerall, D. L., Emmons, L. K., Rasch, P. J., Granier, C., Tie, X., Lamarque, J.-F., Schultz, M. G., and Brasseur, G. P.: A global simulation of tropo-spheric ozone and related tracers: Description and evaluation of MOZART, version 2, J. Geophys. Res., 108(D24), 4784, doi:10.1029/2002JD002853, 2003.
Jacobi, H.-W. and Schrems, O.: Peroxyacetyl nitrate (PAN) distri-bution over the South Atlantic Ocean, Phys. Chem. Chem. Phys., 1, 5517–5521, 1999.
Kotchenruther, R. A., Jaffe, D. A., and Jaegl´e, L.: Ozone pho-tochemistry and the role of peroxyacetyl nitrate in the spring-time northeastern Pacific troposphere: results from the Photo-chemical Ozone Budget of the Eastern North Pacific Atmosphere (PHOBEA) campaign, J. Geophys. Res., 106(D22), 28 731– 28 742, 2001.
Levenberg, K.: A method for the solution of certain non-linear problems in least squares, Quart. Appl. Math., 2, 164–168, 1944. Marquardt, D. W.: An algorithm for least–squares estimation of nonlinear parameters, J. Soc. Indust. Appl. Math., 11(2), 431– 441, 1963.
Nett, H., Perron, G., Sanchez, M., Burgess, A., and Mossner, P.: MIPAS inflight calibration and processor validation, in EN-VISAT Calibration Review, Proc. of the European Workshop, 9– 13 September 2002, ESTEC, Noordwijk, The Netherlands, CD-ROM, vol. SP-520, edited by H. Sawaya-Lacoste, ESA Publica-tions Division, ESTEC, Postbus 299, 2200 AG Noordwijk, The Netherlands, 2002.
Remedios, J. J., Allen, G., and Waterfall, A. M.: Infra-red remote sensing of organic compounds in the upper troposphere, in: Pro-ceedings of the First ”Atmospheric Science Conference”, edited by: Lacoste, H., ESA SP-628, ESA Publications Division, Euro-pean Space Agency, Noordwijk, The Netherlands, 2006. Remedios, J. J., Allen, G., Waterfall, A. M., Oelhaf, H., and
Klein-ert, A.: Detection of organic compound signatures in infra-red, limb emission spectra observed by the MIPAS-B2 balloon
instru-ment, Atmos. Chem. Phys., 7, 1599–1613, 2007, http://www.atmos-chem-phys.net/7/1599/2007/.
Roberts, J. M., Flocke, F., Chen, G., de Gouw, J., Holloway, J. S., H¨ubler, G., Neuman, J. A., Nicks Jr., D. K., Nowak, J. B., Parrish, D. D., Ryerson, T. B., Sueper, D. T., Warneke, C., and Fehsen-feld, F. C.: Measurement of peroxycarboxylic nitric anhydrides (PANs) during the ITCT 2K2 aircraft intensive experiment, J. Geophys. Res., 109, D23S21, doi:10.1029/2004JD004960, 2004.
Rodgers, C. D.: Inverse Methods for Atmospheric Sounding: The-ory and Practice, volume 2 of Series on Atmospheric, Oceanic and Planetary Physics, edited by: Taylor, F. W., World Scientific, 2000.
Singh, H. B.: Reactive nitrogen in the troposphere, Environ. Sci. Technol., 21(4), 320–327, 1987.
Singh, H. B., Herlth, D., Kolyer, R., Chatfield, R., Viezee, W., Salas, L. J., Chen, Y., Bradshaw, J. D., Sandholm, S. T., Talbot, R., Gregory, G. L., Anderson, B., Sachse, G. W., Browell, E., Bach-meier, A. S., Blake, D. R., Heikes, B., Jacob, D., and H. E. Fu-elberg: Impact of biomass burning emissions on the composition of the South Atlantic troposphere: Reactive nitrogen and ozone, J. Geophys. Res., 101(D19), 24 203–24 219, 1996.
Singh, H. B., Viezee, W., Chen, Y., Bradshaw, J., Sandholm, S., Blake, D., Blake, N., Heikes, B., Snow, J., Talbot, R., Brow-ell, E., Gregory, G., Sachse, G., and Vay, S.: Biomass burning influences on the composition of the remote South Pacific tro-posphere: analysis based on observations from PEM-Tropics-A, Atmos. Environ., 34(4), 635–644, 2000a.
Singh, H., Chen, Y., Tabazadeh, A., Fukui, Y., Bey, I., Yantosca, R., Jacob, D., Arnold, F., Wohlfrom, K., Atlas, E., Flocke, F., Blake, N., Heikes, B., Snow, J., Talbot, R., Gregory, G., Sachse, G., Vay, S., and Kondo, Y.: Distribution and fate of selected oxygenated organic species in the troposphere and lower stratosphere over the Atlantic, J. Geophys. Res., 105(D3), 3795–3805, 2000b. Steck, T.: Methods for determining regularization for atmospheric
retrieval problems, Appl. Opt., 41(9), 1788–1797, 2002. Stephens, E. R., Hanst, P. L., D¨orr, R. C., and Scott, W. E.:
Reac-tions of nitrogen dioxide and organic compounds in air, Ind. Eng. Chem., 48, 1498–1504, 1956.
Stiller, G. P. (Ed.): The Karlsruhe Optimized and Precise Radia-tive transfer Algorithm (KOPRA), Institut f¨ur Meteorologie und Klimaforschung, Forschungszentrum Karlsruhe GmbH, 2000. Temple, P. J. and Taylor, O. C.: World-wide ambient measurements
of PAN and implications for plant injury, Atmos. Environ., 17, 1583–1588, 1983.
von Clarmann, T. and Echle, G.: Selection of optimized microwin-dows for atmospheric spectroscopy, Appl. Opt., 37(33), 7661– 7669, 1998.
von Clarmann, T., Ceccherini, S., Doicu, A., Dudhia, A., Funke, B., Grabowski, U., Hilgers, S., Jay, V., Linden, A., L´opez-Puertas, M., Mart´ın-Torres, F.-J., Payne, V., Reburn, J., Ridolfi, M., Schreier, F., Schwarz, G., Siddans, R., and Steck, T.: A blind test retrieval experiment for infrared limb emission spectrometry, J. Geophys. Res., 108(D23), 4746, doi:10.1029/2003JD003835, 2003a.
von Clarmann, T., Fischer, H., Funke, B., Glatthor, N., Grabowski, U., H¨opfner, M., Kellmann, S., Kiefer, M., Linden, A., Mengistu Tsidu, G., Milz, M., Steck, T., Stiller, G. P., Wang, D.-Y., Gil-L´opez, S., and L´opez-Puertas, M.: Retrieval of temperature and
tangent altitude pointing from limb emission spectra recorded from space by the Michelson Interferometer for Passive Atmo-spheric Sounding (MIPAS), J. Geophys. Res., 108(D23), 4736, doi:10.1029/2003JD003602, 2003b.