HAL Id: hal-00297628
https://hal.archives-ouvertes.fr/hal-00297628
Submitted on 6 Jul 2007
HAL is a multi-disciplinary open access
archive for the deposit and dissemination of
sci-entific research documents, whether they are
pub-lished or not. The documents may come from
teaching and research institutions in France or
abroad, or from public or private research centers.
L’archive ouverte pluridisciplinaire HAL, est
destinée au dépôt et à la diffusion de documents
scientifiques de niveau recherche, publiés ou non,
émanant des établissements d’enseignement et de
recherche français ou étrangers, des laboratoires
publics ou privés.
fossil fuel CO2 uptake due to CO2-calcification feedback
A. Ridgwell, I. Zondervan, J. C. Hargreaves, J. Bijma, T. M. Lenton
To cite this version:
A. Ridgwell, I. Zondervan, J. C. Hargreaves, J. Bijma, T. M. Lenton. Assessing the potential
long-term increase of oceanic fossil fuel CO2 uptake due to CO2-calcification feedback. Biogeosciences,
European Geosciences Union, 2007, 4 (4), pp.481-492. �hal-00297628�
www.biogeosciences.net/4/481/2007/ © Author(s) 2007. This work is licensed under a Creative Commons License.
Biogeosciences
Assessing the potential long-term increase of oceanic fossil fuel CO
2
uptake due to CO
2
-calcification feedback
A. Ridgwell1, I. Zondervan2, J. C. Hargreaves3, J. Bijma2, and T. M. Lenton4
1School of Geographical Sciences, University of Bristol, Bristol, BS8 1SS UK
2Biogeosciences, Alfred Wegener Institute for Polar and Marine Research, Am Handelshafen 12, 27570 Bremerhaven,
Germany
3Frontier Research Center for Global Change, 3173-25 Showa-machi, Kanazawa-ku, Yokohama, Kanagawa 236-0001, Japan 4School of Environmental Sciences, University of East Anglia, Norwich, NR4 7TJ, UK
Received: 27 September 2006 – Published in Biogeosciences Discuss.: 13 November 2006 Revised: 27 June 2007 – Accepted: 28 June 2007 – Published: 6 July 2007
Abstract. Plankton manipulation experiments exhibit a wide range of sensitivities of biogenic calcification to simulated anthropogenic acidification of the ocean, with the “lab rat” of planktic calcifiers, Emiliania huxleyi apparently not rep-resentative of calcification generally. We assess the implica-tions of this observational uncertainty by creating an ensem-ble of realizations of an Earth system model that encapsulates a comparable range of uncertainty in calcification response to ocean acidification. We predict that a substantial reduction in marine carbonate production is possible in the future, with enhanced ocean CO2sequestration across the model
ensem-ble driving a 4–13% reduction in the year 3000 atmospheric fossil fuel CO2burden. Concurrent changes in ocean
circula-tion and surface temperatures in the model contribute about one third to the increase in CO2 uptake. We find that
un-certainty in the predicted strength of CO2-calcification
feed-back seems to be dominated by the assumption as to which species of calcifier contribute most to carbonate production in the open ocean.
1 Introduction
Open ocean dwelling calcifying plankton, such as coccol-ithophorids and foraminifera produce shells by precipitating the mineral calcium carbonate (CaCO3). The continued
dis-solution of fossil fuel CO2in the surface waters of the ocean
and associated decrease in ambient carbonate ion (CO2−3 ) concentration (Orr et al., 2005) and pH, termed ocean acidi-fication (Caldeira and Wickett, 2003) could adversely affect the ability of these species of plankton to precipitate CaCO3
Correspondence to: A. Ridgwell ([email protected])
(e.g., Bijma et al., 1999; Riebesell et al., 2000; Zondervan et al., 2001). A reduction in marine carbonate production would, in turn, increase the capacity of the surface ocean to absorb CO2 (Barker et al., 2003; Zondervan et al., 2001).
Understanding the strength of this “CO2-calcification”
feed-back, by which we mean: the acceleration of CO2 uptake
by the ocean due to lower calcification rates, is important to accurate prediction of the fate of CO2emitted to the
atmo-sphere and the extent of future climate change.
The climatic importance of biogenic production of CaCO3
in the surface ocean and its subsequent removal by grav-itational settling arises because although the sum to-tal of dissolved carbon species (DIC) is reduced upon CaCO3precipitation, the remaining carbon is re-partitioned
in favor of CO2(aq). This results in a higher
par-tial pressure of CO2 (pCO2) in the surface ocean by:
Ca2++2HCO−3→CaCO3+CO2(aq)+H2O. It has been found
that biogenic carbonate production can be suppressed as CO2 is added to the ocean (see Table 1) and the
am-bient concentration of carbonate ions (CO2−3 ) is reduced (CO2(aq)+CO2−3 +H2O→2HCO−3). This is not entirely
unex-pected because in the abiotic system, the precipitation rate of CaCO3can be related directly to concentration [CO2−3 ]via:
R = k × ( − 1)η (1)
where is the saturation state (or solubility ratio) of the aqueous environment, defined as [Ca2+]×[CO2−3 ]/Ksp(with
Kspa solubility constant), and k is an overall scaling constant (Zhong and Mucci, 1993). The power parameter η controls how non-linear the response of calcification is to a change in saturation state (and [CO2−3 ]) – the higher the value of η, the more responsive calcification is to ambient saturation. Con-versely, low values of η imply that calcification will be only
Table 1. Relative sensitivity to saturation changes (η) observed in different experimental calcification rate manipulations.
#1 Species Experimental details (calcite) (aragonite) Estimated η2 Reference
– Calcidiscus leptoporus in vitro ∼2 to ∼10 – n/a3 Langer et al. (2006) 0 Coccolithus pelagicus in vitro ∼2 to ∼10 – 04 Langer et al. (2006) 1 Emiliania huxleyi in vitro 2.0 to 4.8 – 0.20±0.095 Zondervan et al. (2001) 2 Emiliania huxleyi mesocosm bloom 2.0 to 5.3 – 0.32±0.20 Delille et al. (2005) 3 Orbulina universa in vitro (high light) 1.0 to 4.1 – 0.32±0.08 Bijma et al. (1999) 3 Orbulina universa in vitro (darkness) 1.7 to 4.1 – 0.49±0.23 Bijma et al. (1999) 4 Gephyrocapsa oceanica in vitro 1.7 to 4.3 – 0.53±0.31 Zondervan et al. (2001) 5 Mixed assemblage Ship-board incubation 1.7 to 4.4 – 0.75±0.10 Riebesell et al. (2000)
6 Corals6 (various) – ∼1 to ∼6 ∼1 Langdon and Atkinson (2005)7
7 None (abiotic) in vitro – – 1.9–2.8 Zhong and Mucci (1993)
1Sorted downwards by increasing apparent sensitivity of calcification to a change in saturation state. The ID number (#) corresponds to the
number labeling in Fig. 4.
2Mean value and standard error.
3For C. leptoporus the observed response of the inorganic carbon content per cell to saturation state was inconsistent with Eq. (1). 4No significant carbonate production response was observed in C. pelagicus.
5In an incubation experiment with Emiliania huxleyi, Sciandra et al. (2003) found a 25% decrease in net calcification rate in response to
an increase in CO2from 400 to 700 ppm. This is a slightly larger calcification response than the 15% decrease observed by Zondervan et
al. (2001) under a comparable increase in pCO2, but still rather lower than the 43% decrease in mesocosm experiments with E. huxleyi
(Delille et al., 2005).
6Coral communities as well as individuals.
7Also see: Yates and Halley (2006a, b) and Schneider and Erez (2006).
weakly affected by changes in saturation. A value of zero is the same as assuming that calcification is independent of saturation.
Marine carbonate production thus gives rise to a negative feedback on climate change, as by suppressing calcification, fossil fuel CO2emissions will cause a reduction in the rate of
CO2release from CaCO3precipitation and accelerate the
re-moval of CO2from the atmosphere (Zondervan et al., 2001).
The net impact of fossil fuel CO2release on the climate
sys-tem will therefore be reduced in the presence of this “CO2
-calcification feedback”.
We address the potential importance of CO2-calcification
feedback to the future sequestration of fossil fuel CO2 by
first collating the calcification responses of different marine organisms to changing CO2−3 and then quantifying the impli-cations of our findings using an Earth system model (Ridg-well et al., 2007; Ridg(Ridg-well and Hargreaves, 2007). We con-sider changes in ocean carbon cycling occurring on up to a millennial timescale, when the most important control is the amount of fossil fuel emitted in conjunction with the im-pact of amplifying positive feedbacks between CO2and
sea-surface temperature (due to reduced CO2solubility at higher
temperatures) and ameliorating negative feedbacks such as between CO2 and calcification. To simplify the analysis,
we ignore the net loss or gain of carbon by the land surface (Lenton et al., 2006). Neither will we consider changes in: shallower water (coral reef) or benthic calcification or the
effect of temperature on calcification (e.g. coral bleaching), or potential changes in the efficiency of export of organic carbon to the deep sea, although we discuss their potential roles later. We also omit the impact of the dissolution of car-bonates in deep-sea sediments as well as the enhancement of carbonate and silicate weathering on land under higher sur-face temperatures – such processes dominate ocean invasion only on time-scales rather longer than ca. 1000 years (Ridg-well and Hargreaves, 2007). Our focus in this paper it thus the direct modulating effect of changes in surface ocean cal-cification on atmospheric CO2through the remainder of the
millennium.
2 Synthesis of experimental calcifier response
The response of a number of different calcifying marine or-ganisms to changes in ambient carbonate chemistry have been investigated to date (summarized in Table 1). How-ever, the experimental setups and chosen manipulations of the carbonate system differ, hindering simple comparison. We address this by calculating the relative change in calcium carbonate production (calcification rate) as a function of a common variable for which we utilize the widely-used de-scription of the rate of precipitation of carbonate minerals as given in Eq. (1) (Zhong and Mucci, 1993).
For each set of experimental manipulations detailed in Table 1, of calcite is calculated from mean dissolved
inorganic carbon and alkalinity concentrations, salinity, and temperature measured over the course of each experi-ment, and using the dissociation constants of Mehrbach et al. (1973), as refitted by Dickson and Millero (1987). For Emiliania huxleyi (in vitro) (Zondervan et al., 2001) (#1) we combine the two different light-dark cycle data-sets, whereas there is sufficient experimental data to separately fit the re-sults of “high light” and “complete darkness” incubations of the foraminifera Orbulina universa (in vitro) (Bijma et al., 1999) (#3). For the E. huxleyi mesocosm experiments (Delille et al., 2005) (#2), we fit all the individual replicates across the three treatments. For the ship-board incubations of phytoplankton assemblages (Riebesell et al., 2000) (#5), we first normalize the calcification rate data to a value of 1.0 at the common CO2(aq)concentration of 10 µmol l−1, before
fitting the results of all 5 experiments together.
In fitting the data, we assume that Eq. (1) holds true and seek the value of η that produces the best fit to the data. The value of the parameter η is crucial, since it represents the degree of non-linearity of response of calcification rate to a change in ambient carbonate ion (CO2−3 ) concentration (and thus ). A high value of η implies that even a mod-est anthropogenically-driven reduction in ocean CO2−3 (and pH) might drive a substantial decrease in CaCO3production,
significantly enhancing fossil fuel CO2uptake by the ocean.
We carry out 100 iterations using the Levenberg-Marquardt algorithm to minimize the least squares misfit between the theoretical curve and the experimental data. We report the standard error associated with the estimated fitted value of η in Table 1.
3 Model configuration and calibration
The range in sensitivities exhibited by calcifying plankton coupled with uncertainty in which plankton groups dominate past, present, and future marine carbonate production (e.g., Schiebel, 2002), means that a single estimate of the strength of CO2-calcification feedback could be misleading. Instead,
we have taken an ensemble approach to the problem and ex-plored a wide range of possible responses, using an ensem-ble Kalman filter (EnKF) calibration (Annan et al., 2005) of ocean carbon cycling in the GENIE-1 Earth system model.
The GENIE-1 model comprises: 3-D ocean circulation model, 2-D energy-moisture balance model (EMBM) of the atmosphere, dynamic-thermodynamic sea-ice model, and representation of atmosphere-ocean-sediment carbon cycling (Ridgwell et al., 2007; Ridgwell and Hargreaves, 2007). We use the same relationship between calcification and satura-tion state () in the GENIE-1 model (Ridgwell et al., 2007) as we used to fit the calcification data (i.e., Eq. 1). In this, we apply a thermodynamically-based modifier of the rate of carbonate production, γ , as a function of the local surface ocean saturation state ():
γ = ( − 1)η for > 1.0 (2a)
γ = 0.0 for ≤ 1.0 (2b)
We link this to biological export production from the surface ocean by relating the export flux of CaCO3(FCaCO3) directly
to the POC flux (FPOC) via a spatially-uniform scalar for the
CaCO3:POC rain ratio (r0CaCO3:POC), but modified by γ :
FCaCO3 =γ × rCaCO3:POC
0 ×F
POC (3)
The biogenic export of CaCO3from the surface ocean in the
model thus increases with a greater ambient environmental degree of super-saturation with respect to the solid carbon-ate phase (>1.0). Carboncarbon-ate production is zero at ≤1 – i.e., we implicitly assume that super-saturation and ther-modynamically favorable environmental conditions are re-quired for pelagic carbonate production. However, while this assumption appears valid for corals, it may not hold for foraminifera. We discuss the implications of this later. In ad-dition, although coccolithophorid and foraminiferal calcifi-cation rates have been observed to respond to changes in sat-uration (e.g., Bijma et al., 1999; Riebesell et al., 2000; Zon-dervan et al., 2001; Delille et al., 2005), we do not explicitly capture other important controls in our formulation of car-bonate production. Instead, we have implicitly collapsed the (poorly understood) ecological and physical oceanographic controls on marine carbonate production onto a single, purely thermodynamic dependence on . Furthermore, while POC production is affected by changes in climate (such as strat-ification) in the GENIE-1 model, for simplicity, we do not additionally modify POC production in response to changes in pH (Zondervan et al., 2001).
We utilized observed 3-D distributions of alkalinity (Key et al., 2004) and phosphate (Conkright et al., 2002) in the ocean, together with the 2-D distribution of CaCO3content
in surface sediments (Archer, 1996) to constrain model pa-rameters controlling the marine carbon cycle using an en-semble Kalman filter (EnKF) as described in Ridgwell et al. (2007) and Ridgwell et al. (2007). The EnKF solves the Kalman equation for optimal linear estimation by using the ensemble statistics to define the mean and covariance of the model’s probability distribution function. In other words, the resulting ensemble members are random samples from this probability distribution function. Although this method is only formally optimal in the case of a linear model and an in-finite ensemble size, it has been shown to work well in cases similar to ours (Hargreaves et al., 2004; Annan et al., 2005). We employ Eqs. (2–3) in calculating CaCO3production, and
calibrate both rCaCO3:POC
0 and η in the EnKF. Six additional
parameters controlling the rate of organic carbon export as a function of available nutrients (PO4) as well as the length
scales of organic carbon and carbonate carbon remineraliza-tion in the ocean interior are also simultaneously calibrated, summarized in Table 2. The size of the ensemble is 54, which is chosen primarily for computational convenience and has no special significance.
Table 2. Summary of the mean EnKF calibrated biogeochemical parameters in the GENIE-1 model (Ridgwell and Hargreaves, 2007).
Parameter symbol Calibrated mean1 Parameter description Fig. 1 sub-plot uPO4
0 1.96 (±0.34) µmol kg
−1yr−1 maximum PO
4uptake (removal) rate (a)
KPO4 0.22 (±0.065) µmol kg−1 PO
4Michaelis-Menton half-saturation concentration (b)
rPOC 0.065 (±0.011) initial proportion of POC export as recalcitrant fraction (c) lPOC 550 (±59) m e-folding remineralization depth of non- recalcitrant POC fraction (d) rCaCO3:POC
0 0.044 (+0.038/−0.024)2,3 CaCO3:POC: export rain ratio scalar (Eq. 3) (e)
η 0.81 (±0.28) thermodynamic calcification rate power (Eq. 2) (f) rCaCO3 0.468 (±0.07) initial proportion of CaCO3export as recalcitrant fraction (g) lCaCO3 1083 (±244) m e-folding remineralization depth of non- recalcitrant CaCO
3fraction (h) 1Quoted as the mean of the entire EnKF ensemble plus 1 standard deviation of the calibrated parameter value.
2The rain ratio scalar parameter is not the same as the CaCO
3:POC export rain ratio as measured at the base of the euphotic zone because
rCaCO3:POC
0 is further multiplied by (−1)ηto calculate the rain ratio, where is the surface ocean saturation state with respect to calcite
(see Sect. 3). Pre-industrial mean ocean surface is ∼5.2 in the GENIE-1 model, so that the global CaCO3:POC export rain ratio can be
estimated as being equal to (5.2–1)0.81×0.044=0.14.
3The ± standard deviation values differ because EnKF calibration of this particular parameter was carried out in log space.
1 2 3 4 0 5 10 15 20 25 30 u 0(PO4) (mol kg -1yr-1) 0 0.2 0.4 0 5 10 15 20 25 30 K(PO 4) (mol kg -1) 0 0.1 0.2 0 5 10 15 20 25 30 r 2(POC) 400 600 800 0 5 10 15 20 25 30 l 1(POC) (m) -2.50 -2 -1.5 -1 5 10 15 20 25 30 3 0 1 2 0 5 10 15 20 25 30 η 0 0.5 1 0 5 10 15 20 25 30 r 2 3) 500 0 5 10 15 20 25 30 l 1 3 number of ensemble members number of ensemble members
(a)
(b)
(c)
(d)
(e)
(f)
(g)
(h)
log10( )Fig. 1. Distributions of the eight parameters which were varied independently to produce a 54 member ensemble via calibration with the EnKF (http://www.biogeosciences.net/4/481/2007/bg-4-481-2007-supplement.zip). The parameters are described in Ridgwell et al. (2007) and summarized in Table 2.
The resulting frequency distribution of calibrated parame-ter values is shown in Fig. 1. Although all ensemble mem-bers are tuned to the observations, we obtain a large range of η across the ensemble members (0.19 to 1.55) because the scaling constant rCaCO3:POC
0 (Eq. 3) introduces a degree
of freedom in fitting modern ocean alkalinity and sedimen-tary CaCO3 distributions (see Ridgwell et al., 2007). The
values we obtain for η thus strongly reflect our prior as-sumption of a 1 standard deviation of η spanning the range 0–1.5, which is informed by the results of our analysis of
experimental manipulations (Table 1). The relationship be-tween rCaCO3:POC
0 and η is determined by the EnKF itself,
consistent with the ocean and sediment data. Thus, although this means that we cannot deduce the most probable value for
η from marine geochemical observations using our model,
we can address the sensitivity of the marine carbon cycle to the wide range of uncertainty in η by carrying out experi-ments using the full 54-member ensemble of model instances (rather than a just single model composed of the parameter value means).
We refer readers to Ridgwell and Hargreaves (2007) for critical assessment of the ensemble mean of this calibration and to Ridgwell et al. (2007) for a similar calibration but omitting sediment composition. For the analysis presented here, the most relevant model prediction is that of pelagic CaCO3 production in the open ocean. In the calibrated
model, mean CaCO3 export is 1.2 PgC yr−1, very close to
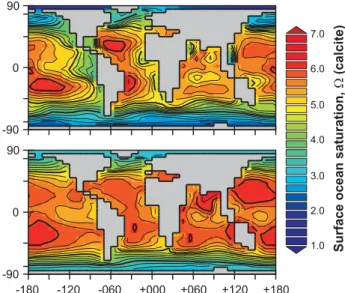
other observational-based estimates (e.g., Feely et al., 2004; Jin et al., 2006). The GENIE-1 model also successfully cap-tures the latitudinal trends in the zonal mean of ocean satu-ration () with respect to calcite, although it generally pre-dicts some ∼0.5 units higher than observations and does not reproduce the distinct geochemistry characterizing con-tinental margin upwelling zones, as shown in Fig. 2. The consequence of this model-data mismatch will be a slight under-estimate of the strength of CO2-calcification feedback
in the model because initial is slightly further away from the threshold of zero calcification (=1, as defined by Eq. 2) than it should be.
4 Future impacts of reduced marine calcification on fos-sil fuel CO2uptake
We run the 54 member ensemble under a single illustra-tive CO2 emissions scenario, based on the assumption of
all conventional fossil fuel reserves (ca. 4000 PgC) being used up sometime early in the 24th century (Lenton et al., 2006) (Fig. 3a), an amount slightly less than that assumed by Caldeira and Wickett (2003). The ensemble members are run in each of four permutations of feedbacks operating: (i) no CO2-calcification or CO2-climate feedbacks, (ii) just the
CO2-climate feedback, (iii) just the CO2-calcification
feed-back, and (iv) both CO2-calcification and CO2-climate
feed-backs. The numerical efficiency of the GENIE-1 model is critical, as this combined sensitivity + feedback analysis rep-resents a total of: 4×54×3000=648 000 years of coupled 3-D ocean carbon cycle/climate model simulation, which we achieve in just a few days on a small computing cluster.
The evolution with time of the strength of the CO2
-calcification feedback is shown in Fig. 3 for the ensemble mean model, and for the individual members in Fig. 4. We find that historical fossil fuel CO2emissions drive an
ensem-ble mean reduction in calcite saturation state () from 5.2 to 4.5 by the year 1994, leading to a 13% decrease in marine
-180 -90 90 0 -90 90 0 2.0 1.0 -120 -060 +000 +060 +120 +180 Surface ocean saturation, (calcite) W 3.0 4.0 5.0 6.0 7.0
Fig. 2. Surface ocean saturation state. The top panel shows the observationally-derived annual average pre-Industrial saturation state () for calcite, which we calculate from 3-D data-sets of DIC and ALK (Key et al., 2004) together with temperature, salinity, PO4, and H4SiO4(Conkright et al., 2002), transformed onto the GENIE-1 model 36×36 equal area model grid and integrated over the uppermost 75 m. We use the same carbonate chemistry scheme as used in GENIE-1 (Ridgwell et al., 2007) in this calculation. The lower panel shows the model-predicted annual average based on the calibrated parameter value means (Ridgwell and Hargreaves, 2007) (see Table 2).
carbonate production (Fig. 3d) as a consequence of Eq. (2). The contribution to the 1994 oceanic anthropogenic CO2
in-ventory (estimated at 118±19 PgC (Sabine et al., 2004)) due to CO2-calcification feedback (1CO2) and including climate
feedbacks in the model is no more than 3.2 PgC at this time (Fig. 4), even under the ensemble end-member with the high-est sensitivity to ocean acidification (η=1.55).
Deviations from the best fit line across the ensemble (Fig. 4) reflect the influence of factors that affect CO2
se-questration, other than differences in the value of η. For instance, the ensemble exhibits initial (year 1765) global CaCO3export of between 1.05 and 1.59 PgC yr−1, similar to
recent data-based production estimates of 0.8–1.4 PgC yr−1 (Feely et al., 2005; Jin et al., 2006). Because there is no significant correlation with the value of η across the ensem-ble (R2∼0.03), our model experiment encapsulates a sensi-tivity test of the strength of CO2-calcification feedback to
uncertainties in initial (pre-industrial) global carbonate pro-duction. The relatively muted scatter (R2>0.94) of the
en-semble members about the best fit line (Fig. 4) indicates that CO2sequestered due to ocean acidification is relatively
insensitive to assumptions regarding initial carbonate pro-duction in the open ocean in the ensemble. Particulate or-ganic carbon (POC) export varies from 7.9 to 12.0 PgC yr−1
200 400 600 800 1000 1200 1400 1800 2000 2200 2400 2600 2800 3000 year 0 5 10 20 15 1765 2100 2300 3000 0 100 -100 200 Emissions (PgC yr ) -1 (i) no feedbacks (ii) +climate (iii) +CaCO3 (iv) +climate+CaCO3 0.0 0.2 0.4 0.6 0.8 1.0 Global CaCO export (PgC yr ) 3 -1 1.2 1.4
d
c
a
b
1994 CO (ppm) 2 D CO 2 D CO 2Fig. 3. Atmospheric CO2and marine carbonate production responses to fossil fuel CO2release. In this, a single model instance employing
the ensemble mean parameter set (Table 2) rather than all individual members of the ensemble is used here to illustrate the impact of CO2-calcification feedback. (a) Time-history of the rate of CO2emissions to the atmosphere prescribed in the model (see Lenton et al.,
2006). (b) Evolution of atmospheric CO2in experiments with: (i) neither climate nor calcification changes (solid line), (ii) “CO2-climate”
feedbacks operate (dotted line), (iii) calcification responds to atmospheric CO2(i.e., “CO2-calcification” feedback) (dashed line), and (iv) both CO2-calcification and CO2-climate feedbacks operate (dot-dash line). (c) The impact on the evolution of atmospheric CO2of the two
feedbacks is shown, both individually, and combined (and compared to the baseline (i.e., no feedbacks) scenario). The grey arrows illustrate how the strength of CO2-calcification feedback (1CO2) is calculated – i.e., as the difference between the atmospheric CO2responses with
and with-out calcification responding to acidification. The 1CO2values themselves are plotted in Fig. 4 for all the ensemble members,
while the time-slices at which CO2is calculated (years; 1994, 2100, 2300, 3000) are marked by vertical dotted lines. (d) The response of
global carbonate export under the different permutations of feedback. In the absence of any response of calcification to changing carbonate saturation, CaCO3export declines in response to fossil fuel emissions as a result of changes in ocean circulation (stratification) when
0.0 h 0.5 1.0 1.5 2.0 0 D C O ( ) 2 Pg C 10 20 40 0 D C O (P g C ) 2 100 0 1 2 3 4 D C O ( ) 2 Pg C 0 D C O ( ) 2 P g C 50 100
Increasing sensitivity of calcification to W
150 50 5 30 200 250 h
without climate feedback with climate feedback
year 1994 year 1994 year 3000 year 2300 year 2100 year 2300 year 2100 year 3000 0.0 0.5 1.0 1.5 2.0 1 4 5 7 1 2 3 4 5 2 3 6 0 uncertainty ranges from experiment results
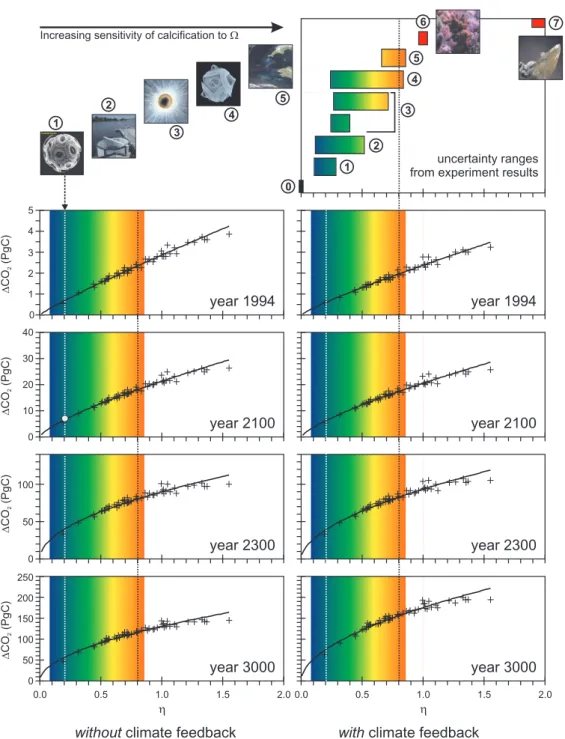
Fig. 4. Response of the 54-member ensemble of realizations of the GENIE-1 Earth system model to CO2emissions. The strength of the CO2-calcification feedback (see Fig. 3) is plotted against the calcification rate sensitivity (η) (Eq. 2) for each of 4 time-slices. Crosses
represent individual ensemble members with results shown for the strength of the CO2-calcification feedback both with (RH side panels)
and without (LH side) further feedbacks with climate. The filled grey circle represents the year 2100 prediction of the ocean GCM of Heinze (2004), which assumed the calcification sensitivity of Emiliania huxleyi (Zondervan et al., 2001) (indicated by the vertical dotted white line) and no feedbacks with climate (and calculated at a comparable atmospheric CO2concentration). The values of η corresponding to the
characteristics of different calcifying systems are highlighted at the top, with mean η value and uncertainty limits as given in Table 1: #0 the coccolithophorid Coccolithus pelagicus (in vitro) (Langer et al., 2006), #1, the coccolithophorid Emiliania huxleyi (in vitro) (Zondervan et al., 2001), #2, E. huxleyi mesocosms (Delille et al., 2005), #3, the foraminifer Orbulina universa (in vitro) (Bijma et al., 1999), #4, the coccolithophorid Gephyrocapsa oceanica (in vitro) (Zondervan et al., 2001), and #5, ship-board incubations of phytoplankton assemblages (Riebesell et al., 2000). Shown for comparison only are: #6, corals (as summarized by Langdon and Atkinson (2005)), and #7, “abiotic” precipitation (i.e., occurring in the absence of any biological intervention) (Zhong and Mucci, 1993). The ensemble mean value (η=0.81) is indicated by a vertical dotted black line. We chose a simple power law fit to illustrate the trend across the ensemble (solid line). However, while this provides a close approximation with R2>0.94 in each case, a rather more complex function might provide a better fit.
Depth (km) 0 1 2 3 4 5 0 -90 -60 -30 30 60 -90 -60 -30 0 30 -90 -60 -30 0 30 60 90 2250 2300 2350 2400 2450 Depth (km) 0 1 2 3 4 5 Atlantic Ocean Depth (km) 0 1 2 3 4 5 YEAR 1765 OBSER V A TIONS YEAR 2300 YEAR 3000
Indian Ocean Pacific Ocean
Depth (km) 0 1 2 3 4 5 0 -90 -60 -30 30 60 -90 -60 -30 0 30 -90 -60 -30 0 30 60 90 S N S N S N
Fig. 5. Reorganization of the ocean alkalinity structure. The zonal mean distribution of alkalinity (ALK) undergoes a large-scale reorgani-zation in response to the reduction in marine carbonate production. Shown compared to observations (Key et al., 2004) (top panel) are the predictions of the ensemble mean model (η=0.81) for the years: 1765, 2300, and 3000.
across the ensemble, but with only 2 members exhibiting POC export greater than 9.9 PgC yr−1. The clustering in the range ∼8–10 PgC yr−1is consistent with published inter-model variability (e.g., Aumont et al., 2003; Heinze et al., 1999; Schmittner et al., 2005).
Ocean saturation and marine carbonate production decline (Fig. 3d) until around the year 2300 when a peak atmo-spheric CO2 concentration of ∼1400 ppm is reached in
re-sponse to emissions. Our model ensemble predicts the addi-tional sequestration of 33–107 PgC due to CO2-calcification
feedback at this time (Fig. 4). Although marine carbonate production starts to recover thereafter, the effect of CO2
-calcification feedback (1CO2) continues to increase,
reach-ing 62–199 PgC by the next Millennium.
The persistence of the impact of reduced calcification re-flects the time needed to establish a new alkalinity (ALK) structure in the ocean (Fig. 5). By the year 3000 a pro-found reorganization has occurred, in which the ALK gra-dients induced by nitrate uptake and remineralization start to dominate over the initially much stronger opposite effect
due to the precipitation and dissolution of CaCO3. For
in-stance, ALK becomes almost as high in the deep North At-lantic compared to the North Pacific by year 3000, whereas in the modern ocean there is a very pronounced Atlantic → Pacific gradient.
5 Discussion
Calcifying organisms studied in vitro exhibit a wide range of sensitivities of calcification to saturation state (e.g., Ta-ble 1). In contrast, marine ecosystem models have generally assumed a single species (Emiliania huxleyi) is representa-tive of carbonate production in the open ocean (e.g., Moore et al., 2002; Le Qu´er´e et al., 2005). This is problematic, because while E. huxleyi forms large blooms over wide ar-eas of the ocean is not thought to be a particularly important calcifying coccolithophorid (Broerse et al., 2000; Ziveri and Thunell, 2000). We find that this species also exhibits one of the lowest observed calcification sensitivities to a change in CO2in vitro (although it is somewhat higher in mescosms
– see below). Furthermore, foraminifera such as Orbulina universa which appear to be rather more sensitive than E. huxleyi, may dominate carbonate export globally (Schiebel, 2002).
There are also substantial differences between the re-sults of different experimental methodologies with the same species – for instance, an approximate tripling of atmo-spheric CO2concentration drove a 10–19% reduction in
car-bonate production by Emiliania huxleyi when studied in vitro (Riebesell et al., 2000; Zondervan et al., 2001) but 42% un-der a similar CO2change in a mesocosm bloom experiment
(Delille et al., 2005). Furthermore, incubated natural phy-toplankton assemblages from the North Pacific have shown decreases in the rate of calcification of up to 83% over this same atmospheric CO2range (Riebesell et al., 2000).
The assemblage incubation results may reflect a delay in coccolith production (Delille et al., 2005). Differences in methodologies also exist between the perturbation studies in how CO2is controlled and which could affect the deduced
sensitivity of calcification: for instance Delille et al. (2005) bubbled CO2to achieve required CO2values whereas
Riebe-sell et al. (2000) and Zondervan et al. (2001) added acid and base in some experiments. However, we think that the ap-parent progression observed in carbonate production sensi-tivity: in vitro → mesocosms → natural assemblages might be important. It could reflect either a higher calcification sus-ceptibility of un-characterized calcifying plankton species or an amplification of acidification impacts on carbonate pro-duction by ecosystem dynamics, perhaps reflecting a lower fitness of calcifying plankton, which would result in fewer individuals in addition to less CaCO3production per
individ-ual. If so, in making species response inter-comparison, use of a standard experimental protocol would be advantageous. The enhancement of marine sequestration of fossil fuel CO2 by the next Millennium (Fig. 4) as a result of reduced
surface ocean calcification represents 4–13% of the atmo-spheric fossil fuel CO2burden at this time (the anthropogenic
excess over the pre-industrial inventory). Thus, while CO2
-calcification feedback reduces the peak atmospheric CO2
concentration by ∼15–49 ppm in our experiment, its im-portance relative to atmospheric CO2 is rather greater on
the millennial-scale (∼29–93 ppm). The inclusion of a cli-mate component (Edwards and Marsh, 2005) in the GENIE-1 Earth system model allows us to assess the importance of changes in climate on the CO2-calcification feedback.
Changes in ocean surface temperatures affect CO2
solubil-ity and ocean stratification, which in turn affects the rate of CO2 invasion into the ocean and nutrient supply up to the
surface. This amplifies by up to one third the change in CO2
sequestration that is directly driven by reduced calcification (contrast the L.H. and R.H. panels in Fig. 4).
A number of mechanisms have not been taken into ac-count in this Earth system model analysis, which could af-fect estimates of the overall importance of CO2-calcification
feedback. For instance, the effect of ecosystem changes on
the average sinking rate and penetration depth of POC may act in either direction depending on the species that become more abundant (e.g., Bopp et al., 2003), amplifying or dimin-ishing the net response of the marine carbon cycle to ocean acidification. However, we do not distinguish the contribu-tion of different phytoplankton “funccontribu-tional types” to total ex-port production in the current model (Ridgwell et al., 2007). There are also physiological effects of higher ambient con-centrations of dissolved CO2(and lower pH) in driving more
POC production per cell, an effect that has been observed to be substantial in E. huxleyi and G. oceanica (Zondervan et al., 2001). The consequential increase in the efficiency of the biological pump would act as a negative feedback on ris-ing atmospheric CO2. Similarly, any future decline in coral
calcification (Kleypas et al., 1999) or increase in the disso-lution of aragonite and/or high magnesium calcite, none of which we consider here, would act to increase the seques-tration of fossil fuel CO2. Finally, a reduction in carbonate
production could also affect the transport of organic matter into the deep ocean (Ridgwell, 2003) – the ballast hypothesis (Armstrong et al., 2002). The consequence of a mechanis-tic dependence of organic carbon transport on the carbonate flux would be a reduction in the strength of CO2-calcification
feedback (Barker et al., 2003; Heinze, 2004). However, al-ternative interpretations of sediment trap correlations do not require the efficiency of the organic carbon pump to be de-pendent on the CaCO3 flux (Francois et al., 2002; Passow
and De La Rocha, 2006).
The caveats discussed above are all, in principal at least, accessible to model analysis. The primary source of uncer-tainty in quantifying the impact of ocean acidification on fu-ture ocean CO2uptake lies in the model representation of the
calcification response to ocean acidification. Estimates can be made of likely parameter values, as we have demonstrated in this paper in the context of the power η (Table 1, Fig. 1) but the form of the most appropriate parameterization to de-scribe the calcification response is not known a priori. Here we have assumed that calcification ceases at =1.0 (Eq. 2), analogous to the abiotic precipitation response (Eq. 1). For corals, the general trend across a range studies appears con-sistent with our assumption (Langdon and Atkinson, 2005). However, organisms exerting a much stronger degree of con-trol over the calcification process, particularly foraminifera, need not be so constrained.
It is outside the scope of this paper to address formally the importance of model structural uncertainty in quanti-fying the strength of the CO2-calcification feedback. (By
“model structural uncertainty”, we mean the uncertainty in the model representation of the mechanisms involved rather than due to uncertainties in observational data-sets, includ-ing those used for constraininclud-ing parameter values.) Instead, we have evaluated the results of different GCM-based anal-yses of the CO2-calcification feedback. For instance, Heinze
(2004) parameterized a response of the CaCO3:POC rain
HAMOCC ocean carbon cycle model by modifying carbon-ate production in proportion to the deviation from modern surface ocean conditions of CO2 partial pressure. The
pa-rameter values in the relationship were informed by the lab-oratory experiments on Emiliania huxleyi (Zondervan et al., 2001). We find a very comparable response when we take our value of η from the same calcification manipulation ex-periments (η=0.2 for Emiliania huxleyi in vitro – see Ta-ble 1) and set climate invariant. Our predicted year 2100 (with 774 ppm CO2in the atmosphere) enhancement of
ma-rine CO2sequestration due to CO2-calcification feedback is
6.5 PgC (Fig. 4), almost identical to the 3.5 ppm (∼7 PgC) calculated by Heinze (2004) at year 2100 (∼800 ppm CO2in
the atmosphere).
In a more recent model analysis, Gehlen et al. (2007) predicted a 29% smaller calcification response at 4× CO2
(1112 ppm) as compared to Heinze (2004) under a similar atmospheric CO2 forcing. Gehlen et al. (2007) assumed a
rather different, Michaelis-Menten type formulation, but like Heinze (2004) calibrated their calcification parameterization mainly against the in vitro experimental response of Emil-iania huxleyi (Zondervan et al., 2002), although mesocosm data (Delille et al., 2003) was also included. Their curve fit can be approximated (over a range in of 2–6) by a value of η of around 0.2–0.25 using our Eq. (2), from which we predict the additional CO2 sequestration due to CO2
-calcification feedback of 6.5–7.7 PgC (Fig. 4) at ∼3×CO2,
compared to 5.9 PgC in Gehlen et al. (2007) at 4×CO2.
Although other model differences such as saturation-dependent water column dissolution of carbonates (Gehlen et al., 2007) prevent straight-forward inter-comparison, the spread across the 3 different models and associated parame-terizations is no more than a factor of 2 in estimating the po-tential enhancement of CO2uptake. The greater uncertainty
in predicting future rates of fossil fuel CO2 uptake by the
ocean is thus the species calcification response in conjunc-tion with which species dominate pelagic carbonate produc-tion. Indeed, recent research reveals some species of coccol-ithophorid exhibit rather unexpected responses to simulated changes in ocean acidification in vitro, with Calcidiscus lep-toporus actually increasing CaCO3production per cell at
el-evated CO2partial pressures (Langer et al., 2006).
6 Conclusions
Our analysis highlights the importance of the prevailing un-certainties regarding the controls on marine carbonate pro-duction and calcifier response to anthropogenic ocean acid-ification. We conclude from the experimental data cur-rently available that the response of carbonate production to a change in environmental chemistry as measured in vitro is not a good indication of the ecosystem (or global) level response. We also find that the behavior of the coccol-ithophorid Emiliania huxleyi to increasing CO2 is rather
small compared to coccolithophores species such as Gephy-rocapsa oceanica, foraminifera, and corals. Ecosystem mod-els that adopt this species as their “functional type” for carbonate production may underestimate the importance of CO2-calcification feedback on future climate change. The
importance of the differences in species response is under-lined by our model inter-comparison, which suggests that uncertainty in the model predictions is dominated by as-sumptions regarding the representative carbonate-producing species rather than the form of the relationship linking calci-fication to ocean acidicalci-fication per se. Further mesocosm ex-periments and higher level manipulations of more complete ecosystems, together with a better quantification of which calcifying species control CaCO3 production globally and
the spatial distribution and (environmental and ecological) controls on this production, will be critical in making more reliable assessments of the future impact of ocean acidifica-tion and feedback with atmospheric CO2.
Acknowledgements. AR acknowledges support from Canada
Research Chairs, the Canadian Foundation for Climate and Atmo-spheric Sciences, and the Trusthouse Charitable Foundation. IZ’s contribution was supported by Netherlands-Bremen Cooperation in Oceanography (NEBROC II). TML’s contribution is part of the NERC e-Science GENIEfy project (NE/C515904). Computer facilities for the EnKF calculations were provided by JAMSTEC. Edited by: C. Heinze
References
Annan, J. D., Hargreaves, J. C., Edwards, N. R., and Marsh, R.: Parameter estimation in an intermediate complexity earth system model using an ensemble Kalman filter, Ocean Model., 8, 135– 154, 2005.
Archer, D.: An atlas of the distribution of calcium carbonate in sed-iments of the deep sea, Global Biogeochem. Cy., 10, 159–174, 1996.
Armstrong, R. A., Lee, C., Hedges, J. I., Honjo, S., and Wakeham, S. G.: A new, mechanistic model for organic carbon fluxes in the ocean: based on the quantitative association of POC with ballast minerals, Deep-Sea Res. II, 49, 219–236, 2002.
Aumont, O., Maier-Reimer, E., Blain, S., and Monfray, P.: An ecosystem model of the global ocean including Fe, Si, P colimitations, Global Biogeochem. Cy., 17, 1060, doi:10.1029/2001GB001745, 2003.
Barker, S., Higgins, J. A., and Elderfield, H.: The future of the carbon cycle: review, calcification response, ballast and feedback on atmospheric CO2, Philos. T. Roy. Soc. A, 361, 1977–1999,
2003.
Bijma, J., Spero, H. J., and Lea, D.W.: Reassessing foraminiferal stable isotope geochemistry: Impact of the oceanic carbonate system (Experimental Results), in: Use of proxies in paleo-ceanography: Examples from the South Atlantic, edited by: Fis-cher, G. and Wefer, G., Springer-Verlag Berlin Heidelberg, 489– 512, 1999.
Bopp, L., Kohfeld, K. E., Le Quere, C., and Aumont, O.: Dust impact on marine biota and atmospheric CO2during glacial
pe-riods, Paleoceanography, 18, 1046, doi:10.1029/2002PA000810, 2003.
Broerse, A. T. C., Ziveri, P., Hinte, J. E. v., and Honjo, S.: Coccol-ithophore export production, seasonal species composition and coccolith CaCO3 fluxes in the NE Atlantic (34◦N, 21◦W and
48◦N, 21◦W), Deep-Sea Res. II, 47, 1877–1905 2000. Caldeira, K. and Wickett, M. E.: Anthropogenic carbon and ocean
pH, Nature, 425, p. 365, 2003.
Conkright, M. E., Antonov, J. I., Baranov, O. K., et al.: World Ocean Database 2001, Volume 1, Introduction, edited by: Lev-itus, S., NOAA Atlas, NESDIS 42, U.S. Government Printing Office, Washington, D.C., 167 pp., 2002.
Delille, B., Harlay, J., Zondervan, I., et al.: Response of primary production and calcification to changes of pCO2during
experi-mental blooms of the coccolithophorid Emiliania huxleyi, Global Biogeochem. Cy., 19, GB2023, doi:10.1029/2004GB002318, 2005.
Dickson, A. G. and Millero, F. J.: A comparison of the equilibrium constants for the dissociation of carbonic acid in seawater media, Deep-Sea Res., 34, 1733–1743, 1987.
Edwards, N. R. and Marsh, R.: Uncertainties due to transport-parameter sensitivity in an efficient 3-D ocean-climate model, Clim. Dynam., 2, 415–433, 2005.
Feely, R. A., Sabine, C. L., Lee, K., et al.: Impact of anthropogenic CO2on the CaCO3system in the oceans, Science, 305, 362–366,
2004.
Francois, R., Honjo, S., Krishfield, R., and Manganini, S.: Factors controlling the flux of organic carbon to the bathy-pelagic zone of the ocean, Global Biogeochem. Cy., 16, 1087, doi:10.1029/2001GB001722, 2002.
Gehlen, M., Gangstø, R., Schneider, B., Bopp, L., Aumont, O., and Ethe, C.: The fate of pelagic CaCO3production in a high
CO2 ocean: A model study, Biogeosciences Discuss., 4, 533–
560, 2007,
http://www.biogeosciences-discuss.net/4/533/2007/.
Hargreaves, J. C., Annan, J. D., Edwards, N. R., and Marsh, R.: Climate forecasting using an intermediate complexity Earth Sys-tem Model and theEnsemble Kalman Filter, Clim. Dynam., 23, 745–760, 2004.
Heinze, C., Maier-Reimer, E., Winguth, A. M. E., and Archer, D.: A global oceanic sediment model for long-term climate studies, Global Biogeochem. Cy., 13, 221–250, 1999.
Heinze, C.: Simulating oceanic CaCO3 export production
in the greenhouse, Geophys. Res. Lett., 13, L16308, doi:10.1029/2004GL020613, 2004.
Jin, X., Gruber, N., Dunne, J., Sarmiento, J. L., and Armstrong, R. A.: Diagnosing the contribution of phytoplankton functional groups to the production and export of POC, CaCO3and opal
from global nutrient and alkalinity distributions, Global Bio-geochem. Cy., 20, GB2015, doi:10.1029/2005GB002532, 2006. Key, R. M., Kozyr, A., Sabine, C. L., et al.: A global
ocean carbon climatology: Results from Global Data Analy-sis Project (GLODAP), Global Biogeochem. Cy., GB4031, 18, doi:10.1029/2004GB002247, 2004.
Kleypas, J. A., Buddemeier, R. W., Archer, D., et al.: Geochemical consequences of increased atmospheric carbon dioxide on coral reefs, Science, 284, p. 118, 1999.
Langdon, C. and Atkinson, M. J.: Effect of elevated pCO2on pho-tosynthesis and calcification of corals and interactions with
sea-sonal change in temperature/irradiance and nutrient enrichment, J. Geophys. Res., 110, C09S07, doi:10.1029/2004JC002576, 2005.
Langer G., Geisen, M., Baumann, K.-H., Kl¨as, J., Riebesell, U., Thoms, S., and Young, J. R.: Species-specific responses of calci-fying algae to changing seawater carbonate chemistry, Geochem. Geophys. Geosyst., 7, Q09006, doi:10.1029/2005GC001227, 2006.
Lenton, T. M., Williamson, M. S., Edwards, N. R., Marsh, R. J., Price, A. R., Ridgwell, A. J., Shepherd, J. G., Cox, S. J., and the GENIE team: Millennial timescale carbon cycle and climate change in an efficient Earth system model, Clim. Dynam., 26, 687–711, doi:10.1007/s00382-006-0109-9, 2006.
Le Qu´er´e, C., Harrison, S. P., Prentice, I. C., et al.: Ecosystem dy-namics based on plankton functional types for global ocean bio-geochemistry models, Glob. Change Biol., 11, 2016–2040, 2005. Mehrbach, C., Culberson, C. H., Hawley, J. E., and Pytkow-icz, R. M.: Measurement of the apparent dissociation constants of carbonic acid in seawater at atmospheric pressure, Limnol. Oceanogr., 18, 897–907, 1973.
Moore, J. K., Doney, S. C., Kleypas, J. A., et al.: An intermedi-ate complexity marine ecosystem model for the global domain, Deep-Sea Res. II, 49, 403–462, 2002.
Orr, J. C., Fabry, V. J., Aumont, O., et al.: Anthropogenicocean acidification over the twenty-first century and its impact on cal-cifying organisms, Nature, 437, 681–686, 2005.
Passow, U. and De La Rocha, C. L.: Accumulation of mineral ballast on organic aggregates, Global Biogeochem. Cy., 20, GB1013, doi:10.1029/2005GB002579, 2006.
Ridgwell, A. J.: An end to the ‘rain ratio’ reign?, Geochem. Geo-phys. Geosys., 4, 1051, doi:10.1029/2003GC000512, 2003. Ridgwell, A., Hargreaves, J., Edwards, N., Annan, J., Lenton, T.,
Marsh, R., Yool, A., and Watson, A.: Marine geochemical data assimilation in an efficient Earth System Model of global biogeo-chemical cycling, Biogeosciences, 4, 87–104, 2007,
http://www.biogeosciences.net/4/87/2007/.
Ridgwell, A. and Hargreaves, J. C.: An efficient Earth System Model of Global biogeochemical cycling: Regulation of atmo-spheric CO2 by deep-sea sediments, Global Biogeochem. Cy.,
21, GB2008, doi:10.1029/2006GB002764, 2007.
Riebesell, U., Zondervan, I., Rost, B., Tortell, P. D., Zeebe, R. E., Morel, F. M. M.: Reduced calcification of marine plankton in response to increased atmospheric CO2, Nature, 407, 364–367,
2000.
Sabine, C. L., Feely, R. A., Gruber, N., et al.: The Oceanic Sink for Anthropogenic CO2, Science, 305, 367–371, 2004.
Schiebel, R.: Planktic foraminiferal sedimentation and the ma-rine calcite budget, Global Biogeochem. Cy., 16, 1065, doi:10.1029/2001GB001459, 2002.
Schneider, K. and Erez, J.: The effect of carbonate chemistry on calcification and photosynthesis in the hermatypic coral Acrop-ora eurystoma, Limnol. Oceanogr., 51, 1284–1293, 2006. Schmittner, A., Oschlies, A., Giraud, X., Eby, M., and Simmons,
H. L.: A global model of the marine ecosystem for long-term simulations: Sensitivity to ocean mixing, buoyancy forcing, par-ticle sinking, and dissolved organic matter cycling, Global Bio-geochem. Cy., 19, GB3004, doi:10.1029/2004GB002283, 2005. Sciandra, A., Harlay, J., Lef`evre, D., Lem´ee, R., Rimmelin, P., Denis, M. and Gattuso, J.-P.: Response of the coccolithophorid
Emiliania huxleyi to elevated partial pressure of CO2 under ni-trate limitation, Mar. Ecol.-Prog. Ser., 261, 111–122, 2003. Yates, K. K. and Halley, R. B.: CO2−3 concentration and pCO2
thresholds for calcification and dissolution on the Molokai reef flat, Hawaii, Biogeosciences, 3, 357–369, 2006a.
Yates, K. K. and Halley, R. B.: Diurnal variation in rates of calcifi-cation and carbonate sediment dissolution in Florida Bay, Estu-aries Coasts, 29, 24–39, 2006b.
Ziveri, P. and Thunell, R. C.: Coccolithophore export production in Guaymas Basin, Gulf of California: Response to climate forcing, Deep-Sea Res. II, 47, 2073–2100, 2000.
Zhong, S. J., Mucci, A.: Calcite precipitation in seawater using a constant addition technique – a new overall reaction kinetic ex-pression, Geochim. Cosmochim. Ac., 57, 1409–1417, 1993. Zondervan, I., Zeebe, R. E., Rost, B., and Riebesell, U.: Decreasing
marine biogenic calcification: A negative feedback on rising at-mospheric pCO2, Global Biogeochem. Cy., 15, 507–516, 2001.
Zondervan, I., Rost, B., and Riebesell, U.: Effect of CO2
con-centration on the PIC/POC ratio in the coccolithophore
Emilia-nia huxleyi grown under light-limiting conditions and different