HAL Id: hal-00302214
https://hal.archives-ouvertes.fr/hal-00302214
Submitted on 18 Oct 2006HAL is a multi-disciplinary open access
archive for the deposit and dissemination of sci-entific research documents, whether they are pub-lished or not. The documents may come from teaching and research institutions in France or abroad, or from public or private research centers.
L’archive ouverte pluridisciplinaire HAL, est destinée au dépôt et à la diffusion de documents scientifiques de niveau recherche, publiés ou non, émanant des établissements d’enseignement et de recherche français ou étrangers, des laboratoires publics ou privés.
Application of absolute principal component analysis to
size distribution data: identification of particle origins
T. W. Chan, M. Mozurkewich
To cite this version:
T. W. Chan, M. Mozurkewich. Application of absolute principal component analysis to size dis-tribution data: identification of particle origins. Atmospheric Chemistry and Physics Discussions, European Geosciences Union, 2006, 6 (5), pp.10493-10522. �hal-00302214�
ACPD
6, 10493–10522, 2006 Aerosol size distribution source identification T. W. Chan and M. Mozurkewich Title Page Abstract Introduction Conclusions References Tables Figures J I J I Back Close Full Screen / EscPrinter-friendly Version Interactive Discussion Atmos. Chem. Phys. Discuss., 6, 10493–10522, 2006
www.atmos-chem-phys-discuss.net/6/10493/2006/ © Author(s) 2006. This work is licensed
under a Creative Commons License.
Atmospheric Chemistry and Physics Discussions
Application of absolute principal
component analysis to size distribution
data: identification of particle origins
T. W. Chan1,*and M. Mozurkewich11
Department of Chemistry and Centre for Atmospheric Chemistry, York University, Toronto, Ontario, Canada
*
now at: Environment Canada, Toronto, Ontario, Canada
Received: 15 August 2006 – Accepted: 26 September 2006 – Published: 18 October 2006 Correspondence to: M. Mozurkewich ([email protected])
ACPD
6, 10493–10522, 2006 Aerosol size distribution source identification T. W. Chan and M. Mozurkewich Title Page Abstract Introduction Conclusions References Tables Figures J I J I Back Close Full Screen / EscPrinter-friendly Version Interactive Discussion
Abstract
Absolute principal component analysis can be applied, with suitable modifications, to atmospheric aerosol size distribution measurements. This method quickly and conve-niently reduces the dimensionality of a data set. The resulting representation of the data is much simpler, but preserves virtually all the information present in the original
5
measurements. Here we demonstrate how to combine the simplified size distribution data with trace gas measurements and meteorological data to determine the origins of the measured particulate matter using absolute principal component analysis. We have applied the analysis to four different sets of field measurements that were con-ducted at three sites in southern Ontario. Several common factors were observed at all
10
the sites; these were identified as photochemically produced secondary aerosol parti-cles, regional pollutants (including accumulation mode aerosol particles), and trace gas variations associated with boundary layer dynamics. Each site also exhibited a factor associated specifically with that site: local industrial emissions in Hamilton (urban site), processed nucleation mode particles at Simcoe (polluted rural site), and transported
15
fine particles at Egbert (downwind from Toronto).
1 Introduction
Atmospheric aerosol particles play an important roles in climate and air quality issues. These particles are either emitted into or formed in the atmosphere and then undergo substantial modification due to coagulation and gas-to-particle conversion (nucleation
20
and condensation). There is a need to better understand both the origins of atmo-spheric particles and the processes that modify them.
Many receptor models have been developed for identifying sources of air pollutants and to estimate the source contributions. Among the tools that have been used for this are factor analysis, principal component analysis, and positive matrix factorization.
25
ACPD
6, 10493–10522, 2006 Aerosol size distribution source identification T. W. Chan and M. Mozurkewich Title Page Abstract Introduction Conclusions References Tables Figures J I J I Back Close Full Screen / EscPrinter-friendly Version Interactive Discussion 2003; Maenhaut et al., 2002; Manoli et al., 2002; Yu and Chang, 2002; Hien et al.,
2001; Song et al., 2001; Artaxo et al., 1999) and gas concentration (Guo et al., 2004a, b; Blanchard et al., 2002; Ho et al., 2001) measurements since their basic assump-tions would appear to be the most valid for these types of measurements. In some cases, such as in the studies by Swietlicki et al. (1996) and Paterson et al. (1999), the
5
composition data is divided into coarse and fine particle fractions. Chan et al. (2000) extended this approach somewhat by applying Target Transformation Factor Analysis to particle composition data obtained with a six stage high volume cascade impactor.
To obtain more insights into particle origins, there have been several attempts to in-clude some particle size information in these analyses. Both Ruuskanen et al. (2001)
10
and Vallius et al. (2003) applied principal component analysis to 24 h averaged data sets that included number concentrations for ultrafine and accumulation mode parti-cles, with the boundary set at 0.1 m. Ruuskanen et al. only included a few other variables, such as blackness and mass of PM2.5, and obtained factors that associ-ated these with either the ultrafine or accumulation mode particles. Vallius et al.
in-15
cluded elemental composition, absorption data, and gas phase NOx and SO2 concen-trations. Their results identified five different factors, including local traffic emissions, trans-boundary air pollutants, re-suspended soil dust, heavy oil combustion, and sea salt particles.
A few studies have applied factor analysis techniques to data sets that included
de-20
tailed size distribution data. W ˚ahlin et al. (2001) applied factor analysis to such a data set that also included measurements of CO and NOx. They identified three factors: one associated with long range transported secondary particles and the other two re-lated to vehicle emissions. Kim et al. (2004) applied both positive matrix factorization and Unmix to a volume distribution data set measured in Seattle. They obtained four
25
factors, identified as accumulation mode particles from wood burning, secondary ac-cumulation mode aerosol particles, and two factors related to vehicle emissions. Zhou et al. (2004) applied positive matrix factorization to size distribution measurements and then compared the results with measurements of trace gases (O3, NO, NOx, SO2, CO),
ACPD
6, 10493–10522, 2006 Aerosol size distribution source identification T. W. Chan and M. Mozurkewich Title Page Abstract Introduction Conclusions References Tables Figures J I J I Back Close Full Screen / EscPrinter-friendly Version Interactive Discussion particulate mass (PM2.5), sulfate, organic carbon, and elemental carbon. They
iden-tified five factors: secondary aerosol particles, diesel truck emissions, traffic aerosol, combustion (power station and biomass fires), and photochemically driven nucleation particles.
Most of these studies used either principal component analysis (PCA) (Miller et al.,
5
2002; Harrison et al., 1996; Thurston and Spengler, 1985) or positive matrix factoriza-tion (PMF) (Hopke, 2003; Paatero, 1997; Paatero and Tapper, 1994). The major di ffer-ence between the two techniques is that PCA does not have constraints on the values of either the component loadings or scores, but requires that the resulting components be orthogonal, while PMF requires component loadings and scores to be non-negative,
10
but has no orthogonality requirement. The lack of a non-negativity requirement in PCA has the potential of giving physically unreasonable results in the form of negative val-ues for quantities that must be non-negative. However, in practice this is not usually a problem since, after Varimax rotation, it is typical that for each component all scores (the amounts of the component present) that are not near zero have the same sign;
15
these can be chosen to be positive. Thus, in practice it is possible to implement an effective non-negativity constraint for absolute PCA scores. The same can not be said for loadings (the relative amounts of each measured species in the component); how-ever, it is not clear that a non-negativity constraint is always appropriate for loadings. For example, negative loadings might represent an anticorrelation between species.
20
For these reasons, we believe that the non-negativity constraint of PMF is not a large advantage unless physically reasonable results can not be obtained with PCA.
Both PCA and PMF are capable of identifying different sources and their compo-sition features without any prior knowledge about the sources. Huang et al. (1999) performed PMF and PCA on an aerosol composition data set and concluded that the
25
two techniques can provide indistinguishable results. They also found that, to obtain meaningful results, the inclusion of appropriate input data and appropriate usage of the method are more important than the specific method used.
ACPD
6, 10493–10522, 2006 Aerosol size distribution source identification T. W. Chan and M. Mozurkewich Title Page Abstract Introduction Conclusions References Tables Figures J I J I Back Close Full Screen / EscPrinter-friendly Version Interactive Discussion iterative method to fit the component loadings and scores to the measurements. This
makes PMF numerically more difficult to implement than PCA. Another advantage of PMF has been that it is designed to permit the weighting of data; however, as shown in the preceding paper (Chan and Mozurkewich, 2006), it is also possible to apply approximate weights in PCA. In the present application, we find that there is no difficulty
5
with negative scores in excess of noise. Negative loadings do occur, but these appear to represent physically meaningful anticorrelations in the data. Therefore, we prefer to take advantage of the relative simplicity of PCA.
In this paper, we apply principal component analysis to data sets from four field studies conducted in southern Ontario; these data sets include number size
distribu-10
tions, trace gas measurements, and meteorological data. The analysis is done in two steps. First we apply weighted absolute principal component analysis, as described in the preceding paper, to the measured aerosol size distribution measurements in order to reduce the data dimensionality. Each of the resulting components covers a limited range of particle sizes. In a sense, this resembles “binning” the data, but since
15
the analysis uses the data the determine the bins, virtually all the information in the original data set is retained. In the second step, we combine these components with trace gas and meteorological data in a more conventional principal component analy-sis. The components resulting from this analysis are useful in identifying the origins of the particulate matter.
20
2 Measurements
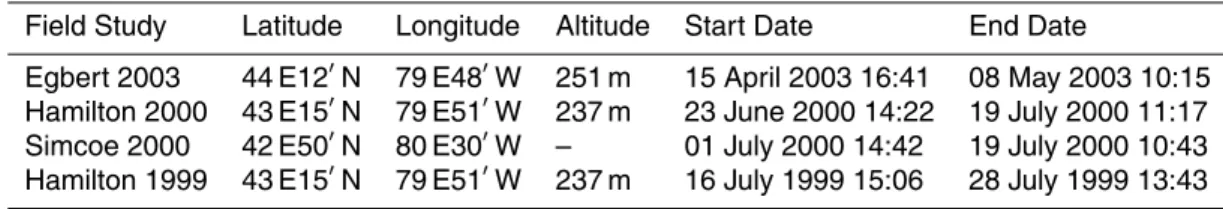
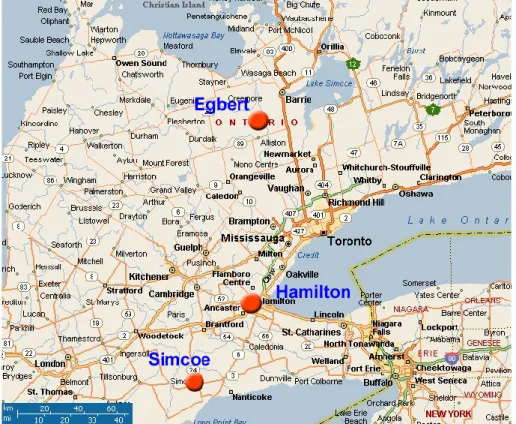
The data sets used in this paper were obtained from four field studies that were con-ducted in southern Ontario: Egbert 2003; Hamilton 2000; Simcoe 2000; and Hamilton 1999. The locations of these sampling sites are shown in Fig. 1 and the latitudes, longitudes, and altitudes of the sites are given in Table 1 along with the start and end
25
dates of the measurements. All size distribution measurements were measured with a DMA-CPC system over 5-min intervals with 16 size bins per decade resolution.
ACPD
6, 10493–10522, 2006 Aerosol size distribution source identification T. W. Chan and M. Mozurkewich Title Page Abstract Introduction Conclusions References Tables Figures J I J I Back Close Full Screen / EscPrinter-friendly Version Interactive Discussion bient particles were size selected with a TSI 3071 differential mobility analyser (DMA)
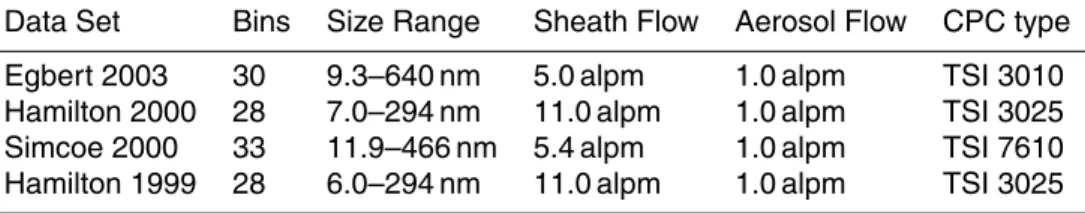
operating in a fast scan mode (Wang and Flagan, 1990). Particles exiting the DMA were counted by either a TSI 3010 or a TSI 3025 condensation particle counter (CPC). Additonal details about the DMA setup are given by Mozurkewich et al. (2004). Infor-mation on the total number of size bins, measured particle size range, DMA sheath
5
and aerosol flows, and CPC model type used in different field studies are summarized in Table 2.
The Egbert 2003 data was taken at the Meteorological Service of Canada’s (MSC) Centre for Atmospheric Research Experiments at Egbert; a rural site that is located about 80 km north of Toronto, Ontario. This site is surrounded by crop land, with no
10
major anthropogenic source nearby. Air that reaches this site from the south and south-east is expected to contain traffic pollutants, such as NOx. On the other hand, air that comes from the north generally contains less anthropogenic pollutants, except when it has passed over Sudbury; then SO2and SO2−4 levels may be high. Meteorological and trace gas measurements were provided by MSC.
15
The Hamilton 2000 and Hamilton 1999 data sets were taken at Kelly station, an On-tario Ministry of the Environment (OME) monitoring site located in downtown Hamilton, Ontario. For Hamilton 1999, ambient air was measured by sampling from a 10 cm di-ameter glass manifold through which air was pumped from about a meter above the rooftop at a rate of 1.0 m3min−1. For Hamilton 2000, the DMA-CPC system was set
20
inside a plastic box, which was located on the rooftop of the station. Ambient air was sampled directly from outside of the box via a 6 mm stainless steel tube of about 70 cm in length with a downward pointed elbow at the end to avoid rain. The air at the Kelly station site is strongly affected by local traffic and industrial emissions. Meteorological and trace gas measurements were provided by OME.
25
The Simcoe 2000 data were taken at a rural OME site just outside of the small town of Simcoe, located about 70 km southwest of Hamilton. Air at the Simcoe site is usually not strongly affected by local sources, but pollution levels are generally high due to trans-boundary transport from the United States. Occasionally the Simcoe site is
ACPD
6, 10493–10522, 2006 Aerosol size distribution source identification T. W. Chan and M. Mozurkewich Title Page Abstract Introduction Conclusions References Tables Figures J I J I Back Close Full Screen / EscPrinter-friendly Version Interactive Discussion impacted by emissions from a steel mill, petroleum refinery, and a coal-fired electricity
generation station located to the southeast of the site, near Nanticoke. Meteorological and trace gas measurements were provided by Rotek Environmental.
For each field data set, we used the method described in the preceding paper and applied absolute principal component analysis to the entire 5-minute size distribution
5
data sets for each study to obtain the rotated component loadings and their corre-sponding component scores; the shape of these rotated components are given in the preceding paper and their peak diameters are given in Table 3. The 5 min absolute component scores obtained from each field study data set were then converted to hourly averages and used as input data for the analyses reported here. This was done
10
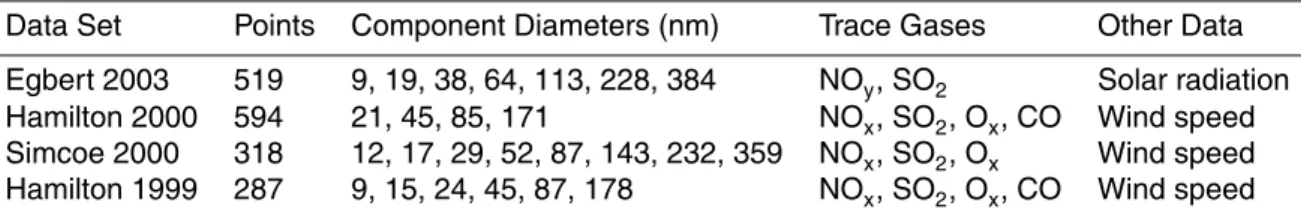
because the trace gas measurements were available as hourly averages. The aver-aging was done according to the measurement times for the trace gas measurements and meteorological data. The total number of hourly averaged points, the available gas measurements, and other meteorological data are summarized in Table 3.
3 Methodology
15
3.1 Assembly of the mixed data set
The first step of the analysis is to assemble a mixed data set containing the size dis-tributions, the gas measurements, and meteorological data. The size distribution data used here are the rotated aerosol component scores obtained as described in the preceding paper. These replace the 28 to 33 size bins with four to eight monomodal
20
components, depending on the complexity of the data set. We found that qualitatively similar results can be obtained using various number of aerosol components; the re-sults reported here included the maximum number of aerosol components (that is, all “mixed” components) in order to avoid discarding features that occur only occasionally in the data. The mixed data set also includes measurements of CO, NOx (NO+NO2),
25
SO2, Ox (NO2+O3), wind speed, and ground level solar radiation (when available). 10499
ACPD
6, 10493–10522, 2006 Aerosol size distribution source identification T. W. Chan and M. Mozurkewich Title Page Abstract Introduction Conclusions References Tables Figures J I J I Back Close Full Screen / EscPrinter-friendly Version Interactive Discussion NOx and Ox are used because the rapid photochemical interconversion between NO,
NO2, and O3 results in only two of these species being independent. For the Egbert 2003 data set, NOy (the sum of NOx, N2O5, HNO3, HONO, organic nitrates, and or-ganic peroxy nitrates) is used instead of NOx because the later information was not available.
5
3.2 Scaling the mixed data set
In the preceding paper, we emphasized the importance of weighting the data set prior to the principal component analysis; this is because some data are known to be more reliable than others and measurement uncertainty can contribute significantly to the variance. On the other hand, if the input data are weighted inappropriately, results
10
might be misleading because of over- or under-estimation of particular portions of the data. In the mixed data sets, the various measurements were obtained from indepen-dent systems. For the most part, instrument noise did not contribute significantly to the data variance. As a result, it may not be appropriate to assign measurement-based weights in the same manner as used for the size distribution data. When we attempted
15
to do this, we obtained unsatisfactory results. Therefore we decided to scale the data using the standard method such that all columns have unit variances; this causes all variables to contribute equally in the analysis. The scaling was done by dividing in-dividual columns in the mixed data set by the corresponding standard deviations. An optimal weighting scheme might lie somewhere between this extreme and the extreme
20
of purely measurement-based weighting; at present, such a scheme is not available. 3.3 Principal component analysis
Principal component analysis was applied to the scaled mixed data set. Varimax rota-tion was applied to the retained factor loadings and these were fit to the measurements to generate a set of factor scores. Deciding the number of factors to retain for each data
25
ACPD
6, 10493–10522, 2006 Aerosol size distribution source identification T. W. Chan and M. Mozurkewich Title Page Abstract Introduction Conclusions References Tables Figures J I J I Back Close Full Screen / EscPrinter-friendly Version Interactive Discussion while retaining too many factors splits sources among factors in a physically
unreason-able manner. We found that the results obtained from the modified scree plots (defined in the preceding paper) were difficult to interpret since there were only slight breaks in the slopes; however, these did provide a good starting point for deciding the number of factors to retain. In each case, we carried through the analysis with the number of
re-5
tained factors obtained from the scree plot and also with both one more and one fewer factor retained. The results were examined to determine if they provided a reasonable physical interpretation. In each case, we found that one set of results was much more reasonable than the others. This sometimes resulted in keeping either one more factor or one less than implied by the modified scree plot.
10
4 Results and discussion
4.1 General description of data results
Figure 2 shows the factor loadings for the four field studies. The aerosol components, obtained from applying PCA to the size distributions, are labeled by their peak diame-ters. Each of the factors is assigned a name based on the loadings associated with that
15
factor and the time series of the scores; these are described in the following sections. 4.2 Photochemically driven nucleation
In all the data sets except Hamilton 2000, we observe a factor, shown in Figs. 2a, c, and d, that has high positive loadings on nucleation mode particles and small negative loadings on accumulation mode particles. This factor shows almost no correlations
20
with other gas phase measurements. In the Egbert 2003 data set (Fig. 2a), this factor also shows a strong correlation with ground level solar radiation. For the other data sets, we do not have solar radiation measurements; but Fig. 3 shows the variations of the absolute scores for this factor along with the degree of cloud coverage for Hamilton
ACPD
6, 10493–10522, 2006 Aerosol size distribution source identification T. W. Chan and M. Mozurkewich Title Page Abstract Introduction Conclusions References Tables Figures J I J I Back Close Full Screen / EscPrinter-friendly Version Interactive Discussion 1999. The factor scores always peak during the day with the increase being
espe-cially strong on sunny and mostly clear days; this indicates that the production of the nucleation mode particles is photochemically driven. Occasional double peaks were observed, such as on 19, 20, 21, and 26 July. The interruption of the production of nucleation mode particles appears to be caused by on and off cloud coverage. Based
5
on these observations, we identify this as a photochemical process factor, representing the nucleation of secondary aerosol particles in the atmosphere.
The photochemical process factor does not appear in the Hamilton 2000 data set (Fig. 2b). The weather in Hamilton was unusually cloudy and rainy during that study; as a result, significant concentrations of nucleation mode particles were not observed.
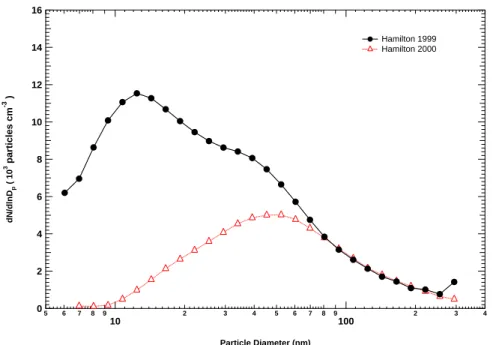
10
The average size distributions measured in Hamilton in 1999 and 2000 are shown in Fig. 4; the average size distributions for particles larger than 80 nm diameter are virtually identical, but the nucleation mode was absent in 2000.
Although the nucleation is likely driven by the oxidation of SO2(Birmili et al., 2000), this species does not appear as part of this factor in Hamilton. This may be partly due
15
to the fact that the variations in observed SO2 in Hamilton are dominated by another strong local source (the local anthropogenic emission factor, see Sect. 4.5) and partly due to the fact that variations in solar radiation can drive large variations in the nucle-ation rate even if there is no change in SO2. The photochemical process factors in Fig. 2 all show small negative loadings on the accumulation mode particles. This is
20
not unexpected; as pointed out by Kulmala et al. (2004), the presence of pre-existing particles slows down the particle nucleation rate due to coagulational scavenging of small nuclei and by lowering the non-volatile vapor concentration.
The photochemical nucleation particles factor found by Zhou et al. (2004) showed similar features as ours: it consisted of mainly 3 nm particles, peaked at mid to late
25
afternoon, and showed no correlations with any trace gas measurements. Our obser-vations of the correlation between the photochemical process component and ground level solar radiation is consistent with the findings of Birmili and Wiedensohler (2000), Boy and Kulmala (2002), Shi et al. (2001), and Mozurkewich et al. (2004), all of whom
ACPD
6, 10493–10522, 2006 Aerosol size distribution source identification T. W. Chan and M. Mozurkewich Title Page Abstract Introduction Conclusions References Tables Figures J I J I Back Close Full Screen / EscPrinter-friendly Version Interactive Discussion observed an association of nucleation and UV radiation.
4.3 Regional pollutants
As shown in Fig. 2, the data sets have a common factor that has high positive loadings on accumulation mode particles, CO, and NOx together with a small negative loading on wind speed. For the measurements taken at the Hamilton site, there is also a
5
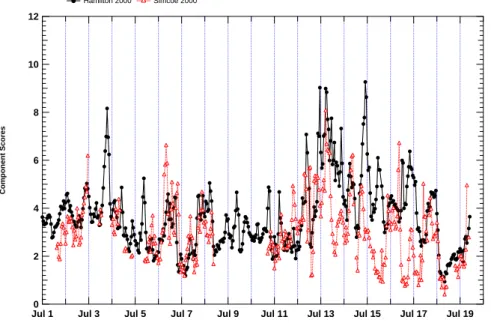
positive loading on Ox. As shown in Fig. 5, the scores for this factor are very similar at the Hamilton and Simcoe sites in 2000 and are much less variable than those of the local emission (see Sect. 4.4) or photochemical process factors. Because of this, we identify this factor as regional pollution.
Figure 2c shows a large positive loading for SO2 at the Simcoe site; this is not
10
observed at the other sites. The result at Simcoe is more in line with what might be expected. The absence of SO2from the regional pollution factors at the Hamilton and Egbert sites is a consequence of high SO2levels associated with strong local sources (see Sects. 4.5 and 4.6) and the scaling used. The scaling causes each variable to have the same variance. At Hamilton and Egbert, the variation in regional SO2is small
15
compared to variation due to the local emissions; as a result, the scaling suppresses the SO2“signal” in the regional pollution component. At Simcoe, there is some variation in SO2due to local sources to the southeast of the site. However, these were sampled so infrequently during this study that they contributed minimally to the overall variance. As a result, the variation in SO2associated with the regional pollution is more readily
20
observed.
In Fig. 5, significant deviations between the regional pollution scores for Hamilton and Simcoe occur during the period from mid-day on 13 July to early morning on 17. Dur-ing this period, the two sets of scores show overall decreasDur-ing trends, but the scores were generally higher in Hamilton than in Simcoe. These deviations appear to be
as-25
sociated with the difference in local wind direction at the two sites. For instance, from 14 July 20:00 to 16 July 00:00, the local wind at the Simcoe site was primarily from NW, whereas the local wind at the Hamilton site was from N to NE; a similar situation
ACPD
6, 10493–10522, 2006 Aerosol size distribution source identification T. W. Chan and M. Mozurkewich Title Page Abstract Introduction Conclusions References Tables Figures J I J I Back Close Full Screen / EscPrinter-friendly Version Interactive Discussion was also observed from 16 July 12:00 to 16 July 21:00. At other times, the local wind
directions at the two sites were very consistent.
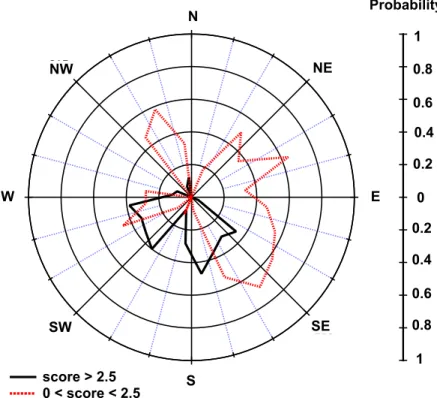
In the Egbert 2003 data, we observed a different pattern; at times, the regional pollution component scores were very low. A histogram of the scores is bimodal; the medium values in the two modes are 0.7 and 3.5 with a minimum at an absolute score
5
value of 2.5. The conditional probability function, CPF, was used to investigate the wind direction dependence of these two groups. CPF estimates the probability that a given source contribution from a given wind direction will exceed a predetermined threshold criterion (Kim et al., 2004; Kim and Hopke, 2004; Zhou et al., 2004; Ashbaugh et al., 1985). The CPF is defined as
10
CPF= f ×m∆θ
n∆θ (1)
where m∆θis the number of occurrences in the direction sector θ to θ+∆θ that exceed a certain predetermined threshold and n∆θis the total number of occurrences within the sector. In our case,∆θ is defined as 15 degree. The weighting factor, f , is incorporated to avoid misleading results from sectors with only a few data points; if n∆θ k 10, f=1
15
and if n∆θ<10,
f = pn∆θ.p10. (2)
Figure 6 shows the conditional probability functions for scores below and above 2.5. It is clear that high scores for this component are associated with winds from the SE through SW (Toronto and the United States). Low scores are associated with winds
20
from the NW to NE; this is consistent with the fact that those are forested areas with no major anthropogenic sources.
4.4 Boundary layer dynamics
All data sets except Egbert 2003 (Figs. 2b, c, and d) have a factor that shows high positive loadings on Oxand wind speed, a small negative loading on NOx, and a small
ACPD
6, 10493–10522, 2006 Aerosol size distribution source identification T. W. Chan and M. Mozurkewich Title Page Abstract Introduction Conclusions References Tables Figures J I J I Back Close Full Screen / EscPrinter-friendly Version Interactive Discussion positive loading on the accumulation mode particles. The time series of the scores
show a strong diurnal variation with maxima near noon and minima in the early morn-ings. This is consistent with the build up of NOx and the depletion of Ox under the nocturnal inversion layer. During the morning, as the boundary layer grows, air within the inversion layer mixes with the air mass above the inversion layer, which contains
5
higher Ox and lower NOx. The positive correlation of wind speed with Ox is due to the fact that the ground level wind speed is higher during the daytime. These results are consistent with the findings from Swietlicki et al. (1996), who observed a strong anti-correlation between NO2and O3.
4.5 Local anthropogenic emission at Hamilton
10
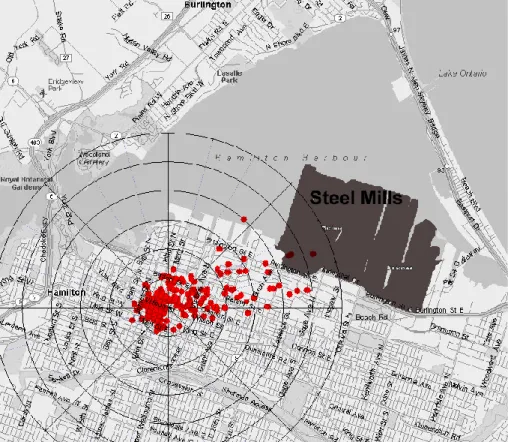
The Hamilton 2000 (Fig. 2b) and Hamilton 1999 (Fig. 2d) mixed data sets have a com-mon factor that does not appear in the other data sets. This factor, which we identify as local anthropogenic emissions, shows high loadings on the Aitken mode particles and SO2, small positive loadings on NOx and wind speed, and a small negative loading on Ox. The wind direction dependence of the component scores is shown in Fig. 7;
15
clearly, high values of the scores are associated with wind directions between 45 E and 90 E. In Fig. 7, the plot is superimposed on a street map of the city of Hamilton with the center of the plot at the location of the measurement site. The result strongly implies that this component is from the two steel mills in Hamilton. The Aitken particles and SO2 are probably the by-products of the coke making process (Environment Canada,
20
2001).
4.6 Processed nucleation mode particles at Simcoe
The Simcoe 2003 data (Fig. 2c) contain a factor that has a high positive loading on Aitken particles and small negative loadings on the nucleation mode and accumulation mode particles. Similar to the photochemical process factor, this factor has no
correla-25
tion with any trace gas measurements or meteorological data. Figure 8 shows the time 10505
ACPD
6, 10493–10522, 2006 Aerosol size distribution source identification T. W. Chan and M. Mozurkewich Title Page Abstract Introduction Conclusions References Tables Figures J I J I Back Close Full Screen / EscPrinter-friendly Version Interactive Discussion series of the scores for this factor and the photochemical process factor for this site; a
lag between the two can be clearly seen after most of the nucleation events (5, 6, 7, 11, 12, and 17 July). Therefore, we identify this factor as processed nucleation mode particles; it represents the growth of the freshly nucleated particles into the Aitken par-ticle size range. The negative loading on the nucleation mode parpar-ticles represents the
5
fact that the concentration of those particles decrease as they grow into to Aitken mode size range. The negative loadings on the accumulation mode particles probably occurs for the same reasons as in the photochemical process factor.
4.7 Transported fine particles at Egbert
The Egbert 2003 data (Fig. 2a) show a factor that has positive loadings on SO2 and
10
Aitken particles and small negative loadings on the accumulation mode particles and solar radiation; this factor is similar to the local anthropogenic emission factor that was identified at the Hamilton site, except that the particle sizes in this case are slightly larger. The conditional probability functions show that the major source for this factor is the Toronto area with a lesser contribution from the west (possibly from the area of
15
Detroit in the United States). There is almost no contribution from the much cleaner areas to the north and east. Based on these observations, we identify this factor as transported fine particles. The most likely source is vehicle emissions, although there may also be some contribution from industrial emissions. This factor has a small neg-ative loading on solar radiation; this is due to a steady increase in the scores during
20
the daytime and a gradual decrease at night. It is not clear if this is associated with photochemistry or with boundary layer and transport dynamics.
5 Conclusions
Absolute principal component analysis was used to identify possible sources and ori-gins of the measured ambient particulate matter from four different size distribution
ACPD
6, 10493–10522, 2006 Aerosol size distribution source identification T. W. Chan and M. Mozurkewich Title Page Abstract Introduction Conclusions References Tables Figures J I J I Back Close Full Screen / EscPrinter-friendly Version Interactive Discussion data sets measured at various locations in southern Ontario. The consistent results
among different field measurements show that when combining particle number con-centrations with different trace gas measurements and meteorological data, absolute principal component analysis can be useful in providing physical meaningful factors for interpretation.
5
Among the data sets, we identified three common factors that were observed at all the sites. The photochemical nucleation factor represents the nucleation of the secondary aerosol particles due to the presence of solar radiation and anthropogenic emissions. The ubiquity of this factor, even in areas with high particle loadings, is somewhat surprising. The atmospheric regional pollution factor consists of regional
10
pollutants that have widespread sources (accumulation mode particles, NOx, and CO); this factor is distinctly lower at the Egbert site when the air flow is from relatively clean areas to the north and east. SO2 was also present in this factor at Simcoe; its con-tribution to this factor at Hamilton and Egbert appears to have been masked by the large local variability in SO2at those sites. The boundary layer dynamics factor
repre-15
sents variations of NOxand Oxassociated with formation and break up of the nocturnal inversion layer.
In addition, there were three factors that were each unique to one of the three sites. The local anthropogenic emission factor identified at Hamilton represents the Aitken particles and SO2emitted from two local steel mills. At Simcoe, we observed a factor
20
which we refer to as the processed nucleation mode particles; this results from the growth of particles following nucleation events. The Egbert site was impacted by a fac-tor that consists of Aitken particles and SO2that is likely to be mostly vehicle emissions transported from the Toronto area and the United States.
In summary, this study shows that principal component analysis can be effectively
25
applied to data sets including size distribution data to provide useful information on the sources and origins of measured particulate matter. Some of the factors provided by the analysis are consistently observed at the three different sampling sites while others are unique to each site.
ACPD
6, 10493–10522, 2006 Aerosol size distribution source identification T. W. Chan and M. Mozurkewich Title Page Abstract Introduction Conclusions References Tables Figures J I J I Back Close Full Screen / EscPrinter-friendly Version Interactive Discussion
Acknowledgements. We thank R. Leaitch and J. O’Brien of the Meteorological Service of
Canada for use of the solar radiation and meteorological data from the Center for Atmospheric Research Experiments (CARE) Egbert monitoring site. Funding for this research was provided by the Natural Science and Engineering Research Council of Canada and by the Canadian Foundation for Climate and Atmospheric Sciences.
5
References
Artaxo, P., Oyola, P., and Martinez, R.: Aerosol composition and source apportionment in Santiago de Chile, Nucl. Instrum. Methods Phys. Res., Sect. B, 150, 409–416, 1999. Ashbaugh, L. L., Malm, W. C., and Sadeh, W. Z.: A residence time probability analysis of sulfur
concentrations at Grand Canyon National Park, Atmos. Environ., 19, 1263–1270, 1985.
10
Birmili, W. and Wiedensohler, A.: New particle formation in the continental boundary layer: meteorological and gas phase parameter influence, Geophys. Res. Lett., 27, 3325–3328, 2000.
Birmili, W., Wiedensohler, A., Plass-Dulmer, C., and Berresheim, H.: Evolution of newly formed aerosol particles in the continental boundary layer: a case study including OH and H2SO4
15
measurements, Geophys. Res. Lett., 27, 2205–2208, 2000.
Blanchard, P., Froude, F. A., Martin, J. B., Dryfhout-Clark, H., and Woods, J. T.: Four years of continuous total gaseous mercury (TGM) measurements at sites in Ontario, Canada, Atmos. Environ., 36, 3735–3743, 2002.
Boy, M. and Kulmala, M.: Nucleation events in the continental boundary layer: influence of
20
physical and meterological parameters, Atmos. Chem. Phys., 2, 1–16, 2002.
Chan, Y. C., Vowles, P. D., McTainsh, G. H., Simpson, R. W., Cohen, D. D., Bailey, G. M., and McOrist, G. D.: Characterisation and source identification of PM10aerosol samples collected with a high volume cascade impactor in Brisbane (Australia), Sci. Total Environ., 262, 5–19, 2000.
25
Chan, T. W. and Mozurkewich, M.: Simplified representation of atmospheric aerosol size dis-tributions using absolute principal component analysis, Atmos. Chem. Phys. Discuss., 6, 10463–10492, 2006.
ACPD
6, 10493–10522, 2006 Aerosol size distribution source identification T. W. Chan and M. Mozurkewich Title Page Abstract Introduction Conclusions References Tables Figures J I J I Back Close Full Screen / EscPrinter-friendly Version Interactive Discussion
code of practice, 1st edition, EPS 1/MM/7, 2001. (http://www.ec.gc.ca/nopp/docs/cp/1mm7/
en/toc.cfm)
Guo, H., Wang, T., and Louie, P. K. K.: Source apportionment of ambient non-methane hy-drocarbons in Hong Kong: application of a principal component analysis/absolute principal component scores (PCA/APCS) receptor model, Environ. Pollut., 129, 489–498, 2004a.
5
Guo, H., Wang, T., Simpson, I. J., Blake, D. R., Yu, X. M., Kwok, Y. H., and Li. Y. S.: Source contributions to ambient VOCs and CO at a rural site in eastern China, Atmos. Environ., 38, 4551–4560, 2004b.
Harrison, R. M., Smith, D. J. T., and Luhana, L.: Source apportionment of atmospheric poly-cyclic aromatic hydrocarbons collected from an urban location in Birmingham, UK, Environ.
10
Sci. Technol., 30, 825–832, 1996.
Hien, P. D., Binh, N. T.,Truong, Y., Ngo, N. T., and Sieu, L. N.: Comparative receptor modeling study of TSP, PM2and PM2−10in Ho Chi Minh City, Atmos. Environ., 35, 2669–2678, 2001. Ho, K. F., Lee, S. C., and Chiu, G. M. Y.: Characterization of selected volatile organic
com-pounds, polycyclic aromatic hydrocarbons and carbonyl compounds at a roadside monitoring
15
station, Atmos. Environ., 36, 57–65, 2001.
Hopke, P. K.: Recent developments in receptor modeling, J. Chemom., 17, 255–265, 2003. Huang, S., Rahn, K. A., and Arimoto, R.: Testing and optimizing two factor-analysis techniques
on aerosol at Narragansett, Rhode Island, Atmos. Environ., 33, 2169–2185, 1999.
Kim, E. and Hopke, P. K.: Comparison between conditional probability function and
nonpara-20
metric regression for fine particle source directions, Atmos. Environ., 38, 4667–4673, 2004. Kim, E., Hopke, P. K., Larson, T. V., and Covert, D. S.: Analysis of ambient particle size
distri-butions using Unmix and positive matrix factorization, Environ. Sci. Technol., 38, 202–209, 2004.
Kulmala, M., Vehkam ¨aki, H., Pet ¨aj ¨a, T., Dal Maso, M., Lauri, A., Kerminen, V. M., Birmili, W.,
25
and McMurry, P. H.: Formation and growth rates of ultrafine atmospheric particles: a review of observations, J. Aerosol Sci., 35, 143–176, 2004.
Maenhaut, W., Fern ´andez-Jim ´enez M. T., Rajta, I., and Artaxo, P.: Two-year study of atmo-spheric aerosols in Alta Floresta, Brazil: multielemental composition and source apportion-ment, Nucl. Instrum. Methods Phys. Res., Sect. B, 189, 243–248, 2002.
30
Manoli, E., Voutsa, D., and Samara, C.: Chemical characterization and source identifica-tion/apportionment of fine and coarse air particles in Thessaloniki, Greece, Atmos. Environ., 36, 949–961, 2002.
ACPD
6, 10493–10522, 2006 Aerosol size distribution source identification T. W. Chan and M. Mozurkewich Title Page Abstract Introduction Conclusions References Tables Figures J I J I Back Close Full Screen / EscPrinter-friendly Version Interactive Discussion
Miller, S. L., Anderson, M. J., Daly, E. P., and Milford, J. B.: Source apportionment of exposures to volatile organic compounds. I. Evaluation of receptor models using simulated exposure data, Atmos. Environ., 36, 3629–3641, 2002.
Mozurkewich, M., Chan, T. W., Aklilu, Y. A., and Verheggen, B.: Aerosol particle size distribu-tions in the lower Fraser Valley: evidence for particle nucleation and growth, Atmos. Chem.
5
Phys., 4, 1047–1062, 2004.
Paatero, P.: Least squares formation of robust non-negative factor analysis, Chemom. Intell. Lab. Syst., 37, 23–35, 1997.
Paatero, P. and Tapper, U.: Positive matrix factorization: a non-negative factor model with optimal utilization of error estimates of data values, Environmetrics, 5, 111–126, 1994.
10
Paterson, K. G., Sagady, J. L., Hooper, D. L., Bertman, S. B., Carroll, M. A., and Shepson, P. B.: Analysis of air quality data using positive matrix factorization, Environ. Sci. Technol., 33, 635–641, 1999.
Qin, Y. and Oduyemi, K.: Atmospheric aerosol source identification and estimates of source contributions to air pollution in Dundee, UK, Atmos. Environ., 37, 1799–1809, 2003.
15
Ruuskanen, J., Tuch, Th., Ten Brink, H., Peters, A., Khlystov, A., Mirme, A., Kos, G. P. A., Brunekreef, B., Wichmann, H. E., Buzorius, G., Vallius, M., Kreyling, W. G., and Pekkanen, J.: Concentration of ultrafine, fine and PM2.5particles in three European cities, Atmos. Environ.,
35, 3729–3738, 2001.
Shi, J. P., Evan, D. E., Khan, A. A., and Harrison, R. M.: Sources and concentration of
nanopar-20
ticles (<10 nm diameter) in the urban atmosphere, Atmos. Environ., 35, 1193–1202, 2001. Song, X. H., Polissar, A. V., and Hopke, P. K.: Sources of fine particle composition in the
northeastern U.S., Atmos. Environ., 35, 5277–5286, 2001.
Swietlicki, E., Puri, S., Hansson, H. C., and Edner, H.: Urban air pollution source apportionment using a combination of aerosol and gas monitoring techniques, Atmos. Environ., 30, 2795–
25
2809, 1996.
Thurston, G. D. and Spengler, J. D.: A quantitative assessment of source contributions to in-halable particulate matter pollution in metropolitan Boston, Atmos. Environ., 19, 9–25, 1985. Vallius, M., Lanki, T., Tiittanen, P., Koistinen, K., Ruuskanen, J., and Pekkanen, J.: Source ap-portionment of urban ambient PM2.5in two successive measurement campaigns in Helsinki,
30
Finland, Atmos. Environ., 37, 615–623, 2003.
W ˚ahlin, P., Palmgren, F., and Van Dingenen, R.: Experimental studies of ultrafine particles in streets and the relationship to traffic, Atmos. Environ., 35 (S1), S63–S69, 2001.
ACPD
6, 10493–10522, 2006 Aerosol size distribution source identification T. W. Chan and M. Mozurkewich Title Page Abstract Introduction Conclusions References Tables Figures J I J I Back Close Full Screen / EscPrinter-friendly Version Interactive Discussion
Wang, S. C. and Flagan, R. C.: Scanning Electrical Mobility Spectrometer, Aerosol Sci. Tech-nol., 13, 230–240, 1990.
Yu, T. Y. and Chang, L. F. W.: Delineation of air-quality basins utilizing multivariate statistical methods in Taiwan, Atmos. Environ., 35, 3155–3166, 2002.
Zhou, L., Kim, E., Hopke, P. K., Stanier, C. O., and Pandis, S.: Advanced factor analysis on
5
Pittsburgh particle size-distribution data, Aerosol Sci. Technol., 38(S1), 118–132, 2004.
ACPD
6, 10493–10522, 2006 Aerosol size distribution source identification T. W. Chan and M. Mozurkewich Title Page Abstract Introduction Conclusions References Tables Figures J I J I Back Close Full Screen / EscPrinter-friendly Version Interactive Discussion Table 1. Locations and durations of the field studies.
Field Study Latitude Longitude Altitude Start Date End Date
Egbert 2003 44 E120N 79 E480W 251 m 15 April 2003 16:41 08 May 2003 10:15 Hamilton 2000 43 E150N 79 E510W 237 m 23 June 2000 14:22 19 July 2000 11:17 Simcoe 2000 42 E500N 80 E300W – 01 July 2000 14:42 19 July 2000 10:43 Hamilton 1999 43 E150N 79 E510W 237 m 16 July 1999 15:06 28 July 1999 13:43
ACPD
6, 10493–10522, 2006 Aerosol size distribution source identification T. W. Chan and M. Mozurkewich Title Page Abstract Introduction Conclusions References Tables Figures J I J I Back Close Full Screen / EscPrinter-friendly Version Interactive Discussion Table 2. Specifics of the DMA-CPC systems used in the field studies. Flows are in actual liters
per minute, i.e. volumetric flow at ambient temperature and pressure.
Data Set Bins Size Range Sheath Flow Aerosol Flow CPC type Egbert 2003 30 9.3–640 nm 5.0 alpm 1.0 alpm TSI 3010 Hamilton 2000 28 7.0–294 nm 11.0 alpm 1.0 alpm TSI 3025 Simcoe 2000 33 11.9–466 nm 5.4 alpm 1.0 alpm TSI 7610 Hamilton 1999 28 6.0–294 nm 11.0 alpm 1.0 alpm TSI 3025
ACPD
6, 10493–10522, 2006 Aerosol size distribution source identification T. W. Chan and M. Mozurkewich Title Page Abstract Introduction Conclusions References Tables Figures J I J I Back Close Full Screen / EscPrinter-friendly Version Interactive Discussion Table 3. Input data used in the mixed data sets. The number of “points” is the number of one
hour averages used in each data set. The component diameters are the maxima of the aerosol component loadings.
Data Set Points Component Diameters (nm) Trace Gases Other Data Egbert 2003 519 9, 19, 38, 64, 113, 228, 384 NOy, SO2 Solar radiation Hamilton 2000 594 21, 45, 85, 171 NOx, SO2, Ox, CO Wind speed Simcoe 2000 318 12, 17, 29, 52, 87, 143, 232, 359 NOx, SO2, Ox Wind speed Hamilton 1999 287 9, 15, 24, 45, 87, 178 NOx, SO2, Ox, CO Wind speed
ACPD
6, 10493–10522, 2006 Aerosol size distribution source identification T. W. Chan and M. Mozurkewich Title Page Abstract Introduction Conclusions References Tables Figures J I J I Back Close Full Screen / EscPrinter-friendly Version Interactive Discussion Fig. 1. Sampling sites for the Egbert 2003, Hamilton 2000, Simcoe 2000, and Hamilton 1999
field studies (map source:http://mappoint.msn.com).
ACPD
6, 10493–10522, 2006 Aerosol size distribution source identification T. W. Chan and M. Mozurkewich Title Page Abstract Introduction Conclusions References Tables Figures J I J I Back Close Full Screen / EscPrinter-friendly Version Interactive Discussion 0.8 0.6 0.4 0.2 0.0 -0.2 Component Loadings 9 nm 19 nm 38 nm 64 nm 113 nm 228 nm 384 nm solar rad. SO2 NOy a) Egbert 2003 0.8 0.6 0.4 0.2 0.0 -0.2 -0.4 Component Loadings 21 nm 45 nm 85 nm 171 nm CO NOx SO2 wind spd Ox b) Hamilton 2000 0.8 0.6 0.4 0.2 0.0 -0.2 -0.4 Component Loadings 12 nm 17 nm 29 nm 52 nm 87 nm 143 nm 232 nm 359 nm NOx SO2 wind spd Ox c) Simcoe 2000 0.8 0.6 0.4 0.2 0.0 -0.2 Component Loadings 9 nm 15 nm 24 nm 45 nm 87 nm 178 nm CO NOx SO2 wind spd Ox d) Hamilton 1999
Fig. 2. The important factors identified for the different field studies: photochemical nucleation
(black, striped); regional pollution (blue, horizontal bars); boundary layer dynamics (solid yel-low); site specific (red, cross-hatched).(a) Egbert 2003, site specific source is transported fine
particles. (b) Hamilton 2000, site specific source is local emission. (c) Simcoe 2000, site
ACPD
6, 10493–10522, 2006 Aerosol size distribution source identification T. W. Chan and M. Mozurkewich Title Page Abstract Introduction Conclusions References Tables Figures J I J I Back Close Full Screen / EscPrinter-friendly Version Interactive Discussion
EGU
Figure 3. Variations of the photochemical process factor scores obtained from the Hamilton 1999 field study. The shaded areas represent different degrees of cloud coverage, obtained from Environment Canada. These hourly averaged data represent the fractional coverage of the sky by clouds, in tenths. There are four categories: clear (0 tenths), mainly clear (1-4 tenths), mostly cloudy (5-9 tenths), and cloudy (10 tenths). Heavy rain was observed during the afternoon of July 19.
Fig. 3. Variations of the photochemical process factor scores obtained from the Hamilton 1999
field study. The shaded areas represent different degrees of cloud coverage, obtained from En-vironment Canada. These hourly averaged data represent the fractional coverage of the sky by clouds, in tenths. There are four categories: clear (0 tenths), mainly clear (1–4 tenths), mostly cloudy (5–9 tenths), and cloudy (10 tenths). Heavy rain was observed during the afternoon of 19 July.
ACPD
6, 10493–10522, 2006 Aerosol size distribution source identification T. W. Chan and M. Mozurkewich Title Page Abstract Introduction Conclusions References Tables Figures J I J I Back Close Full Screen / EscPrinter-friendly Version Interactive Discussion 16 14 12 10 8 6 4 2 0 dN/dlnD p ( 10 3 particles cm -3 ) 5 6 7 8 9 10 2 3 4 5 6 7 8 9 100 2 3 4 Particle Diameter (nm) Hamilton 1999 Hamilton 2000
ACPD
6, 10493–10522, 2006 Aerosol size distribution source identification T. W. Chan and M. Mozurkewich Title Page Abstract Introduction Conclusions References Tables Figures J I J I Back Close Full Screen / EscPrinter-friendly Version Interactive Discussion 12 10 8 6 4 2 0 Component Scores
Jul 1 Jul 3 Jul 5 Jul 7 Jul 9 Jul 11 Jul 13 Jul 15 Jul 17 Jul 19
Hamilton 2000 Simcoe 2000
Fig. 5. Variation of the regional pollution factor scores at the Hamilton and Simcoe sites during
field study in 2000. The figure shows only the 18 days when measurements were available at both sites.
ACPD
6, 10493–10522, 2006 Aerosol size distribution source identification T. W. Chan and M. Mozurkewich Title Page Abstract Introduction Conclusions References Tables Figures J I J I Back Close Full Screen / EscPrinter-friendly Version Interactive Discussion 0 0.2 0.4 0.6 0.8 1 0.2 0.4 0.6 0.8 1 0 45 90 135 180 225 270 315 score > 2.5 0 < score < 2.5 NE S NW SW N E SE W Probability 1 1 0.8 0.8 0.6 0.4 0.2 0 0.2 0.4 0.6
Fig. 6. Conditional probability function plots for the atmospheric regional pollutants at Egbert.
The red dotted curve indicates wind directions for which this factor makes a minor contribu-tion, while the black solid curve indicates wind directions for which this factor makes a major contribution.
ACPD
6, 10493–10522, 2006 Aerosol size distribution source identification T. W. Chan and M. Mozurkewich Title Page Abstract Introduction Conclusions References Tables Figures J I J I Back Close Full Screen / EscPrinter-friendly Version Interactive Discussion Fig. 7. Polar plot for the local anthropogenic emission factor scores superimposed on a street
map of the city Hamilton (map source:http://mappoint.msn.com). Each radial increment repre-sents the relative magnitude of the absolute factor scores. The measuring site is represented by the center of the polar plot. The dark grey area indicates the two large steel mills in Hamilton.
ACPD
6, 10493–10522, 2006 Aerosol size distribution source identification T. W. Chan and M. Mozurkewich Title Page Abstract Introduction Conclusions References Tables Figures J I J I Back Close Full Screen / EscPrinter-friendly Version Interactive Discussion 12 10 8 6 4 2 0 -2 Component Scores
Jul 1 Jul 3 Jul 5 Jul 7 Jul 9 Jul 11 Jul 13 Jul 15 Jul 17 Jul 19
photochemical process component processed nucleation mode particles component
Fig. 8. Time series of the scores for the photochemical process factor (red dotted curve) and