HAL Id: hal-00304159
https://hal.archives-ouvertes.fr/hal-00304159
Submitted on 16 May 2008HAL is a multi-disciplinary open access
archive for the deposit and dissemination of sci-entific research documents, whether they are pub-lished or not. The documents may come from teaching and research institutions in France or abroad, or from public or private research centers.
L’archive ouverte pluridisciplinaire HAL, est destinée au dépôt et à la diffusion de documents scientifiques de niveau recherche, publiés ou non, émanant des établissements d’enseignement et de recherche français ou étrangers, des laboratoires publics ou privés.
Effect of explicit urban land surface representation on
the simulation of the 26 July 2005 heavy rain event over
Mumbai, India
M. Lei, D. Niyogi, C. Kishtawal, R. A. Pielke, A. Beltrán-Przekurat, T. E.
Nobis, S. S. Vaidya
To cite this version:
M. Lei, D. Niyogi, C. Kishtawal, R. A. Pielke, A. Beltrán-Przekurat, et al.. Effect of explicit urban land surface representation on the simulation of the 26 July 2005 heavy rain event over Mumbai, India. Atmospheric Chemistry and Physics Discussions, European Geosciences Union, 2008, 8 (3), pp.8773-8816. �hal-00304159�
ACPD
8, 8773–8816, 2008
Mumbai heavy rain
M. Lei et al. Title Page Abstract Introduction Conclusions References Tables Figures ◭ ◮ ◭ ◮ Back Close
Full Screen / Esc
Printer-friendly Version Interactive Discussion
Atmos. Chem. Phys. Discuss., 8, 8773–8816, 2008 www.atmos-chem-phys-discuss.net/8/8773/2008/ © Author(s) 2008. This work is distributed under the Creative Commons Attribution 3.0 License.
Atmospheric Chemistry and Physics Discussions
Effect of explicit urban land surface
representation on the simulation of the 26
July 2005 heavy rain event over Mumbai,
India
M. Lei1, D. Niyogi1, C. Kishtawal2, R. A. Pielke3, A. Beltr ´an-Przekurat3, T. E. Nobis3, and S. S. Vaidya4
1
Purdue University, Department of Earth and Atmospheric Sciences and Department of Agronomy, West Lafayette, IN 47906, USA
2
SAC/ISRO, Ahmedabad 380015, India
3
University of Colorado at Boulder, CIRES, Boulder, CO 80309, USA
4
Indian Institute of Tropical Meteorology, Homi Bhabha Road, Pune 411008, India Received: 3 January 2008 – Accepted: 7 April 2008 – Published: 16 May 2008 Correspondence to: D. Niyogi ([email protected])
ACPD
8, 8773–8816, 2008
Mumbai heavy rain
M. Lei et al. Title Page Abstract Introduction Conclusions References Tables Figures ◭ ◮ ◭ ◮ Back Close
Full Screen / Esc
Printer-friendly Version Interactive Discussion Abstract
We investigate whether explicit representation of the urban land surface improves the simulation of the record-breaking 24-h heavy rain event that occurred over Mumbai, India on 26 July 2005 as the event has been poorly simulated by operational weather forecasting models. We coupled and conducted experiments using the Regional
Atmo-5
sphere modeling system (RAMS 4.3), with and without an explicit urban energy balance model-town energy budget (TEB) to study the role of urban land – atmosphere interac-tions in modulating the heavy rain event over the Indian monsoon region. The impact of including an explicit urban energy balance on surface thermodynamic, boundary layer, and circulation changes are analyzed. The results indicate that even for this
synopti-10
cally active rainfall event, the vertical wind and precipitation are significantly influenced by urbanization, and the effect is more significant during the storm initiation. Interest-ingly, precipitation in the upwind region of Mumbai city is increased in the simulation, possibly as a feedback from the sea breeze – urban landscape convergence. We find that even with the active monsoon, the representation of urbanization contributes to
15
local heavy precipitation and mesoscale precipitation distribution over the Indian mon-soon region. Additional experiments within a statistical dynamical framework show that an urban model by itself is not the dominant factor for the enhanced rainfall for Mumbai heavy rain event; the combination of updated SST fields using Tropical Rainfall Mea-surement Mission (TRMM) data with the detailed representation of urban heat island
20
(UHI) simulated by the TEB/urban model created realistic gradients that successfully maintained the convergence zone over Mumbai. Further research will require more detailed morphology data for simulating weather events in such urban regions. The results suggest that urbanization can significantly contribute to extremes in monsoonal rain events that have been reported to be on the rise.
ACPD
8, 8773–8816, 2008
Mumbai heavy rain
M. Lei et al. Title Page Abstract Introduction Conclusions References Tables Figures ◭ ◮ ◭ ◮ Back Close
Full Screen / Esc
Printer-friendly Version Interactive Discussion 1 Introduction
On 26 July 2005, an unexpected heavy precipitation event occurred over the Mumbai urban region and adjacent areas. A steady downpour initiated around 11 AM local time (06Z), and several regions within a 100 km area showed an unprecedented amount of rainfall over the following 24-h period. For instance, the Santacruz India
Meteorolog-5
ical Department (IMD) official rainfall data recorded a record-breaking 944 mm 24-h rainfall total. Storm reports recorded locations in North Mumbai that received around 1000 mm of rainfall. The event also showed remarkable variability between locations, with stations in southern Mumbai receiving from a trace to ∼74 mm of rain at another IMD rainfall gauge at Colaba (25 km south of Santacruz). The event caused nearly
10
500 deaths and is classified as a billion US Dollars natural disaster (NCDC, 2007). Most forecasting models did not predict this heavy rain event successfully. This event is being studied by a number of forecasting groups and teams to improve model performance and subsequently, forecast accuracy. Chang et al. (2008) used a MM5 and WRF model to simulate this event and found that the MM5 could reproduce about
15
40–60% of the Mumbai rainfall, while the WRF simulated about 60–80% of the ob-served precipitation. Bohra et al. (2006) documented the India National Center for Medium Range Weather Forecasting (NCMWRF) synthesis of this heavy rain event. They concluded that a high resolution model setup could significantly enhance model performance but most of the predicted rain was in the range of 100–200 mm. Jenamani
20
et al. (2006) studied the IMD analysis of the Mumbai rain event, and they found that the rain band/low pressure system positioned over the Western Ghats interacted with mesoscale processes to create the heavy rain event. Vaidya and Kulkarni (2006) in-dependently confirmed a similar conclusion; and found that a cloud burst phenomenon was the main reason for the heavy rain. They also concluded that the event could be
25
reasonably simulated using a high resolution mesoscale model with a proper choice of boundary conditions and domain size (to capture the synoptic and mesoscale feed-backs). Shyamala and Bhadram (2006) extended the analysis using observational
ACPD
8, 8773–8816, 2008
Mumbai heavy rain
M. Lei et al. Title Page Abstract Introduction Conclusions References Tables Figures ◭ ◮ ◭ ◮ Back Close
Full Screen / Esc
Printer-friendly Version Interactive Discussion
data for synoptic, thermodynamic, radar, and satellite analyses. They concluded that a cloud band over the Arabian Sea on 25 July corresponded to a strong low-level wind over Mumbai, and that mid-troposphere dryness might have contributed to the heavy rain. Chang et al. (2008) tested the impact of land surface representation within Weather Research and Forecasting (WRF) modelling system; and concluded that the
5
results were sensitive to the choice of convection parameterizations and land-surface processes.
Global climate model ensemble experiments by Koster et al. (2004) have highlighted the Indian monsoon region as a land-atmosphere coupling “hotspot”. Goswami et al. (2006) analyzed the rainfall patterns over the Indian monsoon region and concluded
10
that the heavy rain events are significantly increasing. Kishtawal et al. (2008)1analyzed the long-term rainfall data and found urban regions have more statistically significant precipitation occurrence as compared to the rural regions. Studies such as Braham and Wilson (1978), Shepherd and Burian (2003), and Niyogi et al. (2006) have shown urban land surface can influence local storm structure causing enhanced convection
15
and increased precipitation. The role of urban landscape on the heavy rain simulation over the synoptically active Indian monsoon region has not been studied.
The impact of urban land surface on regional meteorology is well documented. Studying the surface temperature patterns, Howard (1833) delineated the urban heat island (UHI) in London. Subsequently, a number of studies have found that the
ur-20
ban heat island is an important feature in regional meteorology (Oke, 1988). In recent decades, interest has grown in the impact of urbanization on mesoscale convection and precipitation. Urban landscapes have been linked to the initiation or intensifica-tion of convective activities over cities through altered thermodynamic stability. Niyogi et al. (2006) studied urban-rural heterogeneity-based convective boundaries which
af-25
fected precipitation patterns around Oklahoma City. Shepherd et al. (2002) found more intense rainfall rates over and downwind of major cities such as Atlanta and Dallas.
1
Kishtawal, C., Niyogi, D., Tewari, M., Pielke, R. A., and Shepherd, M.: Heavy Rainfall During Indian Summer Monsoon: A Clear Urban Bias, Geophys. Res. Lett., in revision, 2008.
ACPD
8, 8773–8816, 2008
Mumbai heavy rain
M. Lei et al. Title Page Abstract Introduction Conclusions References Tables Figures ◭ ◮ ◭ ◮ Back Close
Full Screen / Esc
Printer-friendly Version Interactive Discussion
Rozoff et al. (2003) found that the UHI during a thunderstorm event over St. Louis, Missouri had the largest role in initiating deep, moist convection downwind of the city. Therefore the urban energy balance is vital to the understanding of the importance of meteorological variables within urban areas. Gero and Pitman (2006) studied the storm climatology in Australia’s Sydney Basin and found that the local convective storms were
5
highly sensitive to the triggering mechanism associated with land surface influences. Pyle et al. (2008) analyzed the Indianapolis urban region and its storm climatology and concluded that urban land surface can change storm morphology and regional pre-cipitation. Thus, significant background evidence suggests that the urban landscape can affect storm morphology, and that mesoscale boundaries can modify storm-related
10
precipitation.
Mumbai is a major coastal city on the west coast of India and is the country’s com-mercial capital. The population of the downtown and surrounding suburbs increased from 9.9 million in 1981 to 13.0 million in 1991 and 17.7 million in 2001 (International Institute for Population Studies, IIPS). The city is experiencing rapid urbanization, and
15
such densely populated cities with an aging infrastructure are vulnerable to natural dis-asters. Therefore, it is important to assess the possible impact of the Mumbai urban landscape and its representation in the July 2005 heavy rain event.
To date, the 26 July 2005 heavy rain event in Mumbai has many clear features, yet many unknown causes, thus we are primarily interested in clarifying the role that
20
landscape change including urbanization played in this event. Our hypotheses include: 1) By using an explicit 3-D urban surface energy balance model- Town Energy Bud-get (TEB), we can better represent the land-atmospheric interactions and improve the simulation of the heavy rain event over Mumbai city in a mesoscale model;
2) Precipitation distribution and intensity will be significantly changed due to the
ur-25
ban landscape, especially in upwind and downwind regions;
3) The effect of urbanization on heavy precipitation occurs on a relatively local scale near the urban region, and the large scale precipitation will be influenced by the sea surface temperature (SST) fields.
ACPD
8, 8773–8816, 2008
Mumbai heavy rain
M. Lei et al. Title Page Abstract Introduction Conclusions References Tables Figures ◭ ◮ ◭ ◮ Back Close
Full Screen / Esc
Printer-friendly Version Interactive Discussion
2 Data and methodology
The Regional Atmospheric Modeling System (RAMS) version 4.3 (Pielke et al., 1992, 2001; Cotton et al., 2003) was adopted for this study. RAMS is a primitive equation, non-hydrostatic mesoscale environmental modeling system; its performance to skilfully simulate convective systems has been validated in various prior studies (e.g. Nair et al.
5
1997; Rozoff et al., 2003), including a study over India (Mukhopadhyay et al., 2005). RAMS involves a two-way interactive grid nesting. The three nested grids in this study had an 80, 20, and 5 km grid spacing with the same center points (19.15 N, 73.05 E) as shown in Fig. 1. Grid 1 had 36×26 horizontal grid points and a time step of 27 s that covers the whole south Asia monsoon region. The second domain simulated
10
the general synoptic and mesoscale setting with 82×74 horizontal grid points and a time step of 9 s. The third grid has 94×58 horizontal grid points, and a time step of 3 s. The grid was mostly focused over Mumbai and its adjacent Arabian Sea region. We selected 36 vertical layers with spacing from 0.05 to 1.27 km in the first 8.5 km of the atmosphere; the spacing was maintained at 1.27 km for heights above 8.5 km. The total
15
depth of the model atmosphere is 15 km. Figure 1 shows the three nested domains. The urban model coupling was carried over the inner-most region that covers Mumbai. Model initialization for this study was horizontally inhomogeneous with forcing data from the National Center for Environmental Prediction (NCEP) Global Data Assimilation System (GDAS) (Kalnay et al., 1996). All simulations were performed for 120 h from
20
25–30 July 2005. Soil moisture was initialized at 35% of soil moisture capacity (as a percentage of soil texture dependent saturation) and followed the GDAS fields. The soil moisture and soil temperature prognostically changed and quickly allowed spatial het-erogeneity to the region. This study used the modified Kuo cumulus parameterization scheme for domain 1 and 2. Table 1 summarizes the basic model configuration.
25
A number of model experiments were performed and the most significant impact was found for prescription of SST fields. SST was important for setting the mesoscale boundaries in the coastal regions. We used the default SST data in RAMS 4.3 as the
ACPD
8, 8773–8816, 2008
Mumbai heavy rain
M. Lei et al. Title Page Abstract Introduction Conclusions References Tables Figures ◭ ◮ ◭ ◮ Back Close
Full Screen / Esc
Printer-friendly Version Interactive Discussion
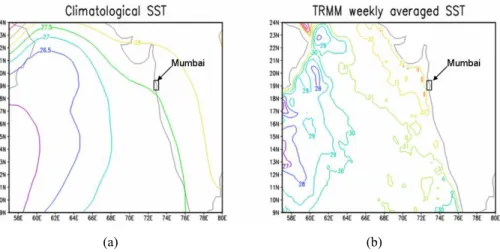
climatological SST from 1950 to 1980 for the sensitivity study discussed below. The model results discussed in the following section, however, are based on Tropical Rain-fall Measurement Mission (TRMM), weekly data from 23 July (0.25 degree resolution). The TRMM satellite travels west to east in a semi-equatorial orbit. This path produced data collected at changing local times for any given earth location between latitudes
5
40 S and 40 N. As compared to the climatology, the TRMM data shows a higher SST and a larger gradient along the Western Ghats (Figs. 2a–b). Figure 2b shows a high SST zone (32◦C) near the west coast of Mumbai which is noteworthy, as is shown in the model simulations.
The default land surface model-Land Ecosystem Atmosphere Feedback (LEAF-2)
10
model (Walko et al., 2000) was used to account for the exchange of heat and moisture between the soil, vegetation, canopy, surface water, and atmosphere. LEAF-2 explicitly represents canopy processes following Deardorff (1978). It also represents the details of turbulent exchange and radiative transfer, as well as physical evaporation, transpi-ration, precipitation, and fluxes of heat and moisture between the soil or snow and the
15
atmosphere (Lee, 1992; Walko et al., 2000). LEAF2 vegetation types comprise a com-bination of Biosphere Atmosphere Transfer Scheme (BATS) and land data assimilation system (LDAS) classes (Dickinson, 1984). The land-use data are based on the USGS global data set.
For the innermost domain, the LEAF2 scheme was coupled with an explicit urban
20
model: the Town Energy Budget (Masson, 2000) to study the urban area (only LEAF2 run is considered as control run). The TEB is used only for energy balance over the urban land use grids, while LEAF2 is the default. The 5 km grid spacing in the third domain was further allowed to have 4 sub-grid land-use categories following a mosaic approach (Avissar and Pielke, 1989; Koster and Suarez, 1996). For the urban sub-grid
25
land use, the TEB was used for solving the energy budget, and for other land uses, the default LEAF2 representations were employed. The total (grid-averaged) fluxes and scalar output for the grids with urban land use thus consisted of a sum of the TEB and LEAF2.
ACPD
8, 8773–8816, 2008
Mumbai heavy rain
M. Lei et al. Title Page Abstract Introduction Conclusions References Tables Figures ◭ ◮ ◭ ◮ Back Close
Full Screen / Esc
Printer-friendly Version Interactive Discussion
For the TEB, information on the buildings, roads and average geometry of the urban area are needed. We constructed the TEB parameters for Mumbai city based on our knowledge of local geography and discussions with local experts; the final land-use morphology domain was also guided by several high resolution (street scale) maps including Google Earth maps (maps.google.com). Typically for downtown areas, the
5
average building height was 8 m, with varying building and canyon ratios reasonable for the average buildings in Mumbai. The roughness length was approximated as 0.8 m; a value considered typical for urban/suburban areas. Table 2 summarizes important TEB parameters. We stress that the table created was principally for driving the model and had a high degree of approximation (due to lack of publicly available morphology
10
data).
3 Results
3.1 Synoptic scenario
In July 2006 when the monsoon was active, strong westerly or southwesterly wind flow developed along with the formation of an offshore trough over the Arabian Sea. A
low-15
pressure system formed over the North Bay of Bengal and Orissa coast on 24 July and intensified as it moved inland. It brought the monsoon trough to the south of its aver-age position along 20–22 N, with a strong cross-equatorial flow over the Arabian Sea. As the system moved westward, the low-level jet continuously intensified, and strong westerly winds lashed the west coasts. Generally, this scenario leads to widespread
20
heavy rainfall over the Western Ghats and Mumbai regions (Francis and Gadgil, 2006; Kumar et al., 2007). On 26 July, the rain belt dropped more than 100 mm of precipita-tion at many staprecipita-tions in Konkan (Western Ghats) and Goa and then moved northward. Subsequently on the 26 July, Mumbai and many other parts of Maharashtra (east of Mumbai) were devastated with heavy rains.
25
ACPD
8, 8773–8816, 2008
Mumbai heavy rain
M. Lei et al. Title Page Abstract Introduction Conclusions References Tables Figures ◭ ◮ ◭ ◮ Back Close
Full Screen / Esc
Printer-friendly Version Interactive Discussion
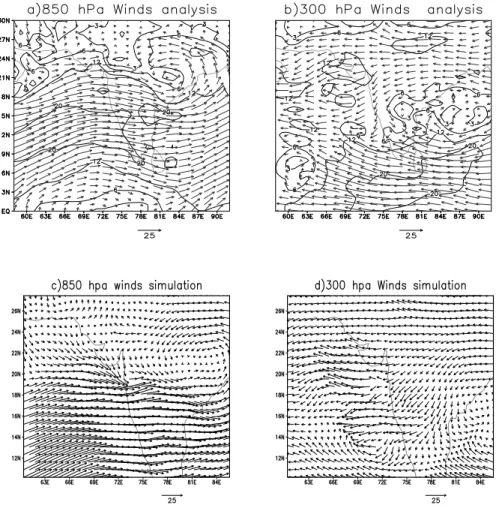
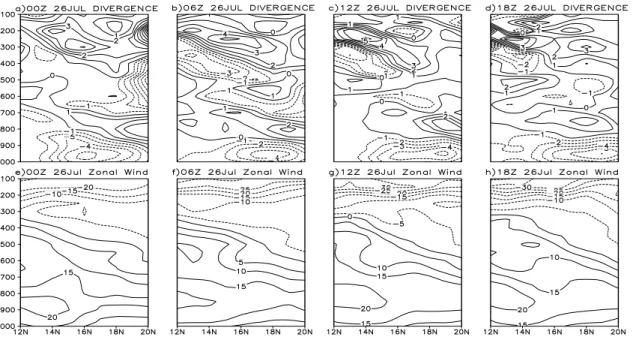
be viewed using the 850 hPa and 300 hPa wind analysis from the NCEP analyses valid at 12Z 26 July 2005 from the NCEP analyses (Fig. 3). Figure 3a shows the presence of a strong cyclonic circulation that extends upwards to the mid-troposphere over Orissa and eastern part of Madhya Pradesh associated with a well-marked low-pressure sys-tem near the surface. The 850 hpa plots also show the presence of strong westerly
5
or north-westerly winds with speeds of 20 m s−1 (Fig. 3a) over the western coast of India including Mumbai. This low-level, strong westerly or northwesterly wind became easterly or northeasterly at 300 hPa (Fig. 3b) with speeds between 6–12 m s−1 over Mumbai. Model simulations shown in Fig. 3c–d, successfully captured both features remarkably well.
10
The divergence components of the wind provide an understanding of the atmo-spheric divergent circulation associated with the vertical motion field. Generally the atmospheric heating associated with convection will induce centers of divergence. Analysis of the divergence field (Fig. 4a–d) at various times on 26 July 2005 indicate that the upper-level divergence, overlying deep low- and mid-level convergence had
15
been present in the Mumbai area for some time, along with a substantial increase in convergence below 700 hPa. This presence of a convergence pattern appears to be consistent with the observed changes in the rainfall intensity.
The vertical cross section of zonally-averaged wind (72.5 E–73.5 E) for this analysis at different times is shown in Fig. 4e–h. The zonal wind cross sections clearly
illus-20
trate the development of a low-level jet, which reaches a maximum of approximately 20 m s−1 near 700 hPa at 12Z and 18Z on 26 July, respectively. The convective sys-tem that produced the intense rainfall appears to have developed over Mumbai just to the north of the low-level jet. The control experiments predicted the strong westerly or northwesterly winds over the western coast of India with a maximum speed of 20 m s−1.
25
The model showed the presence of a strong cyclonic circulation over Orissa and the eastern part of Madhya Pradesh. The control experiment simulated the upper-level easterly or northeasterly flow reasonably well, with speeds of approximately 12 m s−1 over Mumbai. As a whole, both the upper- and lower-level large-scale circulation
fea-ACPD
8, 8773–8816, 2008
Mumbai heavy rain
M. Lei et al. Title Page Abstract Introduction Conclusions References Tables Figures ◭ ◮ ◭ ◮ Back Close
Full Screen / Esc
Printer-friendly Version Interactive Discussion
tures are simulated reasonably well when compared with the corresponding NCEP analyses. The upper-level divergence and low- and mid-level convergence was sim-ulated well in the mesoscale model run. All major features described in the analysis were satisfactorily reproduced, though some features, such as the low-level jet, were relatively weaker than the observations.
5
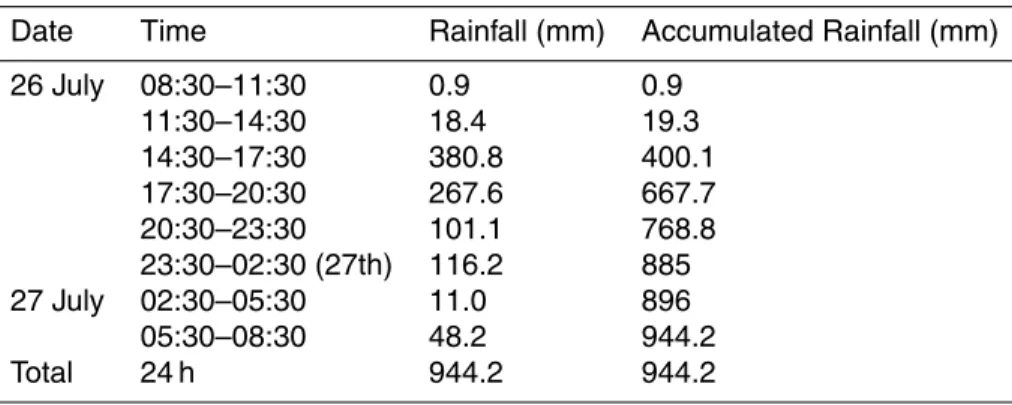
3.2 Rainfall
According to the official IMD rainfall observation over Santacruz (Table 3), the nearly 950 mm total occurred from 14:30 to 20:30 26 July 2006. The model simulated nearly 600 mm precipitation (approx.) in different experiments for the same period (Fig. 5). Simulations coupled with the TEB run showed consistently higher precipitation from
10
noon of 26 July, indicating the significance of incorporating explicit urban model sur-face effects of urbanization. This feedback is discussed in more detail in the following section.
Both the Tropical Rainfall Measuring Mission (TRMM) satellite and the CPC MOR-PHing technique (CMORPH) from the NCEP analysis over the Indian sub-continent on
15
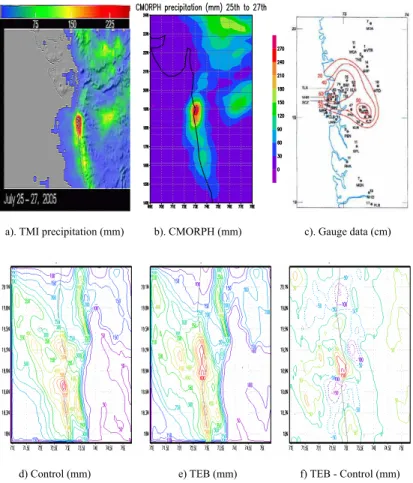
26 July 2005 showed a localized hotspot over Mumbai (Figs. 6a, b). Figure 6c depicts the spatial precipitation distribution regressed from gauge data. The RAMS-simulated precipitation with, without TEB and their difference is shown in Figs. 6d–e. Both precip-itation measures are highly concentrated over the Mumbai region. The model run that includes the TEB had some significant spatial differences which are discussed below.
20
3.3 Vertical structure/sounding
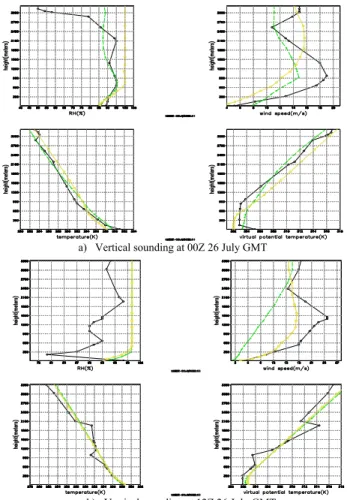
One of the important sources of observation data: sounding profiles is useful in the understanding of the atmosphere’s vertical structure. The pre-storm sounding data (0Z 26 July), and sounding data during the storm (12Z 26 July), were available for analysis over Mumbai (Fig. 7).
25
ACPD
8, 8773–8816, 2008
Mumbai heavy rain
M. Lei et al. Title Page Abstract Introduction Conclusions References Tables Figures ◭ ◮ ◭ ◮ Back Close
Full Screen / Esc
Printer-friendly Version Interactive Discussion
decreased with height, and air temperature in the TEB run generally matched the ob-servation, although the control results were within 1 K. Similar results were obtained for virtual potential temperature from the ground surface to 500 m. The TEB results were generally closer to observation, being about 1 K higher than the observation, and the control run result was slightly lower. From 1000–3000 m, the TEB results more
5
closely matched the observations, with the control results being about 1 K higher than the observations. Relative humidity from the observations showed a decrease from 600 to 3000 m height. The TEB results captured this trend, but the control run showed a saturated condition at about 600 m. For wind speed, sounding data showed stronger values at about 1000 m. This structure was simulated well by the TEB run, but at 900 m
10
height the maximum winds were underestimated. In the control run, the wind profile did not show a jet and reached a maximum speed at a height of about 2000 m. Thus overall, the TEB run appears to be superior than the control in simulating a vertical structure that is closer to the observations.
The 12Z 26 July sounding corresponds to the time Mumbai was experiencing heavy
15
rainfall (Fig. 7b). Generally the sounding data had a high uncertainty during the heavy precipitation, but these data still can serve as a reference for analysis. Air temperature and virtual potential temperature (θv) were nearly identical in the TEB and control runs.
Both results were reasonable, and the structures for air temperature and θv match well
with the observations. Simulated relative humidity was saturated, which is reasonable
20
considering the heavy rain, even though the sounding data does not show saturation. Wind speed during the heavy precipitation event was high at 1500 m height according to the observations. Neither TEB nor control captured this well. Above 2300 m, the TEB result was closer to the observations.
4 Impact of coupling the urban TEB within RAMS mesoscale model
25
The simulation results discussed above indicate that the mesoscale model (RAMS), when coupled with the explicit urban model TEB, has an enhanced ability to reproduce
ACPD
8, 8773–8816, 2008
Mumbai heavy rain
M. Lei et al. Title Page Abstract Introduction Conclusions References Tables Figures ◭ ◮ ◭ ◮ Back Close
Full Screen / Esc
Printer-friendly Version Interactive Discussion
the boundary layer over urban areas. In this section we further discuss the impact of representing an explicit urban model within the mesoscale modeling system.
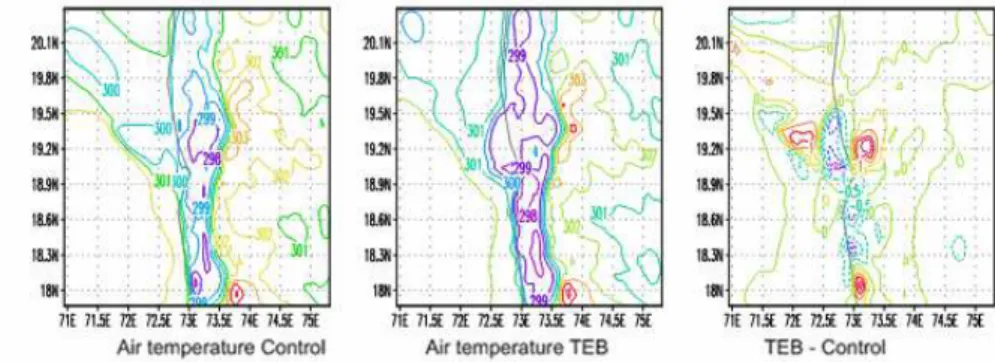
4.1 Temperatures and fluxes change over the urban region (UHI simulation)
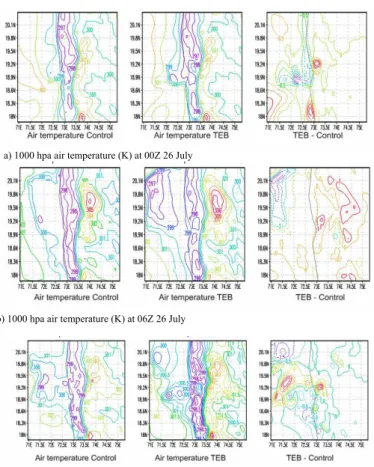
The urban heat island (UHI) was well simulated by RAMS TEB around the Mumbai region. Figure 8 shows the 10 m air temperature change which occurred when using
5
the explicit urban representation. The urban region had a significant UHI both in the daytime and the night. During the monsoon season, generally the cloud cover over west coast of India is high. This feature was well simulated by the model and the simulated cloud cover over coastal land region on the west of India is mostly close to 100% (not shown). This caused the incident solar radiation near the surface to be quite
10
low. The low-level wind during the period was controlled by the south Asian monsoon and the strong southwest wind feature, therefore, air temperatures increased above the urban region and above downwind and northeast of Mumbai city. Figure 8a–d show air temperature changes at 0Z, 6Z, 12Z and 18Z for the two runs. The corresponding diurnal time series over an urban, rural, and offshore locale is displayed in Fig. 8e.
15
Throughout the day, the warming zone extended from the city center to the northeast direction of the city with a 1–2 K higher temperatures than in the surroundings. The size of this region, which experienced a significant warming due to UHI, is about 50×50 km with an extended area in the northeast downwind direction. Comparing different times within one day, the UHI was apparent for most of the day except the afternoon
20
when heavy precipitation occurred and cloud cover was at its highest. In the upwind direction from urban region, there was a cooling from 0.5–1 K just over the Mumbai coastal region. This cooling was probably because of the rainfall over the region and the general associated circulation.
The simulation clearly showed that the UHI was generally more significant downwind
25
of the city from 73 E–73.5 E. Vertically, the higher air temperature was typically noted up to a height of 400 m above the surface (Fig. 9). The warming effect decreases with height: at 100 m TEB results were 1 K warmer; this difference decreased to nearly
ACPD
8, 8773–8816, 2008
Mumbai heavy rain
M. Lei et al. Title Page Abstract Introduction Conclusions References Tables Figures ◭ ◮ ◭ ◮ Back Close
Full Screen / Esc
Printer-friendly Version Interactive Discussion
0.5 K at 200 m, and then the warming effect essentially disappeared. The UHI effect was distributed downwind direction of Mumbai city, especially in the 73 E to 73.5 E region.
One key mechanism of low-level jet formation involves horizontal differences in heat fluxes, which can produce strong, shallow baroclinicity in the boundary layer (Stensrud,
5
1996). The low-level jet in many other heavy precipitation events has been found to be enhanced because of the gradient in sensible and latent heat fluxes, this spatially varying flux distribution has been attributed to gradients in soil moisture (Holt et al., 2006). Consistent with the surface air temperature results discussed above, and as observed over Mumbai city, the sensible heat flux increased after urbanization (using
10
the TEB) by approximately 50 W m−2 (Fig. 10). During a 24 h time period, the UHI was more significant during the night (00:00 a.m.) and early morning (06:00 a.m.), consistent with previous conclusions that the UHI was relatively more significant after late afternoon (Fig. 9) (Niyogi et al., 2006).
The interaction of the land-surface and the atmosphere can also produce high
spa-15
tial variability in latent heat fluxes. This land-surface interaction is another important process for producing variability in tropical rainfall. Figure 11 shows the temporal latent heat fluxes. As expected, the TEB did not change the latent heat flux significantly due primarily to the very low evaporation over the urban region. The latent heat flux showed a slight decrease by about 50 W m−2 in the upwind direction over the sea most likely
20
due to the precipitation increase and temperature decrease over this area. 4.2 Winds and convergence
From the simulation results, over the city on the afternoon of 26 July an obvious vertical updraft was apparent both in the control and the TEB simulations (Fig. 12). With the urban TEB run, the updrafts are generally in the upwind direction (Fig. 12c). The
25
enhancement in the vertical velocity is 0.5 m s−1. Convergence changes associated with wind, roughness change, and thermal conditions are shown in Figs. 13a–d. For 12Z on 26 July, with the TEB run, the low-level offshore winds are slower. The control
ACPD
8, 8773–8816, 2008
Mumbai heavy rain
M. Lei et al. Title Page Abstract Introduction Conclusions References Tables Figures ◭ ◮ ◭ ◮ Back Close
Full Screen / Esc
Printer-friendly Version Interactive Discussion
run shows a lower wind speed zone over the city with a speed of 10 m s−1 up to about 200 m high, and the TEB run shows the low wind zone at 10 m s−1 over 1000 m. The wind speed above the urban region below a height of 500 m decreases from 10 m s−1to 2 m s−1 (Fig. 13c). This change due to urbanization indicates increased convergence in the upwind direction. As seen in Fig. 13d, from the ground surface to a height of
5
3000 m at 72 E, a significant convergence zone developed over Mumbai. With the TEB run, the results indicated that the low-level convergence increased up to 3000 m and decreased thereafter.
NCEP analysis also shows a similar trend with the divergence field for different times on 26 July (Figs. 4). The analysis indicates that upper-level divergence overlying deep,
10
low- and mid-level convergence existed over the Mumbai region and a substantial in-crease in convergence below 700 mb occurred that helped enhance the moisture trans-port.
4.3 Rain water mixing, cloud water mixing ratio, and precipitation
Consistent with the vertical wind fields, the rain water mixing ratio in TEB run also
15
increased upwind of the city and decreased in the center and downwind of the city compared to the control run (Fig. 14). Above the urban region in the upwind direction, the rain water mixing ratio was modified due to urbanization. This ratio increased from 1 g kg−1 to about 1.4 g kg−1 up to 4500 m height. The cloud water mixing ratio shows a similar trend (Fig. 15). On the afternoon of 26 July, Fig. 15 shows the cloud water
20
mixing ratio at 12 Z. The control run shows that the cloud water ratio has increased between the heights of 2000–6000 m with the maximum zone at 5000 m generally oc-curring above the 72 E to 73.5 E region. After urbanization, the upwind area from 71.5 E to 72.5 E around 19.15 N had a higher cloud water mixing ratio at around 5000 m. The cloud water mixing ratio was modulated by vertical winds (Fig. 15c). As a result of
25
these changes after urbanization, precipitation distribution and intensity were both sig-nificantly influenced by mesoscale dynamical feedbacks. As displayed previously in
ACPD
8, 8773–8816, 2008
Mumbai heavy rain
M. Lei et al. Title Page Abstract Introduction Conclusions References Tables Figures ◭ ◮ ◭ ◮ Back Close
Full Screen / Esc
Printer-friendly Version Interactive Discussion
Fig. 6, the accumulated precipitation from 25–27 July 2005 for the control run indicates that the precipitation location is not well represented; the precipitation was split into two rain centres over north and south Mumbai city. After coupling with the TEB, the model precipitation appears correctly over the Mumbai bay area and was increased by a significant amount (200 mm).
5
5 Analysis of the explicit SST and the urban land-atmosphere interactions
To further resolve the explicit role of the urban model and satellite-captured SST on the convection, we performed a statistical factor separation analysis (Stein and Alpert, 1993) from 26–27 July 2005. Model-simulated vertical velocity, convergence, and 12-h accumulated precipitation were analyzed. The intent of the analysis was to quantify
10
the relative impacts of (i) the representative urban model (f2), (ii) the improved satellite SST data (f1), and (iii) improvements in both the urban model and SST representations (f12). According to Stein and Alpert (1993), the relative impacts f1, f2 and f12 are given by the field differences between the simulations F0, F1, F2 and F12 as:
f1 = F1 − F0 (1)
15
f2 = F2 − F0 (2)
f12 = F12 − (F1 + F2) + F0 (3)
where F0 is the climatological SST without the TRMM SST fields or the urban model, F1 is the simulation with TRMM SST but without the urban model, F2 is the simulation with the urban model TEB but without TRMM SST, and F12 is the simulation using both
20
TRMM SST and the urban model TEB. The analysis in the previous section showed that the convergence pattern over Mumbai is an important variable which links the atmospheric condition to the precipitation. Because the maximum intensity occurred between 10 and 11 Z, we focus on the spatial convergence at 850 hPa level at 09 Z
ACPD
8, 8773–8816, 2008
Mumbai heavy rain
M. Lei et al. Title Page Abstract Introduction Conclusions References Tables Figures ◭ ◮ ◭ ◮ Back Close
Full Screen / Esc
Printer-friendly Version Interactive Discussion
on 26 July. Figure 16a shows that without TRMM SST, both the F0 and F2 simulations have their convergence centres northeast of Mumbai, and no convergence is seen near the urban center. F1 simulation, with SST and no urban model, has a convergence belt along the coastal region, while its center is to the south of Mumbai. With the urban model (F2 simulation), the convergence zone narrows and strengthens over the
5
Mumbai peninsula.
Figure 16b shows the explicit contribution of each effect. The spatial plot suggests that the updated SST fields have an important effect on convergence and rainfall. In-teraction of the urban scheme and the TRMM SST allows for more realistic local scale heterogeneities to be developed that alters the location of the rainfall bands. Figure 16c
10
shows the vertical convergence structure at 19.15 N. Adding the TRMM SST field (f1) increases the strength of the convergence at the border, but decreases the conver-gence above the Mumbai region, and without the SST, the urban model (f2) decreases the convergence slightly above the urban area. However, their interactions show an obviously increasing effect on the convergence above the city. Vertical velocity shows
15
a similar effect (not shown). Without the TRMM SST data, the updraft located to the east of the city in the urban model weakens. The TRMM SST thus appears to provide the right gradients that displaced the updraft zone to the east of the city, and the urban model strengthens the upward motion of the air mass.
The resulting impact on the accumulated rainfall is shown in Fig. 17. The rainfall
20
simulation is enhanced due to the TRMM SST (F1). The simulated locale is northeast of Mumbai. The urban model leads to changes that locate the heavy precipitation center above Mumbai, and slightly west of the observation center (F12).
On 27 and 28 July, the simulation showed the same trends as 26 July. Figure 18 shows the time series of the individual simulations and interactions based on the
fol-25
lowing factor separation analysis. Summarizing these results, the urban model by itself did not affect the precipitation pattern over the region. However, considered in con-junction with realistic SSTs, the urban model creates the right mesoscale boundaries that contribute to significantly increase rainfall over Mumbai. This interaction effect
ACPD
8, 8773–8816, 2008
Mumbai heavy rain
M. Lei et al. Title Page Abstract Introduction Conclusions References Tables Figures ◭ ◮ ◭ ◮ Back Close
Full Screen / Esc
Printer-friendly Version Interactive Discussion
contributes to over 200 mm of the precipitation for this event, especially during the maximum intensity of this precipitation event.
6 Conclusions
We simulated the 26 July 2005 heavy rain event in Mumbai using a mesoscale model (RAMS) coupled with an explicit urban energy balance scheme (the TEB). The
follow-5
ing conclusions can be made:
1) The mesoscale model, RAMS had a reasonably good performance in simulat-ing the precipitation fields when ussimulat-ing proper schemes, reliable initial and boundary conditions.
2) Coupling the explicit urban model showed a consistently enhanced performance.
10
3) The urban landscape caused an UHI, which interacted with the SSTs causing a mesoscale convergence zone over Mumbai. This convergence zone appears to be a major reason for the moisture transport and heavy rain to center over Mumbai.
4) The factor separation analysis suggests that the urban model by itself is not the main reason for the enhanced rainfall; rather the combination of the updated SST fields
15
using the TRMM data, and the UHI simulated by the TEB/urban model that created the realistic gradients that accurately maintained the convergence zone over Mumbai.
In summary, the SSTs and landscape pattern helped transport large amounts of moisture over the Western Ghats region, while the mesoscale boundaries created by the urban land surface and sea surface temperature gradients helped the positioning
20
by the convergence zone and heavy precipitation focus over Mumbai.
Acknowledgements. The authors would like to acknowledge NSF-ATM 0233780 (S. Nelson),
NASA–THP (J. Entin NNG05GQ47G and NNG06GH17G), NASA-IDS (NNG04GL61G J. Entin and G. Gutman), NASA LCLUC Program (G. Gutman). The study also benefited from the Purdue Asian Initiative Program. R. A. Pielke was also supported in part by the University of
25
ACPD
8, 8773–8816, 2008
Mumbai heavy rain
M. Lei et al. Title Page Abstract Introduction Conclusions References Tables Figures ◭ ◮ ◭ ◮ Back Close
Full Screen / Esc
Printer-friendly Version Interactive Discussion References
Avissar, R. and Pielke, R. A.: A parameterization of heterogeneous land surfaces for atmo-spheric numerical models and its impact on regional meteorology, Mon. Weather Rev., 117, 2113-2136, 1989.
Bohra, A. K., Basu, S., Rajagopal, E. N., Iyengar, G. R., Gupta, M. D., Ashrit, R., and
Athiya-5
man, B.: Heavy rainfall episode over Mumbai on 26 July 2005-Assessment of NWP guidance, Curr. Sci. India., 90, 1188–1194, 2006.
Braham, R. R. and Wilson, D.: Effects of St. Louis on Convective Cloud Heights, J. Appl. Meteor., 17, 587–592, 1978.
Chang, H., Kumar, A., Niyogi, D., Mohanty, U.C., Chen, F., and Dudhia, J.: The role of land
10
surface processes on the mesoscale simulation of the July 26, 2005 heavy rain event over Mumbai. India, Glob. Plan. Change, in press, 2008.
Cotton, W. R., Pielke, R. A., Walko, R. L., Liston, G. E., Tremback, C. J., Jiang, H., McAnelly, R. L., Harrington, J. Y., Nicholls, M. E., Carrio, G. G., and McFadden, J. P.: RAMS 2001: Current Status and Future Directions, Meteorol. Atmos. Phys., 82, 5–29, 2003.
15
Deardorff, J.: Efficient prediction of ground surface temperature and moisture with inclusion of a layer of vegetation, J. Geophys. Res., 20, 1889–1903, 1978.
Dickinson, R. E.: Modelling evapotranspiration for three-dimensional global climate models. Climate Processes and Climate Sensitivity, Geophys. Monogr., 29, 58–72, 1984.
Francis, P. A. and Gadgil, S.: Intense rainfall events over the west coast of India, Meteorol.
20
Atmos. Phys., 94, 27–42, 2006.
Gero, A. F. and Pitman, A. J.: The Impact of Land Cover Change on a Simulated Storm Event in the Sydney Basin, J. Appl. Meteor. Climatol., 45, 283–300, 2006.
Goswami, B. N., Sengupta, V. D., Madhusoodanan, M. S., and Xavier, P. K.: Increasing Trend of Extreme Rain Events Over India in a Warming Environment, Science, 314, 1442–1445,
25
2006.
Holt, T., Niyogi, D., Chen, F., LeMone, M. A., Manning, K., and Qureshi, A. L.: Effect of Land-Atmosphere Interactions on the IHOP 24–25 May 2002 Convection Case, Mon. Weather Rev., 134, 113–133, 2006.
Howard, L.: The climate of London, deduced from meteorological observations, London,
Har-30
vey and Darton, 348 pp., 1833.
mete-ACPD
8, 8773–8816, 2008
Mumbai heavy rain
M. Lei et al. Title Page Abstract Introduction Conclusions References Tables Figures ◭ ◮ ◭ ◮ Back Close
Full Screen / Esc
Printer-friendly Version Interactive Discussion
orological event that caused a record highest rainfall in Mumbai, Curr. Sci. India., 90, 1344– 1363, 2006.
Kalnay, E., Kanamitsu, M., Kistler, R., Collins, W., Deaven, D., Gandin, L., Iredell, M., Saha, S., White, G., Woolen, J., Zhu, Y., Chelliah, M., Ebisuzaki, W., Higgins, W., Janowiak, J., Mo, K. C., Ropelewski, C., Wang, J., Leetma, A., Reynolds, R., Jenne, R., and Joseph, D.: The
5
NCEP/NCAR 40-year reanalysis project, Bull. Am. Meteorol. Soc., 77, 437–471, 1996. Koster, R., Dirmeyer P., Guo Z., et al.: Regions of strong coupling between soil moisture and
precipitation, Science, 305, 1138–1141, 2004.
Koster, R. D. and Suarez, M. J.: Energy and water balance calculations in the Mosaic LSM, NASA Tech. Memo., 104606, 9, 59 pp., 1996.
10
Kumar, V., Bhagat, D. K., Kumar, U. R., and Ganesh, M. S.: Impact of low level jet on heavy rainfall events over Mumbai, Mausam, 58, 229–240, 2007.
Lee, T. J.: The impact of vegetation on the atmospheric boundary layer and convective storms, Atmospheric Science Paper No. 509, Colorado State University, Fort Collins, CO, 137 pp., 1992.
15
Masson, V.: A physically-based scheme for the urban energy budget in atmospheric models, Bound.-Layer Meteorol., 94, 357–397, 2000.
Mukhopadhyay, P., Sanjay, J., Cotton, W. R., and Singh, S. S.: Impact of surface meteorolog-ical observations on RAMS forecast of monsoon weather systems over the Indian region, Meteorol, Atmos. Phys., 90, 77–108, 2005.
20
Nair, U. S., Hjelmfelt, M. R., and Pielke, R. A.: Numerical Simulation of the 9–10 June Black Hills storm using CSU RAMS, Mon. Weather Rev., 125, 1753–1766, 1997.
NCDC: National Climatic Data Center-Climate of 2005 accessed at
http://www.ncdc.noaa.gov/oa/climate/research/2005/jul/hazards.htmlon 10 March 2007. Niyogi, D., Holt, T., Zhong, S., Pyle, P. C., and Basara, J.: Urban and land surface effects on the
25
30 July 2003 mesoscale convective system event observed in the Southern Great Plains, J. Geophys. Res., 111, D19107, doi:10.1029/2005JD006746, 2006.
Oke, T. R.: The Urban Energy Balance, Prog. Phys. Geogr., 12, 471–508, 1988.
Pielke, R. A., Cotton, W. R., Walko, R. L., Tremback, C. J., Lyons, W. A., Grasso, L. D., Nicholls, M. E., Moran, M. D., Wesley, D. A., Lee, T. J., and Copeland, J. H.: Comprehensive
meteo-30
rological modeling system – RAMS, Meteor. Atmos. Phys., 49, 69–91, 1992.
Pielke, R. A., Lee, T. J., Copeland, J. H., Eastman, J. L., Ziegler, C. L., and Finley, C. A.: Use of USGS-provided data to improve weather and climate simulations, Ecol. Appl. ,7, 3–21,
ACPD
8, 8773–8816, 2008
Mumbai heavy rain
M. Lei et al. Title Page Abstract Introduction Conclusions References Tables Figures ◭ ◮ ◭ ◮ Back Close
Full Screen / Esc
Printer-friendly Version Interactive Discussion
2001.
Pyle, P., Niyogi, D., Arya, S. P., Shepherd, M., Chen, F., and Wolfe, B.: An Observational and Modeling-based Storm Climatology Assessment for the Indianapolis, urban region, J. Appl. Meteorol. and Clim., accepted, 2008.
Rozoff, C. M., Cotton, W. R., and Adegoke, J. O.: Simulation of St. Louis, Missouri, Land Use
5
Impacts on Thunderstorms, J. Appl. Meteor., 42, 716–738, 2003.
Shepherd, J. M. and Burian, S. J.: Detection of Urban-Induced Rainfall Anomalies in a Major Coastal City, Earth Interactions, 7, 1–17, 2003.
Shepherd, J. M., Pierce, H., and Negri, A. J.: Rainfall Modification by Major Urban Areas: Observations from Spaceborne Rain Radar on the TRMM Satellite, J. Appl. Meteor., 41,
10
689–701, 2002.
Shyamala, B. and Bhadram, C. V. V.: Impact of mesoscale–synoptic scale interactions on the Mumbai historical rain event during 26th–27th July 2005, Current Science, 91, 12, 1649– 1654, 2006.
Stein, U. and Alpert, P.: Factor separation in numerical simulations, J. Atmos. Sci., 50, 2107–
15
2115, 1993.
Stensrud, D. J.: Importance of Low-Level Jets to Climate: A Review, J. Climate, 9, 1698–1711, 1996.
Vaidya, S. S. and Kulkarni, D. R.: Simulation of heavy precipitation over Santacruz, Mumbai on 26th July 2005, using Mesoscale model, Meteor. Atmos. Phys.,
doi:10.1007/s00703-006-20
0233-4, 2006.
Walko, R. L., Band, L. E., Baron, J., Kittel, T. G. F., Lammers, R., Lee, T. J., Ojima, D., Pielke Sr, R. A., Taylor, C., Tague, C., Tremback, C. J., and Vidale, P. J.: Coupled atmosphere biophysics hydrology models for environmental modeling, J. Appl. Meteorol., 39, 931–944, 2000.
ACPD
8, 8773–8816, 2008
Mumbai heavy rain
M. Lei et al. Title Page Abstract Introduction Conclusions References Tables Figures ◭ ◮ ◭ ◮ Back Close
Full Screen / Esc
Printer-friendly Version Interactive Discussion
Table 1. Model configuration and setup.
Category Options
Governing equations 3-D, non hydrostatic, compressible
Vertical coordinate Terrain-following z
Grid stagger and configuration Arakawa-C grid; three fixed, nested grids
Time differentiation Leapfrog and forward time difference
Turbulence closure K from deformation scaled by stability
Lower boundary and urban surface LEAF-2 with TEB (For Domain 4)
Upper boundary Rigid lid with modified Rayleigh friction layer
Lateral boundaries Klemp and Wilhelmson (1978)
Microphysics Single-moment bulk microphysics
Cumulus parameterization Modified Kuo-Tremback (1990)
ACPD
8, 8773–8816, 2008
Mumbai heavy rain
M. Lei et al. Title Page Abstract Introduction Conclusions References Tables Figures ◭ ◮ ◭ ◮ Back Close
Full Screen / Esc
Printer-friendly Version Interactive Discussion
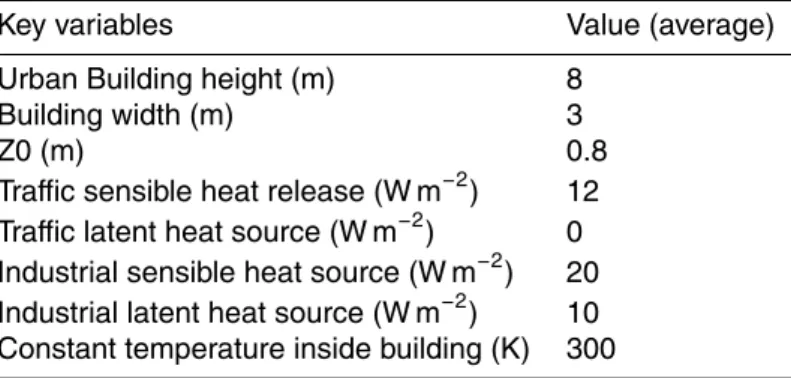
Table 2. Key input variables for TEB.
Key variables Value (average)
Urban Building height (m) 8
Building width (m) 3
Z0 (m) 0.8
Traffic sensible heat release (W m−2) 12
Traffic latent heat source (W m−2) 0
Industrial sensible heat source (W m−2) 20
Industrial latent heat source (W m−2) 10
ACPD
8, 8773–8816, 2008
Mumbai heavy rain
M. Lei et al. Title Page Abstract Introduction Conclusions References Tables Figures ◭ ◮ ◭ ◮ Back Close
Full Screen / Esc
Printer-friendly Version Interactive Discussion
Table 3. Temporal rainfall at Santacruz airport on 26, 27 July 2005.
Date Time Rainfall (mm) Accumulated Rainfall (mm)
26 July 08:30–11:30 0.9 0.9 11:30–14:30 18.4 19.3 14:30–17:30 380.8 400.1 17:30–20:30 267.6 667.7 20:30–23:30 101.1 768.8 23:30–02:30 (27th) 116.2 885 27 July 02:30–05:30 11.0 896 05:30–08:30 48.2 944.2 Total 24 h 944.2 944.2
ACPD
8, 8773–8816, 2008
Mumbai heavy rain
M. Lei et al. Title Page Abstract Introduction Conclusions References Tables Figures ◭ ◮ ◭ ◮ Back Close
Full Screen / Esc
Printer-friendly Version Interactive Discussion
Fig.1 Simulation model domains and urban region over Mumbai city (inner m
Fig. 1. Simulation model domains and urban region over Mumbai city (inner most domain with
TEB). Dashed line in third domain indicates the cross-section (at 19.15 N) that is analyzed in this study.
ACPD
8, 8773–8816, 2008
Mumbai heavy rain
M. Lei et al. Title Page Abstract Introduction Conclusions References Tables Figures ◭ ◮ ◭ ◮ Back Close
Full Screen / Esc
Printer-friendly Version Interactive Discussion
(a) (b)
Fig. 2 Comparison of SST initial conditions: (a). Default / climatological SST (°C) between Fig. 2. Comparison of SST initial conditions: (a). Default/climatological SST (◦C) between May
and August from 1950 to 1980; (b). TRMM satellite-observed weekly averaged SST(◦C) 23–29
ACPD
8, 8773–8816, 2008
Mumbai heavy rain
M. Lei et al. Title Page Abstract Introduction Conclusions References Tables Figures ◭ ◮ ◭ ◮ Back Close
Full Screen / Esc
Printer-friendly Version Interactive Discussion
ACPD
8, 8773–8816, 2008
Mumbai heavy rain
M. Lei et al. Title Page Abstract Introduction Conclusions References Tables Figures ◭ ◮ ◭ ◮ Back Close
Full Screen / Esc
Printer-friendly Version Interactive Discussion
Fig. 4. NCEP reanalysis data for zonal divergence field (10−4s−1) and zonal wind (m s−1)
ACPD
8, 8773–8816, 2008
Mumbai heavy rain
M. Lei et al. Title Page Abstract Introduction Conclusions References Tables Figures ◭ ◮ ◭ ◮ Back Close
Full Screen / Esc
Printer-friendly Version Interactive Discussion
Fig. 5. Time series for precipitation over Santacruz Airport (19◦5′N, 72◦50′E): Circles show the
observed raingauge rainfall (mm), solid line with open squares=TEB Run (mm), green dashed line with dots=control run (mm).
ACPD
8, 8773–8816, 2008
Mumbai heavy rain
M. Lei et al. Title Page Abstract Introduction Conclusions References Tables Figures ◭ ◮ ◭ ◮ Back Close
Full Screen / Esc
Printer-friendly Version Interactive Discussion
a). TMI precipitation (mm) b). CMORPH (mm) c). Gauge data (cm)
d) Control (mm) e) TEB (mm) f) TEB - Control (mm) Fig. 6 Spatial precipitation (mm) captured by TRMM, CMORPH, gauge data, and different
Fig. 6. Spatial precipitation (mm) captured by TRMM, CMORPH, gauge data, and different
ACPD
8, 8773–8816, 2008
Mumbai heavy rain
M. Lei et al. Title Page Abstract Introduction Conclusions References Tables Figures ◭ ◮ ◭ ◮ Back Close
Full Screen / Esc
Printer-friendly Version Interactive Discussion
a) Vertical sounding at 00Z 26 July GMT
b) Vertical sounding at 12Z 26 July GMT
Fig. 7. Comparison of observed and model sounding at the Santacruz airport. Solid line with
open circles=observation; green dashed line with dots=TEB run; yellow dashed line with open circles=control run.
ACPD
8, 8773–8816, 2008
Mumbai heavy rain
M. Lei et al. Title Page Abstract Introduction Conclusions References Tables Figures ◭ ◮ ◭ ◮ Back Close
Full Screen / Esc
Printer-friendly Version Interactive Discussion
a) 1000 hpa air temperature (K) at 00Z 26 July
b) 1000 hpa air temperature (K) at 06Z 26 July
c) 1000 hpa air temperature (K) at 12Z 26 July
ACPD
8, 8773–8816, 2008
Mumbai heavy rain
M. Lei et al. Title Page Abstract Introduction Conclusions References Tables Figures ◭ ◮ ◭ ◮ Back Close
Full Screen / Esc
Printer-friendly Version Interactive Discussion
d) 1000 hpa air temperature (K) at 18Z 26 July
e) 1000 hpa air temperature (K) time series over urban location: (19.15N, 72.9E); non-urban location: (19.15N, 73.2E); sea surface location: (19.15N, 72E). Black line with open squares: control run; green line with closed squares: TEB run.
ACPD
8, 8773–8816, 2008
Mumbai heavy rain
M. Lei et al. Title Page Abstract Introduction Conclusions References Tables Figures ◭ ◮ ◭ ◮ Back Close
Full Screen / Esc
Printer-friendly Version Interactive Discussion
(a)
Fig. 9. Cross-section of (a). Vertical air temperature (K) and (b). Theta-V (K, virtual potential
ACPD
8, 8773–8816, 2008
Mumbai heavy rain
M. Lei et al. Title Page Abstract Introduction Conclusions References Tables Figures ◭ ◮ ◭ ◮ Back Close
Full Screen / Esc
Printer-friendly Version Interactive Discussion
a) 00Z 26 July 2005
b) 06Z 26 July 2005
Fig. 10. 26 July sensible heat fluxes (W m−2
ACPD
8, 8773–8816, 2008
Mumbai heavy rain
M. Lei et al. Title Page Abstract Introduction Conclusions References Tables Figures ◭ ◮ ◭ ◮ Back Close
Full Screen / Esc
Printer-friendly Version Interactive Discussion
c) 12Z 26 July 2005
d) 18Z 26 July 2005
e) Sensible heat flux (W m-2
) time series over urban location: (19.15N, 72.9E); rural location: (19.15N, 73.2E); sea surface location: (19.15N, 72E). Black line with open squares = control run; green line with closed squares = TEB run.
ACPD
8, 8773–8816, 2008
Mumbai heavy rain
M. Lei et al. Title Page Abstract Introduction Conclusions References Tables Figures ◭ ◮ ◭ ◮ Back Close
Full Screen / Esc
Printer-friendly Version Interactive Discussion
ACPD
8, 8773–8816, 2008
Mumbai heavy rain
M. Lei et al. Title Page Abstract Introduction Conclusions References Tables Figures ◭ ◮ ◭ ◮ Back Close
Full Screen / Esc
Printer-friendly Version Interactive Discussion
Fig.12 Cross-section of 12Z 26 July vertical winds and its change (m s ) after using urban
Fig. 12. Cross-section of 12 Z 26 July vertical winds and its change (m s−1) after using urban
ACPD
8, 8773–8816, 2008
Mumbai heavy rain
M. Lei et al. Title Page Abstract Introduction Conclusions References Tables Figures ◭ ◮ ◭ ◮ Back Close
Full Screen / Esc
Printer-friendly Version Interactive Discussion a) Cross-section wind (m s-1) b) Cross-section convergence (10-4 s-1 )
ACPD
8, 8773–8816, 2008
Mumbai heavy rain
M. Lei et al. Title Page Abstract Introduction Conclusions References Tables Figures ◭ ◮ ◭ ◮ Back Close
Full Screen / Esc
Printer-friendly Version Interactive Discussion
Fig. 14. Cross-section of 12 Z 26 July rainwater mixing ratio (g kg−1) at 19.15 N from 71 E to
ACPD
8, 8773–8816, 2008
Mumbai heavy rain
M. Lei et al. Title Page Abstract Introduction Conclusions References Tables Figures ◭ ◮ ◭ ◮ Back Close
Full Screen / Esc
Printer-friendly Version Interactive Discussion
Fig. 15. Cross-section of 12 Z 26 July cloud water mixing ratio (g kg−1). Arrows show the
ACPD
8, 8773–8816, 2008
Mumbai heavy rain
M. Lei et al. Title Page Abstract Introduction Conclusions References Tables Figures ◭ ◮ ◭ ◮ Back Close
Full Screen / Esc
Printer-friendly Version Interactive Discussion (a)
(b)
Fig. 16. Simulated convergences (10−4s−1) at 9Z 26 July. (a) Model simulations: control,
TRMM SST, urban, TRMM SST and urban. (b) Factor separation analyzed values of individual and interaction effect. Positive values (solid contours) represent areas of positive change in convergence, and negative values (dashed contours) represent areas of negative change in convergence. f12=F12−(F1+F2) + F0 (c) Same as (b) but for cross section at 19.15 N.
ACPD
8, 8773–8816, 2008
Mumbai heavy rain
M. Lei et al. Title Page Abstract Introduction Conclusions References Tables Figures ◭ ◮ ◭ ◮ Back Close
Full Screen / Esc
Printer-friendly Version Interactive Discussion
(c)
Fig. 16 Simulated convergences (10 s ) at 9Z 26 July. (a). Model simulations: control,
ACPD
8, 8773–8816, 2008
Mumbai heavy rain
M. Lei et al. Title Page Abstract Introduction Conclusions References Tables Figures ◭ ◮ ◭ ◮ Back Close
Full Screen / Esc
Printer-friendly Version Interactive Discussion
Fig.17 Factor separation analysis for accumulated precipitation (mm).
ACPD
8, 8773–8816, 2008
Mumbai heavy rain
M. Lei et al. Title Page Abstract Introduction Conclusions References Tables Figures ◭ ◮ ◭ ◮ Back Close
Full Screen / Esc
Printer-friendly Version Interactive Discussion
Fig.18 Time series of accumulated precipitation (mm) over Santacruz airport: Control, the Fig. 18. Analysis of the time series accumulated precipitation (mm) over Santacruz airport: the