HAL Id: hal-01907646
https://hal.archives-ouvertes.fr/hal-01907646
Submitted on 29 Oct 2018
HAL is a multi-disciplinary open access
archive for the deposit and dissemination of
sci-entific research documents, whether they are
pub-lished or not. The documents may come from
teaching and research institutions in France or
abroad, or from public or private research centers.
L’archive ouverte pluridisciplinaire HAL, est
destinée au dépôt et à la diffusion de documents
scientifiques de niveau recherche, publiés ou non,
émanant des établissements d’enseignement et de
recherche français ou étrangers, des laboratoires
publics ou privés.
Experiments
Maxime Farin, Anne Mangeney, Julien De rosny, Renaud Toussaint,
Phuong-Thu Trinh
To cite this version:
Maxime Farin, Anne Mangeney, Julien De rosny, Renaud Toussaint, Phuong-Thu Trinh. Link
Be-tween the Dynamics of Granular Flows and the Generated Seismic Signal: Insights From Laboratory
Experiments. Journal of Geophysical Research: Earth Surface, American Geophysical Union/Wiley,
2018, 123 (6), pp.1407-1429. �10.1029/2017JF004296�. �hal-01907646�
Link Between the Dynamics of Granular Flows
and the Generated Seismic Signal: Insights
From Laboratory Experiments
Maxime Farin1 , Anne Mangeney2,3, Julien de Rosny1, Renaud Toussaint4 ,
and Phuong-Thu Trinh5
1Institut Langevin, ESPCI Paris, PSL Research University, CNRS, Paris, France,2Institut de Physique du Globe de Paris, Sorbonne Paris Cité, CNRS (UMR 7154), Paris, France,3ANGE team, CEREMA, Inria, Lab. J.-L. Lions, CNRS, Paris, France, 4Institut de Physique du Globe de Strasbourg/EOST, CNRS, Strasbourg, France,5Total E&P/SEISCOPE/university of Grenoble Alpes
Abstract
Granular column collapse experiments have been conducted on a flat rough surface tilted at various angles with synchronous measurements of the flow dynamics and the emitted seismic signal. Our results show that the ratio of radiated seismic energy to potential energy lost by the granular flows decreases slightly from 0.033% to 0.017% with increasing slope angle on a poly(methyl methacrylate) (acrylic) plate. This is about 90 times lower than for the impact of a single particle of the same diameter. The experimental granular flows generated signals with frequencies lower than 20 kHz, with a mean value around 5 kHz, which are shown to be similar to the frequencies emitted by a single-particle impact. The rise phase and maxima of the amplitude and frequencies of the seismic signals generated by our experimental granular flows are mostly controlled by flow motion in the direction normal to the slope, while their decay phase depends on downslope particle speeds. The granular flow regime changes from dense to more agitated flows above a critical slope angle that is about half the friction angle of the granular material. This change is reflected in (1) the shape of the temporal variation of the seismic amplitude and frequencies, with a decay phase lasting much longer and (2) the shape of the cumulative radiated seismic energy, which changes above the same critical slope angle. Implications of these results for the interpretation of seismic emissions from experimental and natural granular flows are discussed.1. Introduction
Over the last two decades, many studies have attempted to obtain insights into the dynamics of gravita-tional instabilities (e.g., avalanches, landslides, rockfalls, and debris flows) using the seismic signals generated from these events (e.g., Arattano, 2000; Brodsky et al., 2003; Dammeier et al., 2011; Favreau et al., 2010; Hibert, Ekström, et al., 2014; Huang et al., 2007; Kanamori & Given, 1982; Kean et al., 2015; Moretti et al., 2015; Pérez-Guillén et al., 2016; Suriñach et al., 2005; Yamada et al., 2016; Zhao et al., 2015). Defining seismic attributes that can distinguish gravitational flows from other sources, like volcano-tectonic earth-quakes, is crucial for hazard assessment and monitoring in volcanic or seismic environments. This, however, requires an understanding and quantification of the processes at the origin of the generated seismic signal. The high-frequency (>1 Hz) seismic signals recorded at some distance from landslides have a typical cigar shape with an emergent arrival (Dammeier et al., 2011; Hibert et al., 2011; Hibert, Mangeney, et al., 2014; Moretti et al., 2012; Pérez-Guillén et al., 2016; Schneider et al., 2010). Different interpretations have been pro-posed for this characteristic shape. Suriñach et al. (2005) suggested that it can be due to the fact that the mass moves forward, then away from the seismic station, because the amplitude of the emitted signal decays rapidly with distance. In addition, Schneider et al. (2010) and Hibert et al. (2011) observed that this shape is visi-ble on seismic recordings at different distances from the event, which suggests that the amplitude of the signal is directly related to the dynamics of the flow. Hibert, Ekström, et al. (2014, 2017) found that the normalized envelope of the high-frequency seismic signal generated by several large landslides is very similar to the tem-poral evolution of the modulus of the normalized bulk momentum inferred from inversion of the long-period seismic waves. In addition, the maximum of the seismic envelope was observed to be proportional to the maximum bulk momentum (Hibert, Ekström, et al., 2017). Lévy et al. (2015) found similarities between
RESEARCH ARTICLE
10.1029/2017JF004296Key Points:
• We compare the dynamics and the generated seismic signal of experimental granular flows on a rough plane inclined at various angles
• Granular flow seismic efficiency decreases as the slope angle increases and is about 90 times lower than for the impact of a single grain • The shape of the seismic signal
changes after a critical slope angle because the flow regime changes from a dense to a more agitated flow
Correspondence to: M. Farin,
Citation:
Farin, M., Mangeney, A., de Rosny, J., Toussaint, R., & Trinh, P.-T. (2018). Link between the dynamics of gran-ular flows and the generated seismic signal: Insights from laboratory experi-ments. Journal of Geophysical Research:
Earth Surface, 123, 1407–1429.
https://doi.org/10.1029/2017JF004296
Received 24 MAR 2017 Accepted 19 APR 2018
Accepted article online 11 MAY 2018 Published online 21 JUN 2018
©2018. American Geophysical Union. All Rights Reserved.
the time variation of the seismic energy and that of the force simulated for rockfalls over complex topography in Montserrat. Finally, the complex topography of the ground has been shown to also affect the signal ampli-tude and shape (Favreau et al., 2010; Lévy et al., 2015; Yamada et al., 2013). Nevertheless, the seismic signal generated by gravitational events depends on numerous factors, such as particle diameter (Farin et al., 2015; Huang et al., 2004), the presence of abrupt changes in slope angle and topographic irregularities in the bed (Allstadt, 2013; Favreau et al., 2010; Moretti et al., 2015), the presence of an erodible bed (Bachelet et al., 2018; Kean et al., 2015), and propagation of seismic waves in complex heterogeneous media (Aki & Richards, 1980). However, given the lack of direct visual observations of the dynamics of natural granular flows, it has not yet been possible to relate the amplitude of the seismic signal generated by a gravitational event to its dynamic parameters such as its speed or potential energy lost.
Parallel to field investigations, many scaled laboratory experiments of granular flows have been conducted since the 1980s to better understand the dynamics and deposition of landslides (e.g., see reviews; Andreotti et al., 2013; Delannay et al., 2017; GdR Midi, 2004). These experiments include horizontal axisymmetri-cal granular column collapses (e.g., Lajeunesse et al., 2004; Lube et al., 2004; Roche et al., 2011) and 2-D granular collapses in horizontal (Balmforth & Kerswell, 2005; Lacaze & Kerswell, 2009; Lube et al., 2005; Roche et al., 2008, 2013; Siavoshi & Kudrolli, 2005) or inclined flat channels (Dufresne, 2012; Farin et al., 2014; Hogg, 2007; Huang et al., 2004; Lube et al., 2011; Mangeney et al., 2010; Sulpizio et al., 2016). In particular, Mangeney et al. (2010) and Farin et al. (2014) showed the existence of a critical slope angle above which the dynamics of granular flows change dramatically. This change is related to the development of a slow propa-gation phase at the end of the deceleration phase of the flow front, which significantly increases the duration and the runout distance of the flow front as the slope angle approaches the friction angle of the granular material. A key question is whether the seismic signal generated by the flow reflects the change in its dynam-ics and in particular the different regimes experienced by the flowing material. If so, analysis of the signal may provide a key tool to detect these changes and also to better quantify them and understand their origin. Recent laboratory studies have used vibration sensors to monitor seismic and force signals generated by gran-ular flows. For example, Huang et al. (2004) used a piezoelectric hydrophone to show that the mean frequency of the signal of a granular flow decreases when the particle diameter increases. More recently, Hsu et al. (2014) characterized the statistic distribution of fluctuating forces at the base of both dry and saturated granular flows in a rotating drum using force sensors. Farin et al. (2015) and Bachelet et al. (2018) have shown that it is possible to retrieve the mass and speed of individual impactors on various substrates (smooth, rough, or erodible) from the generated seismic signal. However, to our knowledge, no laboratory study has attempted to relate granular flow dynamics to the associated seismic emissions. The advantage of this approach is to control individually all of the granular flow parameters that can have an influence on the generated seismic signal (e.g., particle diameter, released granular volume, bed topography, rough or erodible bed, and elas-tic properties of the propagating media) to better understand the effect of each of these parameters. In this paper, we conduct granular column collapse experiments on a flat, rough plate that is inclined at various angles. Piezoelectric accelerometers are fixed below the plate and record the seismic signal generated by the granular flows. As a starting point, the only parameter varied in these experiments is the slope angle of the flat plate with respect to the horizontal. A uniformly flat slope is somewhat unrealistic in nature, where the slope angle changes abruptly or smoothly, possibly affecting the runout distance, the flow dynamics (e.g., Jessop et al., 2012; Sulpizio et al., 2016) and therefore the generated seismic signal (e.g., Favreau et al., 2010; Lévy et al., 2015). For example, Sulpizio et al. (2016) reported that the ratio of the average slope in the depo-sitional area to that of the upstream channel ranged from 0.26 to 0.45 for hot avalanches at Mount Vesuvius, Italy. They showed experimentally that stronger changes of slope angles (lower ratios) cause shorter runout distances. However, here we would like to separate the effect of flow dynamics from that of complex bed topography (i.e., changes of slope and flow direction) on the generated seismic signal. Consequently, we con-duct experiments on planar surfaces having an uniform slope. Synchronous video recording of the granular flow and measurement of the emitted seismic signal allows us to relate the seismic parameters (amplitude, radiated seismic energy, and frequency) to the flow dynamics. With this simple experimental setup, our pri-mary objective is to answer the following questions: (1) What proportion of the potential energy lost by the granular flow is converted into radiated seismic energy (defined here as the seismic efficiency) and does this amount depend on time or slope angle? (2) How do the seismic efficiencies and frequency content of the signals generated by the experimental granular flows compare with those of natural rockfalls? (3) How do they compare with those of a single-particle impact? (4) Are the amplitude and frequency of the seismic
Figure 1. (a) Schematic of the experimental setup (to scale). The granular column of heighth0= 2.36cm and diameter
D0= 2.95cm is initially contained in a cylinder placed on a flat, rough PMMA plate of thicknesshp= 1cm, inclined at slope angle𝜃. Two accelerometers,A1andA2, are fixed below the plate. When the cylinder is removed, the granular column collapses down the slope and the granular flow generates a plate vibration, which is recorded by the accelerometers. (b) Envelope of the seismic signal measured by the two accelerometers for a granular collapse at slope angles𝜃 = 0∘and𝜃 = 20∘. The amplitude envelope does not depend on the position of the measurement, therefore, the wave field can be considered as diffuse. PMMA = poly(methyl methacrylate).
signal controlled by the speed of the center of mass of the granular flow or by the speed of the flow front? (5) Does the seismic signal reveal any dramatic change in the dynamic regime of granular flows when the slope angle is increased?
After a brief description of the experimental setup in section 2, the dynamic and seismic parameters used in this work are introduced in section 3. The evolution of the seismic signal and its link with granular flow dynam-ics when the slope angle is increased are discussed in section 4. In section 5, we compare our experimental results to seismic observations of natural rockfalls and landslides.
2. Experimental Setup and Preliminary Observations
A cylindrical granular column is released on a flat poly(methyl methacrylate), PMMA, plate of thickness
hp = 1 cm, which is inclined at different constant angles𝜃 = 0∘, 5∘, 10∘, 15∘, and 20∘ with respect to the horizontal (Figure 1a). The column has a mass M ≃ 77.4 g, initial height h0 = 2.36 cm, and initial diameter
D0= 2.95 cm (i.e., an aspect ratio a = h0∕D0= 0.8). The granular mass is composed of steel beads of density 𝜌s= 7,800 kg/m3and diameter d = 2 mm. The PMMA plate is made rough by gluing a layer of the same beads on its surface. The repose friction angle𝛿 of the beads on this plate is estimated to be about 27∘, by measur-ing the angle formed with respect to the horizontal of a pile of beads slowly poured on the rough plate, just after it collapses.
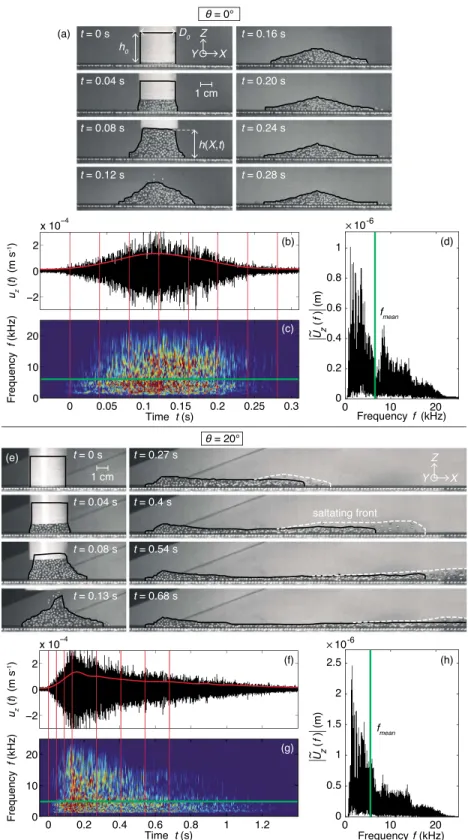
Figure 2. (a and e) Images at successive moments in timetof the granular collapse of a cylindrical column of mass
M = 77.4g, initial heighth0= 2.36cm, initial diameterD0= 2.95cm, aspect ratioa = 0.8and composed of steel beads of diameter 2 mm for slope angle (a)𝜃 = 0∘and (e)𝜃 = 20∘. The contour of the consistent flow is measured from the images (black line). The white dashed line in (e) highlights the saltating front. The black and white lines superimpose when some particles are saltating along the consistent flow in the transverseYdirection. (b and f ) Plate velocity in the normal directionuZ(t)(i.e., seismic signal) generated by the granular collapse. The thick red line is the signal envelope. (c and g) Spectrogram of the seismic signaluZ(t)(normalized scale). The vertical red lines indicate the times the images were obtained. (d and h) Amplitude spectrum| ̃UZ(f )|of the seismic signaluZ(t). The mean frequencyfmeanis indicated by a green line on (c), (d), (g), and (h).
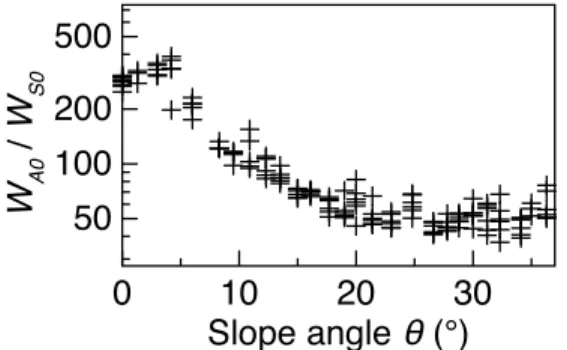
Figure 3. Ratio of the energyWA0of the normal modeA0, measured on the surface of the plate, to the energyWS0of the longitudinal modeS0, measured on the lateral side of the plate, when a particle is dropped from the same height on the plate inclined at different slope angles𝜃with respect to the horizontal. The energy ratioWA0∕WS0is the ratio of the integrals of the squared impact signals measured on the surface and on the lateral side of the plate, respectively.
The granular column is initially contained inside a cylinder and collapses when the cylinder is removed (Figure 1a). Parameters quantifying the flow dynamics (i.e., the flow speed, the potential energy lost, the kinetic energy, and the total energy lost) are determined from the video of the granular flows, recorded using a Photron SA4 camera (500 fps; Figures 2a and 2e). When the plate is horizontal (i.e., for𝜃 = 0∘), the granular column collapse is axisymmetrical (Figure 2a). The granular flow for𝜃 = 20∘ looks similar to that of the horizontal case for t < 0.13 s (Figure 2e). Then a thin layer of particles following a front of saltating particles propagates down the slope. The runout distance increases with the slope angle𝜃.
The plate surface vibration acceleration aZ(t) (i.e., the seismic signal) generated by the granular flows is measured in the direction normal to the plate using two monocomponent piezoelectric accelerometers (type 8309, Brüel & Kjaer) with a flat response between 1 Hz and 54 kHz and an acquisition rate of 500 kHz (Figure 1a). During the granular collapse, the two sensors measure seismic signals with envelopes that have a similar shape and amplitude because the radiated seismic energy is equidis-tributed within the plate over a timescale much shorter than the duration of the flow propagation (Figure 1b). This is further discussed in section 3.2. The measured acceleration signals aZ(t) are then integrated and high-pass filtered above 1,000 Hz (to remove the low-frequency noise resulting from signal integration) to obtain the plate normal vibration speed signals uZ(t) (Figures 2b and 2f ). From the speed signal uZ(t), we determine the seismic parameters that are compared to the dynamic parameters in section 4 (i.e., the seismic envelope, the radiated seismic energy, and the mean frequency).
The spectrogram and amplitude spectrum| ̃UZ(f )| of the vibration speed uZ(t) reveal that most of the radiated seismic energy is between ∼1 kHz and 20 kHz, regardless of the slope angle𝜃 (Figures 2c, 2d, 2g, and 2h). In this frequency range, the thin PMMA plate is only excited by two fundamental modes: the flexural Lamb mode
A0whose displacement is normal to the plane of the plate and the longitudinal mode S0, with displacement in the plane of the plate (Farin et al., 2016; Royer & Dieulesaint, 2000). Higher modes have a cutoff frequency higher than 20 kHz and are thus not recorded here (Royer & Dieulesaint, 2000). We determined the relative energy WS0of the longitudinal mode S0(measured with a sensor on the lateral side of the plate) with respect
to the energy WA0of the normal mode A0(measured with a sensor on the surface of the plate as in Figure 1a)
when a particle impacts the plate with different angles of incidence. The energy ratio WA0∕WS0is the ratio of the integral of the squared signals measured in the lateral and normal directions, respectively (Figure 3). When the angle of incidence increases from 0∘ to 38∘ with respect to the normal to the plate, the energy of mode S0 represents about 0.2% to 2% of the energy of mode A0. Therefore, in the context of our laboratory experiments,
the energy carried by longitudinal waves can be considered negligible and the normal component uZ(t) of the plate vibration speed is sufficient to determine, with a relatively good accuracy, the absolute seismic energy radiated by granular flows.
3. Determination of the Dynamic and Seismic Parameters of the Granular Flows
Let us first define the observables (i.e., the dynamic and seismic parameters determined in each experiment from the video recordings of the granular flows and from the generated plate vibrations uZ(t), respectively). The results and comparisons of these parameters for different slope angles𝜃 are presented in section 4.
3.1. Dynamic Parameters
We estimate the potential energy of a granular flow from the temporal evolution of the thickness profile
h(X, Y, t) of the contour of the granular flow, determined from the video recording of the experiment
(black contours in Figures 2a and 2e). Let (0, X′, Y′, Z′) be the reference frame related to gravity, where X′and Z′are the horizontal and vertical directions, respectively, and Y′is the transverse direction (i.e., over the width).
If (0, X, Y, Z) is the reference frame of the plate (as shown in Figures 1a, 2a, and 2e), we have
X′= X cos𝜃 + Z sin 𝜃, (1)
Z′= −X sin𝜃 + Z cos 𝜃, (2)
where𝜃 is the slope angle. The potential energy is obtained by integrating the bulk energy 𝜌gZ′over the flow volume V Ep(t) =𝜌g ∫ ∫ ∫ V Z′dX′dY′dZ′= 𝜌g ∫X∫Y∫ Z=h(X,Y,t) Z=0
(−X sin𝜃 + Z cos 𝜃)dXdYdZ, (4)
because dX′dY′dZ′= dXdYdZ. Then, by integrating over Z, we obtain Ep(t) =𝜌g ( 1 2∫X∫Y h(X, Y, t)2cos 𝜃dXdY − ∫X∫Y h(X, Y, t)X sin 𝜃dXdY ) . (5)
Since we do not have any image of the flow in the transverse direction Y, the determination of the potential energy is challenging. When the plate is horizontal, Ep(t) can be easily determined using cylindrical coordi-nates because the collapse is axisymmetrical. However, for slope angles𝜃 > 0∘, we assume that the thickness
h(X, Y, t) decreases linearly from the center line of the flow Y = 0 in the Y direction, over a constant width W.
We adjust the value of the width W by equating the energy Ep(t) computed using cylindrical coordinates at the horizontal with that computed with a linearly decreasing thickness over W and obtain W = 1.5D0. This value is assumed to stay the same for𝜃 > 0∘ although it probably decreases as the flow elongates. We may therefore slightly overestimate the potential energy for high slope angles𝜃. Finally,
Ep(t) ≃ 1.5 2 𝜌gD0 ( 1 2∫X h(X, t)2cos 𝜃dX − ∫X h(X, t)X sin 𝜃dX ) . (6)
The potential energy lost during the collapse is then given by
ΔEp(t) = Ep(t = 0) − Ep(t). (7) The density𝜌 of the granular flow is assumed constant and equal to M∕(𝜋D2
0h0∕4) ≃ 4,800 kg/m3during the
collapse, which is a crude approximation given that the front of the flow is clearly less dense than the rear at the end of the propagation (e.g., for t≥ 0.27 s, Figure 2e).
The successive coordinates (XCOM(t), ZCOM(t)) at time t of the center of mass of the flow in the plane (X, Y =0, Z)
are estimated from the contour profiles of the granular flows estimated from the video recordings (Figure 4a). At a given time t, the coordinate XCOM(t) is the average of the thicknesses h(X
i, t) of the flow contour in the X direction, weighted by the positions Xi(Figure 4b)
XCOM(t) = ∑ ih(Xi, t)Xi ∑ iXi . (8)
XCOM(t) does not vary for the horizontal case (i.e., for𝜃 = 0∘) because the granular collapse is axisymmetrical.
Similarly, the coordinate ZCOM(t) is the weighted average along the Z direction of the lengths l(Z
i, t) of the flow contour in the Z direction at time t (Figure 4c)
ZCOM(t) = ∑ il(Zi, t)Zi ∑ iZi . (9)
The time derivatives of the coordinates XCOM(t) and ZCOM(t) give the speeds VCOM
X (t) (in the X direction, down the slope) and VCOM
Z (t) (in the Z direction, toward the plate) of the center of mass, respectively. Then, the bulk kinetic energy of the granular flow is given by
Ec(t) = 1 2M(V COM X (t) 2+ VCOM Z (t) 2). (10)
We also picked the successive coordinates of the front of the granular flow contours Xfront(t) and of their
sum-mit (i.e., maximum flow height) Zsummit(t) (Figure 4) and differentiated these coordinates over time to obtain
the speed of the flow front Vfront(t) and the speed of the summit Vsummit(t). The front speed Vfront(t) is generally
2 to 3 times higher than the speed VCOM
Figure 4. (a) Successive contour profiles at different timest(different colors) of the granular collapse at slope angle
𝜃 = 15∘. The coordinatesXCOM(t)andZCOM(t)of the flow center of mass along theXandZdirections are determined from the weighted integration of the thicknessesh(X, t)and lengthsl(Z, t)of the contours at timest, respectively (Equations (8) and (9). The dots indicate the deduced successive positions of the center of mass as a function of time. The arrows indicate the successive positions of the summit of the columnZsummit(t)(horizontal arrows) and of the front of the granular flowXfront(vertical arrows). (b) CoordinatesXCOMof the center of mass andXfrontof the flow front in the
Xdirection. (c) CoordinatesZCOMof the center of mass andZsummitof the summit of the granular flow in theZdirection
at slope angle𝜃 = 15∘. 3.2. Seismic Parameters
We characterize the seismic signal uZ(t) generated by a granular flow by its envelope Env(t), which is com-puted using the Hilbert transform of uZ(t), as described by equation (2) of Hibert et al. (2011), (Figures 2b and 2f ) and by its duration ts, which we define as the time interval for which the amplitude envelope Env(t) is higher than twice the average absolute noise amplitude. In the frequency domain, we define the mean frequency fmeanby fmean= ∫+∞ 0 | ̃UZ(f )|fdf ∫+∞ 0 | ̃UZ(f )|df , (11)
where| ̃UZ(f )| is the absolute value of the time Fourier transform of the vibration speed uZ(t).
We also determine the amount of lost potential energy ΔEpthat is radiated in the form of seismic waves, as has been done for natural rockfalls and landslides (Deparis et al., 2008; Hibert et al., 2011; Hibert, Malet, et al., 2017; Lévy et al., 2015; Vilajosana et al., 2008). It is important to determine the radiated seismic energy
Welbecause it is often the only energy dissipated by the granular flow that can be measured in the field.
The usual technique to determine the seismic energy Welradiated by granular flows in the field is
sim-ilar to that used for earthquakes in seismology (e.g., Crampin, 1965; Lancieri et al., 2012). It consists of assuming that the granular flow is a point source and integrating the energy flux measured at the seis-mic station over a cylinder of diameter equal to the distance between the granular flow and the station. However, in the laboratory, we cannot assume that the granular flows are point sources of seismicity. Indeed, the seismic waves emitted in the thin plate by the impacts of the particles constituting the flow are reflected many times off the lateral sides of the plate. In addition to the first wave arrival from the impacts, these reflections are also recorded by the accelerometers, which could lead to an overestimation of Wel. It is possible to discard these reflections for a single impact provided that the plate is sufficiently
large (Farin et al., 2016). However, in the current investigation it is impossible to discern each impact in the granular collapse and some impacts occur simultaneously. In fact, the seismic energy radi-ated by the granular flow is rapidly equidistributed within the plate. This is demonstrradi-ated by the vir-tually identical envelopes of the seismic signal measured at two locations on the plate (Figure 1b). This situation is sometimes referred to as a diffuse field (Farin et al., 2016; Weaver, 1985).
A method is presented here to roughly estimate the seismic energy Welradiated by a granular flow on a thin
plate in the laboratory, under diffuse field conditions. We make the strong assumption that the signal of the granular flow is composed of a large number of uncorrelated impulses generated by the impacts of the parti-cles on the plate. If this assumption is true, then the seismic energy Welradiated by a granular flow is the sum of
the energies Wiof the individual impacts over the signal duration ts. This assumption was previously used by Tsai et al. (2012) to determine the seismic power generated by the bedload in rivers. The problem of estimat-ing the seismic energy Welradiated during a granular flow is then simplified to the estimation of the seismic
energy Wiradiated during a single impact on a thin plate in a diffuse field. A technique derived from classical methods used in room acoustics (e.g., Royer & Dieulesaint, 2000) was adapted by Farin et al. (2016) to deter-mine this energy from the plate vibration speed uZ(t) emitted by the impact. According to this method, the seismic energy Wiradiated during the impact is given by
Wi≈𝜌pVpuZi2, (12)
where𝜌pand Vpare the density and volume of the plate, respectively. The parameter uZi2is the amplitude of the squared surface vibration speed at the instant tiof the impact, which can be determined on the basis of the observation that, in a diffuse field, the amplitude of the envelope of the squared signal uZ(t)2generated by an impact decreases exponentially in time with a characteristic time𝜏 (Farin et al., 2016)
uZ(t)2≈ u Zi2exp ( −t − ti 𝜏 ) . (13)
The time𝜏 of energy dissipation is a characteristic of the anelasticity of the plate material and depends on the signal frequency f (Farin et al., 2016). It can be shown that the seismic energy Wel(t) radiated up to time t by the granular flow is given by (see Appendix A for the demonstration)
Wel(t) ≈ 𝜌pVp 𝜏 ∫ t 0 uZ(t′)2dt′, (14)
where uZ(t) is the surface vibration speed measured by the accelerometers during the granular flow (Figures 2b and 2f ). The total seismic energy radiated during the whole experiment is then Wel = Wel(ts), where tsis the duration of the seismic signal.
4. Comparison of the Seismic and Dynamic Parameters
For each granular flow experiment, we use equation (14) to compute the average radiated seismic energy Wel
determined from the plate vibration speed uZ(t) measured by the two accelerometers. For the characteristic time𝜏 in equation (14), we use 𝜏 ≈ 0.09f−1∕2(in units of s) as reported by Farin et al. (2016) for a PMMA plate
of the same thickness, with f = fmean, the mean frequency of the seismic signal. Thus,𝜏 = 1.2 × 10⁻³± 10−4s
in our experiments.
4.1. Description of the Seismic Signal
We first describe how the seismic signal generated by a granular flow changes as the slope angle𝜃 is increased. We do not observe any clear dependence of the envelope Env(t) of the seismic signal on the slope angle𝜃 during the rise phase, until about t = 0.15 s (Figure 5a). The maximum of the amplitude envelope is also similar (∼15 × 10−5± 1.4 × 10⁻⁵m/s) regardless of the slope angle𝜃 and is reached at around the same time t ≃ 0.15 − 0.17 s. After t ≃ 0.2 s, the curves clearly separate as the slope angle 𝜃 is increased (see Figure 5a).
The duration of the decay phase only slightly increases with𝜃 when 𝜃 ≤ 10∘ but significantly increases for
𝜃 > 10∘ and even more so as 𝜃 tends toward the friction angle 𝛿 ≃ 27∘.
Similar to the signal amplitude envelope, the seismic energy Welradiated during the collapse only slightly varies with𝜃 for 𝜃 ≤ 10∘, but significantly increases for 𝜃 > 10∘ (Figure 5b). For 𝜃 ≤ 10∘, about half of the seismic energy Welis radiated during the rise phase, for t < 0.15 s. For 𝜃 = 15∘ and 𝜃 = 20∘, more seismic
Figure 5. (a) Average envelope Env(t)of the measured seismic signals
uZ(t). (b) Cumulative radiated seismic energyWel(t)(equation (14)) of the granular flows for different slope angles𝜃(different colors). The vertical dashed line indicates the approximate time of the maximum of the amplitude envelopes.
4.2. Interpretation of the Slope Angle Dependence
As shown analytically by Tsai et al. (2012), the high-frequency seismic power radiated by the impacts of bedload particles in rivers should be directly proportional to the rate of particle impacts on the ground and to the squared impact speed. Moreover, Farin et al. (2015) showed analytically that the seismic energy Welradiated during a single impact is proportional
to the impactor’s speed to the power of 11∕5 = 2.2 on plates. Addition-ally, Farin (2015) reported that the energy Welradiated during an oblique
impact decreases with the cosine of the impact angle with respect to the normal to the plate. The seismic signal generated by a granular flow should also depend on the rate, speed, and direction of the particle impacts on the bed. Therefore, in this section, we interpret the variations of the seis-mic signal amplitude and frequencies when the inclination angle𝜃 of the plate increases as quantitative indications of a change of particle agitation in the flow (sometimes referred to as granular temperature in the litera-ture, e. g., Andreotti et al., 2013; Delannay et al., 2017) or a change in flow speed and direction.
4.2.1. Conversion of Potential and Total Energy Into Radiated Seismic Energy
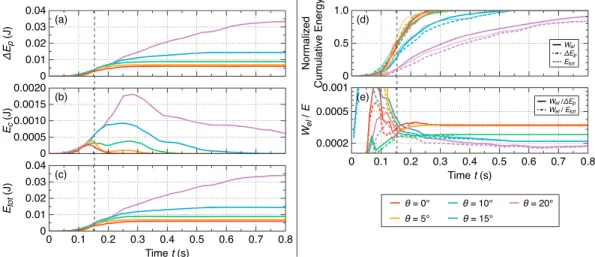
The potential energy lost by the granular flows ΔEp(t) is partly converted into kinetic energy Ec(t) and radiated into seismic waves. The potential and kinetic energy that is not converted to seismic waves is dissipated by viscous and plastic processes through binary impacts (e.g., Farin et al., 2015) and frictional contacts between the particles. Note that the total energy lost Etot(t) = ΔEp(t) + Ec(t) by the granular flows in these experiments is only slightly higher than the poten-tial energy lost ΔEp(t), because bulk kinetic energy Ec(t) is about 1 order of magnitude lower than ΔEp(t) (Figures 6a to 6c).
The profiles of the kinetic energy Ec(t) differ from those of the envelope Env(t) (Figures 5a and 6b). However, the potential energy ΔEp(t) and the total energy lost Etot(t) exhibit a time variation similar to that of the
radi-ated seismic energy Wel(t) during the granular collapse, with no clear dependence on the slope angle𝜃 up
to about t = 0.15 s, followed by a stronger increase for 𝜃 ≥ 15∘ (Figures 5b, 6a, and 6c). For each of the slope angles, the cumulative normalized energies Wel(t), ΔEp(t) and Etot(t) match well (Figure 6d). The shapes of the normalized energy curves are however different for low and high slope angles𝜃 ≥ 15∘, which suggests that the energy is dissipated differently, with a critical slope angle between 10∘ and 15∘ (i.e., around half the
Figure 6. (a) Potential energy lostΔEp(t)(equation (7)), (b) Bulk kinetic energyEc(t)(equation (7)), (c) Total energy lost
Etot(t) = ΔEp(t) + Ec(t), (d) Cumulative radiated seismic energyWel(t)compared with cumulative potential energy lost
ΔEp(t)and total energy lostEtot(t), normalized by their maximum values, (e) Ratio ofWel(t)over potential energy lost
and total energy lost for the granular flows at different slope angles𝜃(different colors). The vertical dashed line indicates the approximate time of the maximum of the amplitude envelopes.
Figure 7. Comparison of (a) the seismic envelope Env(t)as shown in Figure 5a with (b) to (d) the flow dynamics for different slope angles𝜃(different colors). (b) Speed of the center of massVXCOM(t)andVZCOM(t), in theXandZ
directions, respectively. (c) Speed of the flow frontVfront(t)(Xdirection) and of the column summitVsummit(t)
(Zdirection). (d) Estimated cross-sectional area of the saltating front. The vertical dashed line indicates the approximate time of the maximum of the amplitude envelopes.
friction angle𝛿 = 27∘ of the beads). Note that the shape of the cumulative radiated seismic energy Wel(t) matches slightly better with the cumulative total energy Etot(t) than with the cumulative potential energy lost ΔEp(t). The same observations can be made for the radiated seismic power and the total power lost (see Appendix B). This suggests that the seismic energy radiated by granular flows should be proportional to the total dissipated energy.
The ratios of the radiated seismic energy over the potential energy lost Wel∕ΔEpand over total energy lost
Wel∕Etotdo not appear to be constant with time and are larger in the rise phase than in the decay phase in
some experiments, for𝜃 = 0∘, 𝜃 = 5∘, 𝜃 = 20∘ (Figure 6e). In these experiments, we may underestimate the potential and total energy lost when the cylinder is removed for t< 0.1 s because some particles are entrained upward (Figures 2a and 2e). Moreover, both lost and radiated energies are small in the rise phase, which leads to a larger error on the ratios. However, it is clear that the final ratios Wel∕ΔEpand Wel∕Etotdecrease as the
slope angle𝜃 is increased, from 3.3 × 10⁻⁴for𝜃 = 0∘ to 1.7 × 10⁻⁴for𝜃 = 20∘ (Figure 6e). An explanation
for this observation could be that the flow potential energy is more efficiently radiated in the form of elastic waves when impacts of particles are normal to the plate at low slope angles than when impacts are more tangential to the plate for high slope angles (Bachelet et al., 2018; Farin, 2015).
4.2.2. Interpretation of the Temporal Variation of the Signal Amplitude
We now interpret the variation of the seismic amplitude envelope Env(t) as a function of time t when the slope angle𝜃 of the plate is increased (Figure 7a). In the rise phase, for t < 0.15 s, the rate, speed, and direction of particle impacts on the plate, and consequently the amplitude of the seismic signal, should not be strongly affected by increasing slope angle𝜃 because the initial driving force of the flow is controlled by the pressure gradient (Farin et al., 2014; Mangeney-Castelnau, 2003). Indeed, the pressure gradient only depends on the initial shape or height h0of the granular column (which is constant in these experiments) and not on the slope angle𝜃. Until the seismic amplitude reaches its maximum for t = 0.15 s, it seems more related to flow motion in the Z direction than to motion in the X direction (Figures 7a to 7c). Indeed, the speeds VCOM
Z (t) and Vsummit(t)
in the Z direction do not vary significantly as𝜃 is increased. The same is true for the signal envelope Env(t). Moreover, their maxima roughly coincide at t ≃ 0.15 s, probably because both the rate and speed of particle
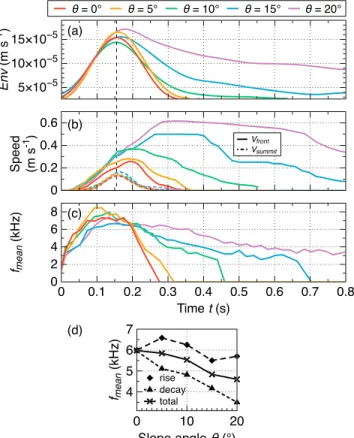
Figure 8. (a) Seismic envelope Env(t)as shown in Figure 5a. (b) Speed of the flow frontVfront(t)(Xdirection) and of the column summitVsummit(t)(Zdirection) as shown in Figure 7c. (c) Mean frequencyfmean(t)(equation (11)) measured for successive time periods in the seismic signal, for different slope angles𝜃(different colors). (d) Mean frequencyfmean
computed in the rise and decay phases and for the total seismic signal as a function of the slope angle𝜃. The vertical dashed line indicates the approximate time of the maximum of the amplitude envelopes.
impacts on the bed in the normal direction are maximized at this time. On the other hand, the maxima of the speeds VCOM
X (t) and Vfront(t) in the X direction are reached later than those of the amplitude envelopes Env(t),
between t ≃ 0.2 s and t ≃ 0.28 s, and clearly increase with 𝜃 (Figures 7a to 7c).
After t = 0.15 s, in the decay phase, the speed in the Z direction decreases rapidly and the motion stops around
t = 0.3 s, regardless of 𝜃 (Figures 7b and 7c). Therefore, the motion in the X direction has a larger influence on
the seismic signal. In addition, a dilute and agitated front of 1–2 layers of saltating particles starts to develop at the flow head in the decay phase for high slope angles𝜃 ≥ 10∘ (Figure 2e). Both the size and duration of the saltating front significantly increase as the slope angle𝜃 is increased (Figure 7d). This suggests stronger particle agitation, leading to slightly higher speeds VZin the Z direction of the individual particles in the flow front. For example, from the videos, we measured VZ≃ 0.19±0.05 m s−1for𝜃 = 15∘ and VZ≃ 0.27±0.05 m s−1 for𝜃 = 20∘. Because both flow speed in the X direction and individual particle speed in the Z direction increase in the decay phase when the slope angle𝜃 is increased, so does the seismic amplitude (Figure 7a).
The significantly longer decay of the amplitude envelope Env(t) for𝜃 ≥ 15∘ (Figure 7a) and the change of shape of the normalized energy curves between𝜃 = 10∘ and 𝜃 = 15∘ (Figure 6d) seem to be related to a change in the dynamics of the granular flow, from a dense granular flow toward a possibly more dilute and agitated flow with a saltating front (Figure 7d). These observations thus suggest that it is possible to detect, in the generated seismic signal, variations in granular flow dynamics when the slope angle𝜃 is increased. Inter-estingly, the dynamic regime of the 2-D confined granular flow experiments conducted by Mangeney et al. (2010) and Farin et al. (2014) changes after about the same critical angle, between𝜃 = 10∘ and 𝜃 = 16∘, with the appearance of a slow propagation phase. However, note that the regime observed here is differ-ent from a slow propagation phase, because a slow propagation phase resembles a steady uniform flow,
Table 1
Comparison of the Ratio of the Mean FrequencyfmeanWith the Ratio of Front
SpeedVfrontto the Power of1∕5for𝜃 = 15∘and𝜃 = 20∘and Different Timest t(s) fmean(15∘)/fmean(20∘) [Vfront(15∘)/Vfront(20∘)]1∕5
0.45 0.72 0.92
0.5 0.7 0.8
0.55 0.75 0.85
0.6 0.77 0.85
0.65 0.74 0.84
with a small and constant propagation speed, less than 25% of the maximum speed (e.g., see Figure 7 of Farin et al., 2014). In contrast, in the present experiments, the flow speed is still high in the deceleration phase and does not tend as clearly toward a constant value (Figure 7c).
4.2.3. Variation of the Signal Mean Frequency With Slope Angle
Similar to the signal amplitude envelope Env(t), the mean frequency fmeanof the seismic signal does not
seem to clearly depend on slope angle𝜃 for t < 0.2 s (within the error bar of ±500 Hz) and decreases less rapidly during the decay phase when the slope angle𝜃 is increased (Figures 8a and 8c). This similarity could be explained by the fact that both the seismic amplitude and the mean frequency increase with the speed of the particles. Farin et al. (2015) showed that the mean frequency of the seismic signal generated by a single impact is inversely proportional to the duration of the impact. According to Hertz’s theory of elastic impact, this duration can be written
Tc≃ 2.87 ( m2 RE∗2V Z )1∕5 , (15)
where m, R, and VZare the impactor’s mass, radius and impact speed in the Z direction, respectively, and E∗is an elastic modulus given by 1∕E∗= (1 −𝜈2
i)∕Ei+ (1 −𝜈g2)∕Eg, where𝜈iand𝜈gare Poisson’s ratios, and Eiand Eg are Young’s moduli for the impactor and the ground, respectively (Johnson, 1985). The mean frequency of the signal of an impact is therefore proportional to the impact speed VZto the power 1∕5. If we assume that the particle impacts in the granular flow are uncorrelated, then the sum of the impacts should not affect the shape of the amplitude spectrum of the impact forces (Tsai et al., 2012). Consequently, the mean frequency fmeanof
the signal generated by a granular flow should also increase with particle speeds. For example, for t between 0.45 s and 0.65 s, when the saltating front is developed, the ratio of front speeds Vfrontto the power of 1∕5 between𝜃 = 15∘ and 𝜃 = 20∘ is ∼0.85 ± 0.05 and the ratio of mean frequencies fmeanis ∼0.75 ± 0.05, which are similar (see Table 1 and Figures 8b and 8c). Thus, the frequency fmeandoes not significantly depend on the slope angle𝜃 for t < 0.2 s, probably because the particle speeds do not vary much before this time when
𝜃 is increased.
The mean frequency fmean = 6 ± 0.5 kHz in the rise phase does not depend on the slope angle 𝜃, but it clearly decreases as𝜃 is increased in the decay phase (Figure 8d). Indeed, the decay phase contains mostly low frequencies (typically<5 kHz) and lasts longer at high slope angles (Figure 8c). As a consequence, the mean frequency fmeanmeasured for the total seismic signal decreases as𝜃 is increased (Figures 8c and 8d).
5. Comparison With Natural Granular Flows
In this section, we compare the results of our laboratory experiments to what has been observed for natural granular flows and interpret the differences.
5.1. Comparison Between Granular Flow Dynamics and Seismic Signal
The spectrogram of the experimental granular flows has a cigar shape with an emergent onset, as observed for rockfalls, rock avalanches, and landslides in the field (e.g., Dammeier et al., 2011; Hibert et al., 2011; Hibert, Mangeney, et al., 2014; Hibert, Mangeney, et al., 2017; Moretti et al., 2012; Schneider et al., 2010) (Figures 2c and 2g). It is much more elongated for high slope angles𝜃. The fact that the decay phase of the seismic amplitude lasts longer than the rise phase may thus be an indication that the landslide is propagating on a steep slope in the field. However, this observation may only apply to simple slope configurations with an approximately constant slope angle because the shape of the seismic signal generated by granular flows
also depends on bed topography (Favreau et al., 2010; Lévy et al., 2015). In addition, as opposed to our simple laboratory case, the slope angle in the field often varies greatly along the path of the landslide from steep slopes close to the summit to more gentle slope angles in the runout area, which could change the flow duration and runout distance compared to those that would be observed on a slope with a constant angle (e.g., Sulpizio et al., 2016, and references therein). Extrapolating the slope angle from the shape of the recorded seismic signal may therefore be difficult in the field.
Recently, Hibert, Ekström, et al. (2017) investigated the high-frequency (3–10 Hz) seismic signals emitted by 12 large landslides of masses from 2 × 10⁹kg to 1.3 × 10¹¹kg in various geological contexts. They reported
a quantitative correlation between the maximum amplitude of the seismic envelope Env(t) and the maxi-mum flow momentum|MVX|, where M is the total mass of the flow and VXthe bulk speed of the center of mass in the X direction. In contrast, we observed here that the maximum amplitude of the seismic envelope
Env(t) does not correspond to the maximum of the speed of the granular flow in the X direction, but rather
to the maximum of speed in the Z direction (Figures 7a to 7c). The rise phase in the laboratory seismic signals may be different from what is observed in the field because, during flow initiation in the field, the cohesive granular mass is fractured into smaller particles. We find another indication that the rise phase is different for experimental and natural granular flows when we compare their durations in terms of the characteristic flow duration𝜏c =
√
h0∕(g cos𝜃) (Mangeney et al., 2010). In the laboratory, with h0 ≃ 2 cm and𝜃 = 0∘ –20∘, 𝜏c ≃ 0.05 s, and the rise phase lasts approximately 3𝜏c, which is in agreement with previous larger-scale granular flow experiments (e.g., Farin et al., 2014; Mangeney et al., 2010). On the other hand, in the field, exam-ples of values in the crater of Piton de la Fournaise volcano (Hibert et al., 2011) are h0= 10 m and𝜃 = 35∘, thus
𝜏c≃ 1 s and the rise phase lasts ∼10𝜏c> 3𝜏c. Therefore, for future studies, it may be more relevant to compare seismic signal generation by granular flow between laboratory, model, and field observations during the propagation of the flow, rather than during the initiation and stopping phases. More work is also needed to understand how the change of slope angle along the runout path of the granular flow affects the generated seismic signal (Favreau et al., 2010; Lévy et al., 2015).
5.2. Characteristic Frequencies of the Signals Generated by Impacts and Granular Flows
The high-frequency (>1 Hz) seismic signal generated by granular flows is thought to be due to the multiple impacts of the particles on the bed. We recorded the signal generated by the impact of a single steel bead of diameter 2 mm on the rough PMMA plate (Figure 9a). The generated frequencies range between 1 kHz and 18 kHz, with a mean frequency fmean≈ 5.6 kHz (Figure 9b), which is similar to that of the signal generated by
the granular flows (Figure 8c). Huang et al. (2007) also observed that the seismic signal generated by a debris flow has frequencies (from 10 Hz to 100 Hz) similar to that of the signal generated by the impact of a single particle (from 10 Hz to 150 Hz) at the same distance from the seismic station. In addition, Helmstetter and Garambois (2010) measured signal frequencies in the same range, from 1 Hz up to 100 Hz, and with an energy peak of around 10–20 Hz, for impacts of a single rock and for rockfalls of several hundreds of cubic meters involving many rocks. As stated earlier, if the impacts of particles are uncorrelated, the shape of the amplitude spectrum should not change from that of a single impact (Tsai et al., 2012). In this case, the frequency of the signal generated by a granular flow should be similar to that generated by a single impact. Lower frequencies may be observed in dense granular flows because of the presence of longer particle contacts that during collisions, for example, chains of forces (e.g., Estep & Dufek, 2012), could increase the duration of the particle impacts compared to the case of a single particle bouncing down the slope. We therefore deduce that the frequencies of the signal emitted by an impact provide an upper bound for the frequencies generated by a granular flow composed of particles of the same size.
In our impact and granular flow experiments, we record higher signal frequencies, between 1 kHz and 20 kHz, than those recorded in the field for block impacts and natural rockfalls, landslides, and debris flows, which are typically between 1 Hz and 150 Hz (e.g., Dammeier et al., 2011; Deparis et al., 2008; Farin et al., 2015; Helmstetter & Garambois, 2010; Hibert et al., 2011; Hibert, Malet, et al., 2017; Huang et al., 2007; Vilajosana et al., 2008). This difference can be explained by the fact that the typical duration Tcof particle impacts (equation (15)) is shorter in the laboratory than in the field. Indeed, the characteristic frequency fcof the generated seismic signal is inversely proportional to the duration Tcof the impact (Farin et al., 2015). In the laboratory experiments, the elastic parameters of PMMA and steel materials lead to a characteristic frequency
fc∼ 1∕Tc≃ 15 kHz for particles of typical radius R ∼ 1 mm (Table 2). This theoretical estimate is close to the frequency fmean ≃ 13 kHz we measure in our experiments for an impact on the smooth surface of the plate
Figure 9. (a) Seismic signaluZ(t)generated atr = 10cm from an impact of a 2-mm steel bead dropped from height
h = 15cm on the smooth PMMA plate (thin blue line) and on the same plate after the surface was made rough by gluing a layer of particles on its surface (thick red line). (b) Amplitude spectrum| ̃UZ(f )|corresponding to the seismic signal recorded on the smooth and rough plates. The dashed vertical lines represent the mean frequencyfmeanof the amplitude spectrum. PMMA = poly(methyl methacrylate).
elastic modulus is E∗ ≃ 107Pa (Geotechdata.info, 2013). Impactor diameters can also be of the order of
millimeters in the field, but impacts of these particles do not radiate sufficient seismic energy to be detected by the seismic stations. Only impacts of larger blocks (0.1–1 m) are detected and, combined with the lower values of E∗, we estimate that these impacts generate low characteristic frequencies f
c ∼ 1∕Tcfrom 1 Hz to 130 Hz (for typical rock parameters, see Table 2), in agreement with the frequencies observed in the field. Hertz’s duration of impact Tcis therefore a good characteristic time to use to upscale the frequency fc∼ 1∕Tc of seismic signals generated by granular flows measured in the laboratory to those measured in the field. This approach, however, can be imprecise because the frequencies of the seismic signal emitted by an impact also strongly depend on the roughness of the ground, which is not taken into account in Hertz’s expression of the impact time Tc(equation (15)). For example, when we drop a steel bead on the smooth PMMA plate (without the layer of steel beads glued on its surface), the mean frequency of the emitted signal is more than 2 times higher (fmean ≃ 13 kHz, blue line in Figure 9b) than when the particle impacts the rough bed
Table 2
Comparison of Characteristic Time and Frequency in the Laboratory and in the Fielda
Parameter Laboratory Field
E∗(Pa) 109 107 𝜌s(m3/kg3) 7,800 2,000–3,000 R(m) 10−3 0.1–1 VZ(m/s1) 1 1–10 Tc(s) 6.7 × 10⁻⁵ 8 × 10⁻³to 1 fc(Hz) 15,000 1–130
aComparison of the theoretical characteristic frequencyf
c= 1∕Tc, where Tcis the Hertz duration of the impact (equation (15)), of the signal
gener-ated by an impact in the laboratory and in the field.E∗is the equivalent
Young’s modulus and𝜌s,R, andVZare the impactor density, radius, and
(fmean≃ 5.6 kHz, red line in Figure 9b). In the field, the measured mean frequency fmeanshould also decrease as the distance between the seismic source and the seismic station increases because high-frequency energy attenuates more rapidly than low-frequency energy in heterogeneous media (Aki & Richards, 1980).
5.3. Seismic Efficiency and Scaling Laws of Granular Flows
We now compare the seismic efficiency (ratio of radiated seismic energy Welto potential energy lost ΔEp) of a single impact with that of a granular flow in the laboratory. We determined the seismic energy Welradiated
during the impact of a single 2-mm steel bead dropped from height h = 21 cm on the same rough PMMA plate as in the granular flow experiments from the integral of the energy flux recorded at the sensor, similar to what is done in the field (Farin et al., 2015; Hibert et al., 2011; Vilajosana et al., 2008) and in the impact experiments of Farin et al. (2015)
Wel= ∫ +∞ 0
2rhp𝜌pvg(𝜔)| ̃UZ(r, 𝜔)|2exp(𝛾(𝜔)r)d𝜔, (16) where ̃UZ(r, 𝜔) is the Fourier transform of the first wave arrival uZ(t), recorded by the sensors before the return of the reflections off the plate side boundaries (shown in Figure 9), r = 10 cm is the distance between the sensor and the impact, hp= 1 cm is the plate thickness,𝜌p= 1,180 kg/m3is the plate density,𝜔 = 2𝜋f is the circular frequency, vg(𝜔) is the group speed, and 𝛾(𝜔) is the characteristic coefficient for anelastic attenuation of energy with distance (in units of m−1). Farin et al. (2016) determined, for a PMMA plate, v
g(𝜔) ≃ 11.7 √
fm/s and𝛾(𝜔) ≃ 1 m−1for kh< 1 and v
g(𝜔) ≃ 1,400 m/s and 𝛾(𝜔) = 4.8 × 10⁻³f2∕3m−1for kh> 1, where k is the wave number. Note that the calculation of the radiated seismic energy Welin equation (16) is carried out
in the frequency domain, while calculations are usually made in time domain in the field (Hibert et al., 2011; Vilajosana et al., 2008); however, this is equivalent due to Parseval’s Theorem. We obtain Wel ≃ 2.7 × 10⁻⁶J
for the seismic energy radiated by a single-particle impact on the rough PMMA plate. The potential energy lost during the impact is ΔEp= (1−e2)mgh ≃ 9×10⁻⁵J, with m, the mass of the particle and e ≃ 0.4, the coefficient of restitution. Thus, for one particle impact on the rough plate, the seismic efficiency is Wel∕ΔEp≃ 0.03. At the same slope angle𝜃 = 0∘, the seismic efficiency is Wel∕ΔEp≃ 3.3 × 10⁻⁴for a granular flow composed of the
same particles (Figure 6e). A granular flow is then about 90 times less seismically efficient than a single impact. In order to interpret the difference in transmission of seismic energy for the impact of a single particle versus a granular flow, we detail the energy budget during an impact. The proportion of the initial potential energy of the particle, Ep, which is not returned to the particle for its rebound or rotation modes (E′p) is either radiated in the form of seismic waves in the plate (Wel), dissipated by a viscoelastic process (heat loss) in the vicinity
of the impact (Wvisc; Falcon et al., 1998) or lost in irreversible fracturing of the impactor or of the bed surface
(Wplast; Davies, 1949). The potential energy lost by the particle at impact is then:
ΔEp= Ep− E′p= Wel+ Wvisc+ Wplast. (17) The only energy that we can measure in the present experiments is the radiated seismic energy Wel, which depends, in part, on other sources of loss. For example, for a given loss of potential energy ΔEp, the more energy that is spent in irreversible deformation on a rough surface (Wplast), the less that is available for trans-mission as elastic waves (Wel). Because of particle collisions and friction in granular flows, a larger proportion of the potential energy loss ΔEpis expected to be dissipated within the flow by inelastic processes, resulting in a smaller amount of radiated seismic energy (Wel) compared to the impact of a single particle dropped on
the bed. Our measurements of seismic efficiency (Wel∕ΔEp) on the rough PMMA plate at a 0∘ slope indicate that inelastic processes account for about 99.967% of the potential energy that is lost during a granular flow, compared to 97% for the impact of a single grain, as reported above. Note that these values should change if different plate and impactor materials or different particle diameters are used because these parameters critically affect the seismic efficiency for particle impacts (Farin et al., 2016).
Only a few measurements of the seismic efficiency Wel∕ΔEpof rock impacts and granular flows exist in the literature and no study has compared the seismic efficiency for single particle impacts and granular flows at the same site. From site to site, the reported ratios Wel∕ΔEpvary over several orders of magnitude from 10−6 to 0.25 (Deparis et al., 2008; Farin et al., 2015; Hibert et al., 2011; Hibert, Malet, et al., 2017; Lévy et al., 2015; Vilajosana et al., 2008). In the present laboratory experiments, we observed that the seismic efficiency Wel∕ΔEp of a granular flow decays by a factor of 2, from 3.3 × 10⁻⁴to 1.7 × 10⁻⁴, when slope angle𝜃 is increased
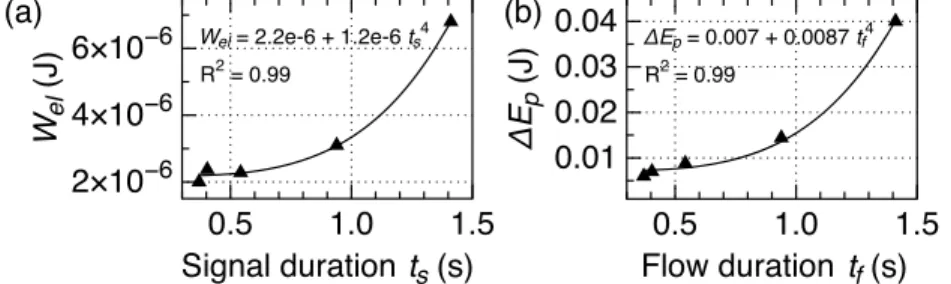
Figure 10. (a) Radiated seismic energyWelas a function of the signal durationts. (b) Potential energy lostΔEpas a
function of the flow durationtf.
from 0∘ to 20∘ (Figure 6e). This factor of 2 can only explain a very small part of the range of seismic efficiencies observed in the field. Another cause of uncertainty in the ratio Wel∕ΔEpcould come from the uncertainty in the elastic parameters of the ground, for example, the density𝜌pand the wave speed vg, that are present in the calculation of Wel(equation (16)). However, the major cause of the discrepancy of the seismic efficiency Wel∕ΔEpin the field is likely the roughness of the contact between the impactor and the ground. For example, for an impact on the smooth surface of the PMMA plate, we determine a seismic efficiency Wel∕ΔEp ≃ 0.26 (using equation (16) with the signal shown in Figure 9), which is about 10 times larger than that measured when the plate is covered with a layer of beads glued on its surface (Wel∕ΔEp≃ 0.03). The measured seismic power is 10 times lower when the particle impacts the rough bed probably because some of the energy radi-ated at impact propagates in the glued particles and is not transmitted to the plate or because more energy is lost in deformation on the rough bed [Wplastin the budget equation (17)]. Similarly, Farin et al. (2015) noted
that the seismic efficiency Wel∕ΔEpmeasured for single-boulder impacts (from 300 kg to 4,800 kg) on a hard basalt slope in Tahiti, French Polynesia, was on the average 1 order of magnitude larger (10−2) for impacts
of rock blocks on bedrock than for impacts on loose sediment (10−3). The seismic efficiencies measured for
these boulder impacts (Wel∕ΔEp≃ 10−4–10−1) are several orders of magnitude larger than that estimated by Hibert, Malet, et al. (2017) for impacts of boulders of similar sizes, ranging from 76 kg to 472 kg, on soft black marls in the French Alps (Wel∕ΔEp≃ 10−6). Kean et al. (2015) observed that the seismic power radiated by a debris flow propagating on a thin layer of sediment was about 2 orders of magnitude lower than for a debris flow of similar characteristics propagating directly on bedrock. Similarly, Pérez-Guillén et al. (2016) also mea-sured a decrease by 2 orders of magnitude of the seismic energy radiated by snow avalanches when the thickness of the snow cover above the bed increased from 0 m to 4 m. These field observations are in good agreement with what was found at the laboratory scale by Bachelet et al. (2018), who reported a decrease of 2 orders of magnitude of the seismic efficiency for a particle impact on a rough surface compared to the same impact on an erodible bed with a thickness of 10 particle diameters. More generally, they found that the seismic energy radiated by a particle impact decreased exponentially as the thickness of the erodible bed increased. In conclusion, the several orders of magnitude variation in seismic efficiency that have been observed in the field may predominately reflect the state of the bed on which the granular flow propagates (smooth, rough, or erodible). In our experiments, seismic efficiency is much less affected by variation of the slope angle (causing only a factor of 2 change in efficiency over the range of slopes examined). That said, the effect of particle diameter, flow mass, and initial aspect ratio on the seismic efficiency Wel∕ΔEpwarrants further investigation.
Interestingly, we observe that the seismic energy Welradiated by granular flows increases with the fourth
power of the duration tsof the seismic signal (i.e., t4s) and the potential energy lost ΔEpduring the granular collapse scales with the fourth power of the duration tfof the flow (i.e., tf4; Figures 10a and 10b). The seismic signal generated by the granular flow is comprised between the seismic signals generated by the first and the last particle impacts in the flow. Before and after these impacts, we can reasonably assume that the particles are not moving, with an accuracy of a few milliseconds. In addition, the duration of the coda of the signal gen-erated by the last impact on the PMMA plate is at most a few milliseconds (see Figure 5c of ; Farin et al., 2015), which is negligible compared to the duration of the granular flows, from several tenths of seconds to several seconds (Figures 2b and 2f ). Consequently, we can consider that the duration of the recorded seismic signal
tsis equal to the duration tfof the granular flow with an accuracy of a few milliseconds (<1% of the flow dura-tion). It is also generally accepted that ts ≃ tffor granular flows in the field if the seismic signal is recorded close to the event because the duration of the coda due to scattering in the ground is negligible compared
to the flow duration (Dammeier et al., 2011; Deparis et al., 2008; Hibert et al., 2011; Vilajosana et al., 2008; see also Figure 2 of Hibert, Mangeney, et al., 2017). Thus, both the increase of the radiated seismic energy Weland the potential energy lost ΔEpwhen the slope angle𝜃 is increased are due to an increase in the flow duration
tf. This scaling law with the fourth power of flow duration tf was predicted analytically by Hibert (2012) for a granular collapse on a flat inclined plane. In the field, because the slope angle decreases during flow prop-agation, the radiated seismic energy Welis observed to vary with signal duration tsto the power of between 1.3 and 2.7 (Hibert et al., 2011; Lévy et al., 2015).
6. Conclusions
We have conducted simple granular column collapse experiments on a flat PMMA plane inclined at various angles with simultaneous measurements of the flow dynamics and of the generated seismic signal. We made some strong assumptions (constant flow width and density and uncorrelated impacts) to be able to determine the potential energy lost and the radiated seismic energy during the granular flows. Nevertheless, we expect the uncertainties on the determined energies to be less than an order of magnitude. We will now address the questions posed in section 1.
1. Seismic efficiency (the proportion of lost potential energy that is converted into radiated seismic energy) exhibited a twofold decrease (from 0.033% to 0.017%) as slope angle increased from 0∘ to 20∘ in our exper-iments. The dependence on the slope angle is probably due to the fact that particle impacts are directed more normally to the slope, and thus more seismically efficient, at small slope angles. Although seismic efficiency did not vary in time during the granular flow, we note that efficiency is expected to vary with differences in particle diameter and material composition of both the particles and the PMMA plate, as demonstrated by single-grain impacts (Farin et al., 2016).
2. The decrease in seismic efficiency with increased slope may partially explain the scatter in seismic efficien-cies observed in field studies of landslides (10−6to 0.25) because field slopes may not be well constrained
and can vary along runout paths. However, we also observed that the seismic efficiency is about 10 times lower for a particle impact on a rough surface than on a smooth surface and deduced that the seismic effi-ciency of granular flows mostly depends on the state of the bed on which the flow propagates (smooth, rough, or erodible). The signal frequencies generated by the experimental granular flows are 100 to 1,000 times higher than those recorded for natural events. We theoretically accounted for this difference by com-puting, for the laboratory experiments and the field, a characteristic signal frequency defined as the inverse of the duration of impact predicted by Hertz’s model (Hertz, 1882). We concluded that Hertz’s impact dura-tion is an appropriate characteristic time for upscaling the frequencies of seismic signals recorded in the laboratory to those observed in the field.
3. In our experiments, the seismic efficiency of granular flows was about 90 times lower than for the impact of a single particle for material of the same diameter, suggesting that granular flows lose more potential energy in inelastic processes, such as viscous dissipation and irreversible deformation of the particles or the ground (with inelastic processes accounting for ∼99.967% of the lost potential energy in our granular flow experiments compared to ∼97% for the impact of a single particle). The frequencies of the signal emitted by our granular flows were below 20 kHz, with a mean around 5 kHz, which is similar to that measured for the impact of a single particle of the same kind as the ones used in the granular flows. To estimate the frequency range that would be generated by a granular flow at a given site, one could drop rock blocks on the expected path of the landslide and determine the frequency content of the generated impulse signals. The sampling frequency used to monitor the subsequent granular flows should then be at least 2 times the maximum frequency emitted by the impacts of the rock blocks, taking into account the Nyquist-Shannon sampling theorem.
4. We do not observe any correlation in time and amplitude between the maximum of the seismic envelope generated by the granular flows and the maximum speed of the flow center of mass (nor of the flow front) in the downslope direction, in contrast with what was reported recently by Hibert, Ekström, et al. (2017) for large natural landslides. The reason for this difference may be that the initiation and stopping phases of the granular flows in the experiments are different than those for granular flows in the field. In the experiments, the granular mass is released suddenly when the reservoir containing the particles is removed and propa-gates on a slope of constant inclination until friction overcomes gravity. In contrast, in the field, a granular flow is initiated when a consistent mass is destabilized and collapses into pieces, often stopping when the