HAL Id: hal-00295398
https://hal.archives-ouvertes.fr/hal-00295398
Submitted on 13 Feb 2004
HAL is a multi-disciplinary open access
archive for the deposit and dissemination of
sci-entific research documents, whether they are
pub-lished or not. The documents may come from
teaching and research institutions in France or
abroad, or from public or private research centers.
L’archive ouverte pluridisciplinaire HAL, est
destinée au dépôt et à la diffusion de documents
scientifiques de niveau recherche, publiés ou non,
émanant des établissements d’enseignement et de
recherche français ou étrangers, des laboratoires
publics ou privés.
measurements at urban,near-city and rural level in the
Copenhagen area and Southern Sweden
M. Ketzel, P. Wåhlin, A. Kristensson, E. Swietlicki, R. Berkowicz, O. J.
Nielsen, F. Palmgren
To cite this version:
M. Ketzel, P. Wåhlin, A. Kristensson, E. Swietlicki, R. Berkowicz, et al.. Particle size distribution and
particle mass measurements at urban,near-city and rural level in the Copenhagen area and Southern
Sweden. Atmospheric Chemistry and Physics, European Geosciences Union, 2004, 4 (1), pp.281-292.
�hal-00295398�
SRef-ID: 1680-7324/acp/2004-4-281
Chemistry
and Physics
Particle size distribution and particle mass measurements at urban,
near-city and rural level in the Copenhagen area and Southern
Sweden
M. Ketzel1,2, P. W˚ahlin1, A. Kristensson2, E. Swietlicki2, R. Berkowicz1, O. J. Nielsen3, and F. Palmgren1
1Department of Atmospheric Environment, National Environmental Research Institute, Roskilde, Denmark 2Division of Nuclear Physics, Physics Department, Lund University, Lund, Sweden
3Department of Chemistry, University of Copenhagen, Denmark
Received: 17 September 2003 – Published in Atmos. Chem. Phys. Discuss.: 3 November 2003 Revised: 3 February 2004 – Accepted: 4 February 2004 – Published: 13 February 2004
Abstract. Particle size distribution (size-range 3–900 nm)
and PM10 was measured simultaneously at an urban back-ground station in Copenhagen, a near-city backback-ground and a rural location during a period in September–November 2002. The study investigates the contribution from urban versus re-gional sources of particle number and mass concentration.
The total particle number (ToN) and NOx are well cor-related at the urban and near-city level and show a distinct diurnal variation, indicating the common traffic source. The average ToN at the three stations differs by a factor of 3. The observed concentrations are 2500 # cm−3, 4500 # cm−3 and 7700 # cm−3at rural, near-city and urban level, respectively.
PM10 and total particle volume (ToV) are well correlated between the three different stations and show similar con-centration levels, in average within 30% relative difference, indicating a common source from long-range transport that dominates the concentrations at all locations.
Measures to reduce the local urban emissions of NOx and ToN are likely to affect both the street level and urban background concentrations, while for PM10 and ToV only measurable effects at the street level are probable. Taking into account the supposed stronger health effects of ultrafine particles reduction measures should address particle number emissions.
The traffic source contributes strongest in the 10–200 nm particle size range. The maximum of the size distribution shifts from about 20–30 nm at kerbside to 50–60 nm at ru-ral level. Particle formation events were observed in the 3– 20 nm size range at rural location in the afternoon hours, mainly under conditions with low concentrations of pre-existing aerosol particles.
The maximum in the size distribution of the “traffic con-tribution” seems to be shifted to about 28 nm in the urban
Correspondence to: M. Ketzel
(mke@dmu.dk)
location compared to 22 nm at kerbside. Assuming NOxas an inert tracer on urban scale allows to estimate that ToN at urban level is reduced by 15–30% compared to kerbside. Particle removal processes, e.g. deposition and coagulation, which are most efficient for smallest particle sizes (<20 nm) and condensational growth are likely mechanisms for the loss of particle number and the shift in particle size.
1 Introduction
During recent years the concerns about health effects of par-ticles have increased considerably. This is partly due to re-sults from epidemiological surveys showing that there is a correlation between the mass concentration of particles, and mortality and hospitalisation. (K¨unzli et al., 2000). Parti-cle mass concentrations (later referred to as PM, including PM2.5 and PM10) are therefore regulated e.g. in the US and EU legislation. However, the ultrafine particles (UFP, i.e. diameters less than 0.1 µm) are considered especially detri-mental to human health, since these particles can be inhaled and deposited deep in the alveoli of human lungs (Seaton et al., 1995). Moreover, epidemiological studies suggest a con-nection between both UFP and PM concentration and mortal-ity (Wichmann and Peters, 2000). Effects of PM were clearer in respiratory cases, whereas effects of UFP were clearer in cardiovascular cases.
The investigation of primary aerosol sources, especially for soot, and their interaction with secondary aerosols receive currently attention due to their impact on radiative forcing and global climate change (Jacobson, 2001).
Urban pollution plays an important role due to a high con-centration of particle sources and a large population exposed to elevated particle concentrations. To better characterise the urban particle sources and the fate of the particles in the
Note on ... Background Lille Valby Vavihill X X X HCOE 30 km 50 km Copyright Krak (R/030828/2)
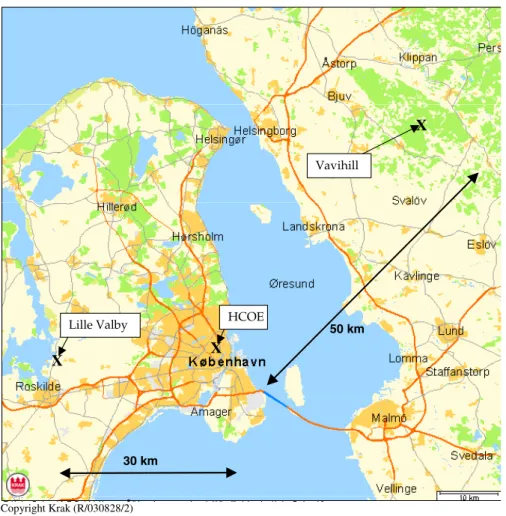
Fig. 1. Map of the Øresund region with location of the monitoring stations Lille Valby (LVBY, near-city background), H. C. Ørsted Institute (HCOE, urban background) and Vavihill (VVHL, rural background).
atmosphere there is a need to perform field measurements. Since climatic conditions and sources as e.g. the composition of the vehicle fleet can be different from country to country, results can not be transferred from location to location.
Extensive measuring programs of urban and regional aerosol concentration have been carried out at several lo-cations: e.g. Leipzig (Wehner and Wiedensohler, 2003), Nordic background stations (Tunved et al., 2003), Zurich area (Bukowiecki et al., 2003). In a previous Danish cam-paign the traffic source was studied by analysing simulta-neous street level and urban background measurements in Copenhagen (Ketzel et al., 2003).
The purpose of this study is to investigate the contribution from urban and suburban sources to the elevation of particle number and particle mass concentrations in cities compared to background levels. The contributions from long-range transport and from local sources are estimated. We document results of a measuring campaign that was performed at an ur-ban background station located close to the centre of Copen-hagen and two background locations west and north-east of the city. For some of the measured compounds (e.g. particle
mass) the contribution from long-range transport dominates. Therefore it is essential to perform simultaneous measure-ments since only small differences might appear on top of a highly variable regional background. The difference between urban and background concentration levels show the poten-tial for reduction scenarios that would influence the urban emissions, e.g. mandatory particle traps for certain part of the vehicle fleet or traffic reduction in the city centre. Analysing the particle size distribution in the urban background and comparing with the street contribution will give an indication about particle transformation processes that act on the parti-cles on their way from the street to the urban background levels.
2 Experimental
2.1 Sampling location and period
The location of the three main sampling sites in this study is given in Fig. 1. Two stations belong to the Danish Air Quality
Table 1. 1 Average of measured particle concentrations and NOxat three background and two street stations. The average includes only
records where data at all three background stations were available and only working days, except stated otherwise (N=481, based on half hourly values).
unit VVHL rural LVBY near-city HCOE urban JGTV kerbside HCAB kerbside ToN(>10 nm) #/cm3 2520 4460 7670 24 100a 43 400a ToV(<0.7 µm) µm3/cm3 4.6 6.1 6.5 12.3a 17.9a PM10-TEOM µg/m3 9.0b 9.5 10.3 17.2 29.5
NOx ppb 11.4 14.8 84.0 128.4
aresults from measuring periods in 2001/2002
bbased on all available simultaneous measurements of PM10 at VVHL and LVBY
Monitoring Programme (Kemp and Palmgren, 2003), the urban background location at the roof of the 20 m high H. C. Ørsted Institute (HCOE; 12◦3304200E, 55◦420200N) and the background location Lille Valby (LVBY; 12◦703400E, 55◦4101400N) ca. 30 km west of Copenhagen. Lille Valby can be characterised as near-city background because of the influence of the greater Copenhagen area in the east and the town of Roskilde in the south.
Another background station Vavihill (VVHL; 13◦090E, 56◦010N) is located in Sweden ca. 25 km east of Helsingborg and ca. 50 km north-east of Copenhagen and is operated by the Lund University, Sweden. The Vavihill site lies in the middle of a forest area (S¨oder˚asen), is part of the EMEP net-work (www.emep.int) and can be considered as rural back-ground site.
The measurements at VVHL and HCOE are conducted for several years while the particle measurements at LVBY were operated only during the period 27 September–6 November 2002. Selecting data records for which particle size measure-ments from all three locations are available, forms a sub-set of 2.5 weeks of data, which will be analysed in this work. The periods for the sub-set are: 27 September–1 October; 11–22 October; 25–29 October and 4–6 November.
For the purpose of comparing the urban regional particle size distribution with the “fresh” source contribution parti-cle and NOx data were used from two kerbside stations in Copenhagen, Jagtvej (JGTV) and H. C. Andersens Boule-vard (HCAB) belonging to the Danish Monitoring Program and the Municipality of Copenhagen, respectively. The par-ticle size distribution data from these stations were obtained during several periods through 2001/2002 and only data were used for which simultaneous urban background measure-ments (at HCOE) are available. The mean temperatures for this data set are with values of 12◦C–13◦C close to the yearly average in Copenhagen of about 10◦C. The average daily traffic at JGTV and HCAB is ca. 26 000 and 60 000 vehicles per day, respectively. The heavy vehicle share is 5–8%.
2.2 Instrumentation and data processing
At all sites, Differential Mobility Particle Sizers (DMPS) consisting of Vienna-type Differential Mobility Analysers (DMA) (Winklmayr et al., 1991) and employing a re-circulating flow system (Jokinen and M¨akel¨a, 1997) were used to measure the particle number size distribution. The DMPS at the Danish sites used a single DMA of 28 cm length and particles were counted using a TSI® Model 3010 Condensation Particle Counter (CPC). The scanning time for each size spectrum was 3 min, using alternating up- and down-scans. At Vavihill (VVHL) a DMPS setup with a twin DMA was employed, where an 11 cm DMA was used for the interval 3–22 nm diameter in connection with a TSI® Model 3025 CPC and a 28 cm DMA for the interval 22– 900 nm diameter with a TSI® Model 3760 CPC. Correc-tions for reduced counting efficiency at lower sizes, multiple charging (Wiedensohler, 1988) and particle sampling losses were made at the three stations.
All DMA were build and calibrated (for the loss and broadening parameters of the transfer function) at the Lund University. The Danish DMPS are intercompared on a regu-lar basis, showing very good agreement between the instru-ments, typically 5–15% difference in the total number con-centrations. The performance of the DMPS systems at the background sites is regularly checked by comparing the to-tal number concentration estimated by integrating the size distribution and the number concentration given by the CPC operating alone. These values should agree within a few per-cent. Average spectra for each half-hour were calculated and used for the analysis in relation to the trace gas and meteoro-logical measurements. The total particle number (ToN) and volume (ToV) was estimated for each half-hour based on the single scans assuming spherical particles and considering the overlapping size range of 10–700 nm for all DMPS.
At the Danish stations half-hourly measurements NOxare available employing monitors by API Inc., CA (model M 200A). At all stations PM10 (mass concentration of parti-cles with aerodynamic diameter less than 10 µm) was mea-sured using a Tapered Element Oscillating Microbalance
All year 2002 0 30 60 90 120 150 180 210 240 270 300 330 0% 2% 4% 6% 8% 10% Wind speed <=2 >2 - 4 >4 - 6 >6
2,5 weeks period Sep.-Nov.2002
0 30 60 90 120 150 180 210 240 270 300 330 0% 2% 4% 6% 8% 10% 303 42 66 184
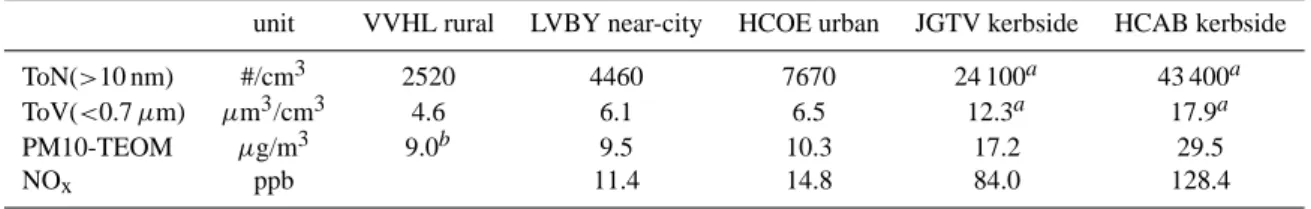
Fig. 2. Frequency distribution of wind direction and wind speed measured at HCOE for the year 2002 (left plot) and the observation period in Sep–Nov 2002 with simultaneous measurements (right). The right plot also shows the division in wind direction sectors as used for Fig. 8 and the number of measured half hour records (only working days) in each sector.
(TEOM, R&P Inc.). The TEOM are operated at 50◦C in order to dry the aerosol. This increased temperature leads to losses of volatile compounds (e.g. ammonium nitrate) in the TEOM and in general smaller PM10 values compared to PM10 results using a gravimetric or beta-attenuation method. For the stations JGTV and HCOE this difference between PM10TEOM and PM10betawas compared for daily averages during several months indicating a similar difference at both stations with a mean value of about 10 µg/m3 (Palmgren et al., 2003; W˚ahlin and Palmgren, 2003). The fact that the PM10 losses is similar at kerbside (JGTV) and urban back-ground (HCOE) let us conclude that mainly the long-range contribution to PM10 contains the volatile substances while the local contribution (i.e. exhaust-soot and road dust re-suspension) are less effected by volatilisation.
British and Swedish studies suggest a factor of 1.3 to cor-rect for PM10 losses in the TEOM (APEG, 1999; Ferm and Hansson, 2003). Our investigations yield a ratio PM10beta/PM10TEOMof 1.5 and 1.7 for kerbside (JGTV) and urban (HCOE) locations respective.
As reference Table 1 shows the average values of the mea-sured compounds at all locations used in this study.
2.3 Meteorological measurements
The HCOE roof site is equipped with a meteorological sta-tion at 10 m height above roof level measuring the following parameters: wind direction (WD), wind speed (WS), relative humidity (RH), temperature (T), and solar radiation. The
same meteorological parameters are available from a 10 m mast at LVBY, operated by Risø National Laboratory.
It has been shown that the WD and WS at HCOE is rep-resentative for the regional wind flow. The time series plots in Sect. 3.1 document a good correlation of WD and WS tween HCOE and LVBY. Similar agreement was found be-tween meteorological measurements at HCOE and at Copen-hagen airport (15 km south east of the city centre). At VVHL the height of the meteorological mast is smaller than the sur-rounding forest and therefore the data show a clear influ-ence from the forest canopy. These date do not represent the regional wind flow and are not used in this analysis, for instance the average wind speed at VVHL is only 0.8 m/s compared to 3.8 m/s and 3.6 m/s at HCOE and LVBY respec-tively.
The wind charts for the year 2002 and for the period of simultaneous measurements are shown in Fig. 2. The year 2002 has a much higher share of easterly wind directions than the 10-year average, where usually winds from west and south west are by far dominating (DMI, 2003). Our measur-ing period reflects this high share of easterly winds as well (right plot in Fig. 2). Considering that only a subset of 2.5 weeks of data was available the similarities with the complete year 2002 are satisfying in terms of the general east-west ori-entation of the wind distribution and our measuring period can be regarded as representative. Also shown in Fig. 2 is a division in wind direction sectors. We have chosen to group the data in order to document the wind direction dependence of the particle size distribution. Divisions are made at 30◦, 120◦, 210◦and 300◦.
wind direction wind speed (m/s) NOx (ppb) particle number (#/cm3) particle volume (µm3/cm3) PM10 (µg/m3) 7/10/02 8/10/02 9/10/02 10/10/02 11/10/02 12/10/02 13/10/02 14/10/02 15/10/02 16/10/02 17/10/02 18/10/02 19/10/02 20/10/02 21/10/02 22/10/02 23/10/02 24/10/02 25/10/02 26/10/02 27/10/02 0 90 180 270 360 0 4 8 12 0 40 80 0 10 20 0 10000 20000 30000 0 4 8 12 16
Mon Tue Wed Thu Fri Sat Sun Mon Tue Wed Thu Fri Sat Sun Mon Tue Wed Thu Fri Sat Sun
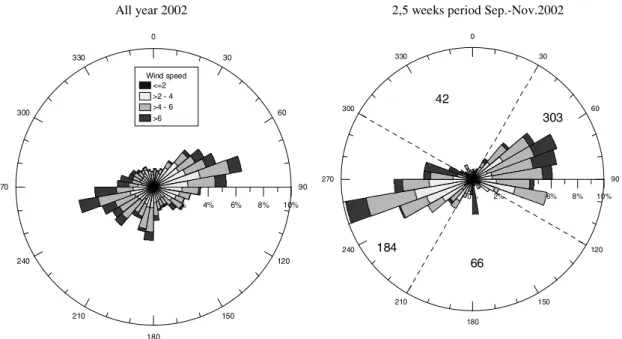
Fig. 3. Time series over 3 weeks period (7.10.–27.10.2002) for measured pollutant concentration and meteorology. For PM10, ToN and ToV values at the three stations VVHL (blue line), LVBY (green) and HCOE (black) are available. Wind speed, wind direction and NOxare
only available at HCOE and LVBY. The vertical lines mark midnight. The arrows under the particle number plot indicate particle formation events observed at VVHL.
3 Results and discussion
3.1 Time series and diurnal pattern of total concentrations A time series of WD, WS, NOx, ToN, ToV and PM10 for part of the measuring period is shown in Fig. 3.
NOxand ToN appear to have a relative constant “regional” background level of 5–10 ppb and 2000–4000 # cm−3and in most night hours the concentrations decrease to these low levels. Superimposed on this background a diurnal pattern was observed at the urban (HCOE) and near-city (LVBY) location reflecting the variations of the urban source. High WS tend to lower the levels of NOxand ToN due to higher dilution (see e.g. 12.,13.,17. and 19.10. in Fig. 3), while low WS lead to higher concentration (15., 20. and 21.10.). ToN at the rural location (VVHL) does not show a typical diurnal behaviour due to the absence of local traffic sources. Instead particle formation events were observed at VVHL, typically in the early afternoon (marked by arrows in Fig. 3).
ToV and PM10 follow an episodic pattern in which parti-cle concentrations are higher over periods of several days and decrease again, often related with a change of weather situa-tion and new air masses and a sudden change in WD and/or WS. Such episodes of high ToV and PM10 are e.g. observed on 12.+13.10., 15.+16.10. and 21.–23.10. (Fig. 3). The con-centration levels at the three stations behave very similar
dur-ing such episodes (especially 12.+13.10.) which indicates the long-range origin of these concentrations. A diurnal pat-tern in ToV and PM10 is hard to identify in the time series at HCOE and LVBY due to the dominating long-range con-tribution. Low wind speeds tend to increase the difference between the levels observed at HCOE and LVBY relative to VVHL (e.g. 15. and 20.10.). This shows the presence of local sources of PM10 and ToV found in the urban region.
In general PM10 and ToV trace each other for the above described episodes. An exception is observed on 26.+27.10. where an episode of elevated PM10 levels is not accompa-nied be elevated ToV levels, i.e. only coarse particles were present.
The scatter seen in the PM10-TEOM time series is sub-stantially higher compared to e.g. ToV or NOx. For TEOM data a 2–3 hour running average seems to be appropriate to filter the high frequency fluctuations.
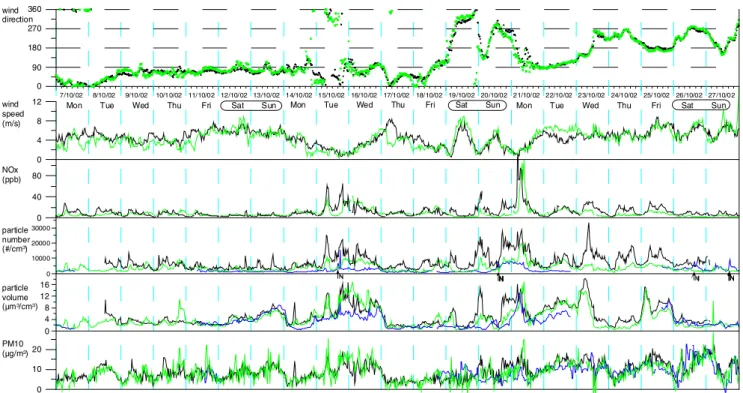
The diurnal variation of NOx and ToN is more visible when all data are grouped into working days, Saturday and Sundays and averaged separately for each hour of the day as shown in Fig. 4. The highest concentrations for all compounds are generally observed at HCOE and the low-est at VVHL, although exceptions in this ranking can ap-pear. For instance lead the particle formation events, ob-served at VVHL in the afternoon hours, to an increase of the particle number concentration at VVHL, reaching similar or
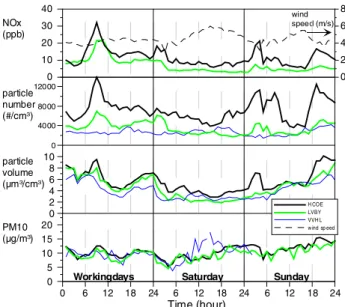
wind speed (m/s) NOx (ppb) particle number (#/cm3) particle volume (µm3/cm3) PM10 (µg/m3) 0 6 12 18 24 6 12 18 24 6 12 18 24 Time (hour) 0 2 4 6 8 0 10 20 30 40 0 5 10 15 20 0 4000 8000 12000 0 2 4 6 8 10 H COE LVBY VVH L w ind sp eed
Workingdays Saturday Sunday
Fig. 4. Average diurnal variation of NOx, ToN, ToV and PM10 at
working days, Saturdays and Sundays. Plotted are averages based on ca. 800 half hourly samples with simultaneous measurements at VVHL, LVBY and HCOE. NOxwas not observed at VVHL. Due
to missing observations the averages of PM10 at VVHL are not fully synchronised with the observations at LVBY and HCOE and in parts omitted.
sometimes higher levels than at LVBY. On weekends the av-eraged values are based on a lower number of data points and the diurnal pattern is less prominent since the correlation with meteorology and the episodic behaviour dominates over the variation of the urban source. The overall variations and the concentration levels of PM10 and ToV are very similar at all the stations, while more differences in the amplitude of the variations are observed for ToN and NOx.
3.2 Correlations
In this section we discuss the correlation between half-hourly time series of ToV, ToN, PM10 and NOx measured at the three stations HCOE, LVBY and VVHL. The correlation coefficient (R) for time series of the same compound mea-sured at different stations is shown in Table 2. Since not all instruments were always in operation, the number of sam-ple points, that are available for the correlation estimate, is variable with the parameter combination from 652 to 3696. This should be considered when comparing correlation co-efficients. Highest correlation coefficients are observed for ToV between all three stations. This shows the dominating long-range transport origin of ToV. High values of R also ap-pear for PM10 between stations LVBY and HCOE-VVHL, indicating again the long-range character of PM10. The correlation for PM10 is not as high between the stations LVBY-VVHL. This is probably caused by the relative small number of available data points (only 652). Comparatively
Table 2. Correlation coefficient (R) for one compound measured at different stations (inter station correlation) based on half hourly values. Values of R larger than 0.6 are displayed in bold face. N stands for the number of samples for each combination.
Compound Correlation between stations HCOE HCOE LVBY LVBY VVHL VVHL ToV 0.82 0.85 0.78 N 1461 3004 1162 ToN 0.58 0.26 0.30 N 1461 3004 1162 PM10 0.76 0.64 0.41 N 1690 2191 652 NOx 0.61 N 3696
Table 3. Correlation coefficient (R) between different compounds measured at one station (inner station correlation) based on half hourly values. Values of R larger than 0.6 are displayed in bold face. N stands for the number of samples for each combination.
Station Correlation between measured compounds ToN ToN ToN ToV ToV PM10 ToV PM10 NOx PM10 NOx NOx HCOE 0.44 0.51 0.83 0.79 0.42 0.59 N 3697 3098 3347 3098 3347 3369 LVBY 0.59 0.43 0.78 0.67 0.54 0.35 N 1873 1502 1787 1502 1787 1630 VVHL 0.24 0.30 0.90 N 3490 2281 2281
high R values are estimated for NOxand ToN between the stations HCOE-LVBY. This can be explained by the com-mon influence of the urban source at these two stations. ToN at VVHL is not well correlated with ToN at HCOE or LVBY, since a) very little urban influence is observed at VVHL and b) the particle formation events at VVHL are not present in the same extend at HCOE and LVBY.
The correlation coefficient between different compounds measured at the same station is given in Table 3. Highest val-ues of R are observed for the parameter combinations ToN-NOxand ToV-PM10 at all stations (except that NOxwas not observed at VVHL). The high correlation between ToN and NOxis caused by the fact that both compounds originate to large extend from the traffic emissions. The parameters ToV and PM10 are both closely related to long-range transport and are therefore well correlated.
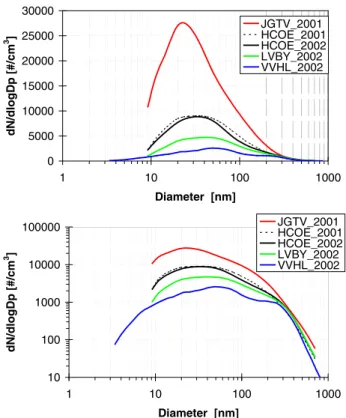
10 100 1000 10000 100000 1 10 100 1000 Diameter [nm] dN/dlogDp [#/cm 3 ] JGTV_2001 HCOE_2001 HCOE_2002 LVBY_2002 VVHL_2002 0 5000 10000 15000 20000 25000 30000 1 10 100 1000 Diameter [nm] dN/dlogDp [#/cm 3 ] JGTV_2001 HCOE_2001 HCOE_2002 LVBY_2002 VVHL_2002
Fig. 5. Average size distribution at four locations during two periods in 2001 and 2002, only working days included. Both linear (top) and logarithmic (bottom) plots regarding the number concentration are given. In Sep–Nov 2002 ca. 2.5 weeks of simultaneous data were collected at 3 stations VVHL (rural), LVBY (near-city), and HCOE (urban). For comparison results of ca. 12 weeks of parallel measurements from Jagtvej (JGTV, kerbside) and HCOE, in May– Nov 2001 (Ketzel et al. 2003) are included.
3.3 Size distribution
The following sections will focus on the discussion of the measured average particle size distribution and its depen-dence on time of the day.
3.3.1 Average
Figure 5 shows the average particle size distribution for working days. Besides the observations at all three loca-tions HCOE, LVBY and VVHL also data from a previous measuring campaign in 2001 (Ketzel et al., 2003) at HCOE and a kerbside location (JGTV) are shown for comparison. For particle diameters smaller than 200 nm a pronounced difference in the concentrations is observed between kerb-side, urban, near-city and rural level. Between each level the concentrations decrease with about a factor of two. These small particles dominate the total particle number concentra-tion (ToN) and average values of ToN are given in Table 1 for the different locations. The maximum in the size distri-bution shifts with increasing concentration towards smaller
Document1 1 0 2000 4000 6000 8000 10000 12000 1 10 100 1000 Diameter [nm] dN/dlogDp [#/cm 3 ] HCOE_day HCOE_night LVBY_day LVBY_night VVHL_day VVHL_night
Fig. 6. Size distribution at the three locations under day time (8:00– 18:00) and night (22:00–5:00) conditions.
diameters, from about 50–60 nm at the rural site to 20–30 nm at kerbside. The concentration gradient towards urban and street location points towards a significant urban (traffic) source for this particle size range.
The concentrations of particles larger than 200 nm, which represent the main part of the total particle volume (ToV) are very similar at all the measuring sites, less than 30% difference between HCOE and VVHL (Table 1). For this size range the urban source contribution is apparently much smaller compared to the regional background.
The VVHL size distribution can be separated into ca. 3 modes, nucleation mode (10 nm), Aitken mode (40–50 nm) and accumulation mode (200–300 nm) and is even better vis-ible in the VVHL distributions shown in Fig. 6 and Fig. 8. This 3-modal structure is usually observed for aged aerosol and typical at rural and natural levels (M¨akel¨a et al., 2000; Tunved et al., 2003). The remaining stations show a more smooth size distribution without a clear separation between e.g. Aitken and accumulation mode. This smooth distribu-tion is a consequence of the contribudistribu-tion of several urban sources (i.e. traffic and other combustion) emitting over a wide range of particle sizes below 200–300 nm. The prin-cipal shape of our observed size distributions is consistent with observations in other urban areas (Putaud et al., 2002; Wehner and Wiedensohler, 2003; Bukowiecki et al., 2003). 3.3.2 Day- night variation
Figure 6 depicts the variation of the size distribution between daytime (8–18) and night (22–5) at the three sites HCOE, LVBY and VVHL. The influence of the traffic source during daytime is visible at HCOE and LVBY in the 10–200 nm and 10–40 nm diameter range, respectively. LVBY and VVHL show lower concentrations at daytime in the 80–300 nm size range (for VVHL even down to 20 nm). This is probably due to better mixing during day time hours, i.e. higher WS and higher mixing layer. The influence of the higher urban emissions during daytime can obviously not compensate for
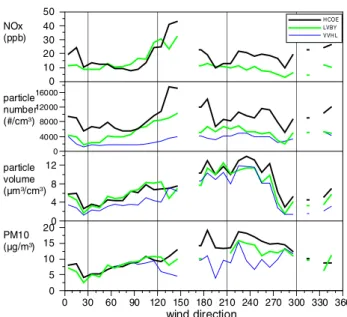
NOx (ppb) particle number (#/cm3) particle volume (µm3/cm3) PM10 (µg/m3) 0 30 60 90 120 150 180 210 240 270 300 330 360 wind direction 0 10 20 30 40 50 0 5 10 15 20 0 4000 8000 12000 16000 0 4 8 12 H COE LVBY VVH L
Fig. 7. Wind direction dependence of NOx, ToN, ToV and PM10.
Plotted are averages in 10◦ WD intervals based on ca. 590 half hourly samples with simultaneous measurements at VVHL, LVBY and HCOE (only working days). WD with very low number of data are omitted. Due to missing observations the averages of PM10 at VVHL are not fully synchronised with the observations at LVBY and HCOE.
the better mixing at the near-city and rural level. At VVHL higher concentrations at daytime were found in the nucle-ation mode (diameters less than 20 nm), caused by particle formation events that are observed at VVHL, especially but not exclusively in connection with high global radiation and low concentration of pre-existing particles.
3.4 Wind direction dependence
WD is a crucial parameter for the regional pollution as it in-dicates the origin of the air mass and the relative position of the measuring sites to the main sources (e.g. up- or down wind from Copenhagen). Therefore the concentrations of NOxToN, ToV and PM10 were plotted against WD (Fig. 7). The meteorological conditions (e.g. WS and mixing height) and the long-range contribution are variable with WD and will influence the overall concentration levels at all stations in a similar way. The interesting information in Fig. 7 comes from the concentration levels at the different stations relative to each other. For easterly winds (30◦–120◦) high
concen-trations at LVBY relative to HCOE were observed due to contributions form sources from the Copenhagen area. Es-pecially the concentrations of NOx, ToV and PM10 at LVBY reach or exceed the levels at HCOE. For ToN the ratio LVBY to HCOE shows highest values around 90◦–120◦and a trend towards lower ratios for WD 30◦–90◦. For the latter north-easterly WD the distance to the source regions (e.g. Hillerød and Helsingør in Fig. 1) becomes larger and the removal of
small particles can take place during a longer transport time of the air mass. For the remaining WD the concentration lev-els at HCOE are in general higher than at LVBY, indicating the urban source contribution.
In addition the measured data were grouped in four WD sectors (Fig. 8). The sector limits are shown in Fig. 2 and Fig. 7.
WD from west (Fig. 8a) is associated with lower than av-erage concentrations at LVBY (upwind from Copenhagen) and higher concentrations at VVHL (here located downwind of Copenhagen area and other sources in the Øresund region, e.g. Malm¨o, Helsingborg and Landskrona). As a result the concentration levels at LVBY and VVHL are approaching each other.
Easterly winds (Fig. 8b) bring very clean air to VVHL and also at HCOE the concentration levels are lower than aver-age. This trend to lower concentrations is not observed at LVBY, which is now located in the plume of the Copenhagen area. In this case the concentrations of particles bigger than 80–100 nm are very similar at LVBY and HCOE.
WD from south (Fig. 8c) is associated with continental and therefore more polluted air masses. Concentrations higher than average are observed al all stations for particles bigger than 10–15 nm. Nucleation range concentrations (<15 nm) at VVHL are suppressed by the higher concentration of big-ger particles.
WD from north (Fig. 8d) brings reduced particle concen-trations for all stations for particles bigger than 50–100 nm compared to the total average. This “relatively clean” air favours particle formation (photochemical driven nucleation events) resulting in particle concentrations in the 10–20 nm size range that are higher than average at all stations, but most pronounced at VVHL.
In summary it can be concluded that the location of the stations relative to the source regions (upwind or downwind) can well explain the observed variations in particle size dis-tribution with WD.
3.5 Street versus urban contribution
In this section we compare the size distribution of the “street traffic source”, estimated by the difference kerbside - urban level, with the “average urban source”, estimated by the dif-ference urban level (HCOE) minus near-city level (LVBY). The here addressed question is: Does the relative shape of the particle size distribution, e.g. the position of the maximum, and the particle concentration, e.g. relative to an inert tracer, change between street level and urban background? The traf-fic source contribution was measured at two streets in Copen-hagen (JGTV and HCAB) over several periods in 2001/2002. In the analysis only that subset of data were used for which also measurements at HCOE were performed and therefore allows subtracting the urban background from the kerbside data. Figure 9 depicts the obtained size distribution differ-ences JGTV-HCOE and HCAB-HCOE that characterise the
10 100 1000 10000 1 10 100 1000 Diameter [nm] dN/ d logDp [# /c m 3] HCOE;WD=W LVBY;WD=W VVHL;WD=W 10 100 1000 10000 1 10 100 1000 Diameter [nm] dN/ d logDp [# /c m 3] HCOE;WD=S LVBY;WD=S VVHL;WD=S 10 100 1000 10000 1 10 100 1000 Diameter [nm] dN/ d logDp [# /c m 3 ] HCOE;WD=E LVBY;WD=E VVHL;WD=E 10 100 1000 10000 1 10 100 1000 Diameter [nm] dN/ d logDp [# /c m 3 ] HCOE;WD=N LVBY;WD=N VVHL;WD=N N N N N
Fig. 8. Size distribution at the three locations for different wind direction sectors. From top left to bottom right: West, East, South and North. For better comparison all plots include the total averages from Fig. 5 as dashed curves.
“fresh” traffic source under average conditions. Figure 9 further contains the difference HCOE-LVBY (urban minus near-city) for the WD sector west (210◦–300◦). The size
dis-tributions in Fig. 9 are normalised with their total number concentration in order to be able to plot them in one diagram and compare the shape of the curves. The WD west was cho-sen, since LVBY represents for this sector the concentration of the air mass up-wind of Copenhagen and the difference HCOE-LVBY is a valid approximation for the size distribu-tion emitted from the “average” urban source. The urban source shows a particle size distribution slightly shifted to bigger particle diameters. The maximum in the size distri-bution is shifted to about 28 nm in comparison to the traffic distribution with a maximum at 22 nm. Removal processes that are most efficient for smallest particles (<20 nm) as e.g. deposition and coagulation might be the responsible mecha-nism for this. Condensational growth could also contribute to the shift of particle size.
The total particle number (ToN) and NOxconcentrations are well correlated as shown in Sect. 3.2 due to their com-mon sources. This good correlation allows for investigation of the change of ToN relative to NOx, latter can be regarded as inert on urban scale. The data points ToN versus NOx plotted in Fig. 10 were averaged separately for each hour of a working day at two kerbside, one urban and one near-city location including a linear regression line. The kerbside plots
0 0.2 0.4 0.6 0.8 1 1.2 1.4 10 100 1000 Diameter [nm] dN /dlogD p /ToN [-] JGTV-HCOE_2001-2all HCAB-HCOE_2001-2all HCOE-LVBY;WD=W traffic source 'urban' source
Fig. 9. Comparison of the average size distributions of the street-traffic source (JGTV and HCAB) and the total urban source (HCOE). From the average size distributions we subtracted the si-multaneous measured background, i.e. street minus urban back-ground (HCOE) and urban backback-ground minus rural backback-ground (LVBY). Only WD west was selected for the urban source estimate. The differences were normalised with the total number concentra-tion.
are based on the above described average data set from JGTV and HCAB, while the urban and near-city data originate from the campaign in fall 2002. For the kerbside and urban sta-tions the diurnal variasta-tions of NOx and ToN show a very good correlation (R2≥0.92) indicating the common sources.
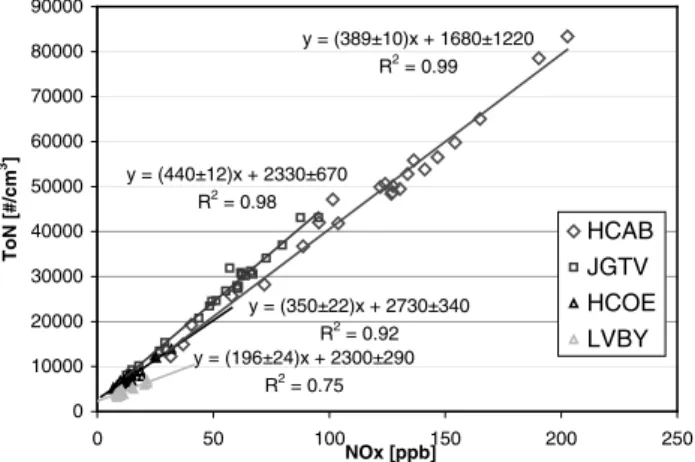
y = (350±22)x + 2730±340 R2 = 0.92 y = (196±24)x + 2300±290 R2 = 0.75 y = (389±10)x + 1680±1220 R2 = 0.99 y = (440±12)x + 2330±670 R2 = 0.98 0 10000 20000 30000 40000 50000 60000 70000 80000 90000 0 50 100 150 200 250 NOx [ppb] ToN [ # /cm 3] HCAB JGTV HCOE LVBY
Fig. 10. Scatter diagram of ToN versus NOx for four different
locations: kerbside (HCAB, JGTV), urban (HCOE) and near-city (LVBY). Data are averaged separately for each hour of the day, only working days included. Linear regression lines are shown for each station. Regression formulas are given including one standard devi-ation.
The slope of the regression lines reveals how many particles (in # cm−3)per NOx(in ppb) are present at the different sta-tions. The range for the slope at kerbside is ca. 380–450 in-cluding values from two stations and one standard deviation as error estimate. At urban level (HCOE) the slope covers a range of ca. 260–380 including three different sample periods (only one of which is shown in Fig. 10 for better clarity of the graph). Thus the slope ToN vs. NOxat urban level is about 15–30% smaller compared to the kerbside level. This means that particles get removed by e.g. deposition and coagulation on their way from the kerbside to the urban level. This is based on the assumption that NOxcan be regarded as inert at urban scale and that the two kerbside measurements are representative for the average urban source that is affecting the HCOE station. At the near-city station (LVBY) the corre-lation between ToN and NOxdaily variation is substantially lower (R2=0.75) since the daily variations are smaller com-pared to the average levels (see Fig. 4). Moreover unusually high NOxvalues (relative to HCOE) were observed at LVBY during this measuring campaign. The ratio LVBY/HCOE for NOxwas 0.77 for compared to 0.56 for the whole year 2002 (both for working days). The higher NOxvalues will decrease the slope and the lower correlation makes the esti-mate of the slope ToN vs. NOx more uncertain. The slope of the regression line at LVBY is with 170–220 (Fig. 10) significantly smaller compared to HCOE and kerbside. This indicates a further removal of particles (relative to NOx) dur-ing the transport from urban to near-city location, but could partly be caused by the before mentioned elevated NOxlevels at LVBY. The quantification of the two effects is very uncer-tain due to the limited time series of available measurements and will not attempted here.
ToN ToV PM10 NOx
0 20 40 60 80 100 200 300 400 500 600 700 800 900 co n c e nt ra ti o n r e la ti v e to u rb a n b a c k g rou nd ( = 1 0 0 ) kerbside (HCAB) kerbside (JGTV) urban (HCOE) near-city (LVBY) rural (VVHL) here: Keldsnor
Fig. 11. Comparison of average concentrations of total particle number (ToN), total particle volume (ToV), PM10 and NOxat rural,
near-city, urban and kerbside stations relative to urban background levels. The concentration bars are stacked so that only the additional contributions are marked with the pattern shown in the legend. The elevation of the urban background (HCOE) above the near-city level is marked (bold frame) and represents the potential for urban emis-sions reduction measures to decrease urban concentrations. Note that the scale of the vertical axis changes at 100. Since NOxwas
not measured at VVHL data from another rural station (Keldsnor) were used.
The intercept of the regression lines in Fig. 10 represents an estimate of a “clean” regional background of ToN that is not influenced by local contribution, i.e. we assume NOx concentrations to be zero in this “clean” background. The in-tercept for most of the regression lines lies in the range 2000– 3000 # cm−3, which is in agreement to the average value at the rural station VVHL of 2500 # cm−3. Only the intercept of the HCAB regression line is with 1700 # cm−3below this range, but the much higher standard deviation of this value compared to the other regression results indicates a higher uncertainty for this estimate.
3.6 Urban versus regional contribution
In this final part of the discussion we want to illustrate the contribution from the urban sources relative to the regional background levels. The question is: How much decrease in the urban concentration levels can be expected by a certain reduction in urban emissions e.g. in form of traffic regula-tions or more stringent vehicle emission limits?
Figure 11 shows the average working day concentration levels at the different locations (see Table 1) relative to the levels at HCOE (=100%). The near-city levels of PM10 and ToV contribute to ca. 93% to the urban concentrations and
only 7% of the urban PM10 and ToV concentrations origi-nate from local urban sources. The long-range transport is apparently the dominating source.
For ToN as well as NOxa much bigger difference between rural and urban levels could be observed. Near-city concen-trations are about 58% of the urban levels for ToN and 77% for NOx. Hence, the local emissions contribute with 42% and 23% to the urban concentrations of ToN and NOx, re-spectively.
The potential for reducing urban concentrations by emis-sion control is obviously much higher for ToN and NOx compared to PM10 and ToV. Taking into account the sup-posed stronger health effects of ultrafine particles (that dom-inate ToN) reduction measures should address particle num-ber emissions.
In addition the kerbside concentration levels are also plot-ted in Fig. 11 relative to urban (HCOE) concentrations. Here a similar behaviour is observed regarding higher relative con-centrations of ToN and NOx(300%–850% relative to HCOE) pointing at a higher reduction potential compared with ToV and PM10 (150%–300% relative to HCOE).
4 Conclusions, implications and outlook
A campaign of simultaneous measurements of particle size distribution and PM10 at three locations representing urban, near-city and rural level is reported.
PM10 and total particle volume (ToV) are well correlated between the three different stations showing similar con-centration levels, in average within 30% relative difference. ToV and PM10 are also well correlated within each location. Episodes of elevated concentrations of ToV and PM10 with length of 2–3 days are observed. A diurnal variation with the traffic behaviour is not very clear. All this indicates a common source from long-range transport that dominates the concentrations at all levels.
Moreover NOxand total particle number (ToN) are well correlated at the urban and near-city level and show a dis-tinct diurnal variation, both indicating the common traffic source. The average concentration levels at the three sta-tions differ by a factor of 3. The observed concentrasta-tions are 2500 # cm−3, 4500 # cm−3 and 7700 # cm−3 at rural, near-city and urban level, respectively.
Comparing the size distribution at day versus night times on working days reveals the contribution of the traffic source in the 10 nm–200 nm size range at urban level. The max-imum of the size distribution shifts from about 20–30 nm at kerbside to 50–60 nm at rural level. Particle formation events are observed in the 3–20 nm size range at rural level in the afternoon hours, mostly under conditions with low concen-trations of pre-existing aerosol particles.
The variation of the particle size distributions with wind direction (WD) could be demonstrated and explained by the location of the stations relative to the source regions, upwind
or downwind depending on WD. This shows the consistency of the measurements and opens the possibility to study the particle transformation processes inside the plume of an ur-ban area. The maximum in the size distribution of the “aver-age urban source” seems to be shifted to about 28 nm com-pared to 22 nm from the ’fresh kerbside traffic source’. Using the good correlation of ToN with NOx and assuming NOx to be inert on urban scale reveals that the particle number at urban level is reduced by 15–30% compared to kerbside. Particle removal processes, e.g. deposition and coagulation, which are most efficient for smallest particle sizes (<20 nm) and condensational growth are likely mechanisms for the loss of particle number and the shift in particle size.
The potential for decreasing urban concentrations by re-duction of local emission was discussed by comparing the urban and regional contributions to the pollution levels. Re-duction measures concerning NOxand ToN are likely to ef-fect both the street level and urban background concentra-tions, while for PM10 and ToV only measurable effects at the street level are probable. Taking into account the suppos-edly stronger health effects of ultrafine particles reduction measures should address particle number emissions.
The results of the here reported measuring campaign will build a basis for modelling studies on the particle transforma-tion processes in the urban and regional scale. More valuable results could be obtained by a longer similar campaign, that allow to study the seasonal variations and the particle-NOx relation at the near-city station, where unusually high NOx values were observed during this campaign.
Acknowledgements. The work presented in this paper is part of M.
Ketzel’s Ph.D. work supported by the Danish Research Agency. The Danish EPA under the Danish Ministry of Environment pro-vided funding for the Danish particle research programme AIDA (Aerosols in Danish Air) (Palmgren et al., 2003). Data of the gas pollutants and meteorological (HCOE) data were provided from the National Air Quality Monitoring Programme (LMP). The DMPS measurements at HCOE were supported by the Danish Natural Sci-ence Research Council. The authors thank the Wind Energy and Atmospheric Physics Department at Risø National Laboratory for providing us with meteorological measurements at LVBY. The mea-surements at the Swedish site are supported by the Swedish Founda-tion for Strategic Environmental Research (MISTRA) as part of the Swedish air pollution research program ASTA (International and National Abatement Strategies for Transboundary Air Pollution).
References
APEG: Source Apportionment of Airborne Particulate Matter in the United Kingdom. Report of the Airborne Particles Expert Group, Department of the Environment, Transport and the Regions, the Welsh Office, the Scottish Office and the Department of the En-vironment (Northern Ireland), 1999.
Bukowiecki, N., Dommen, J., Pr´evˆot, A. S. H., Weingartner, E. and Baltensperger, U.: Fine and ultrafine particles in the Z¨urich (Switzerland) area measured with a mobile laboratory, An
as-sessment of the seasonal and regional variation throughout a year, Atmos. Chem. Phys., 3, 1477–1494, 2003.
DMI: Danish Meteorological Institute, http://www.dmi.dk/vejr/ aktuelt/200303241530/index nyhed.html, 2003.
Ferm, M. and Hansson, H.-C.: J¨amf¨orelse mellan de tv˚a van-ligaste metoderna att m¨ata PM10 i Sverige (In Swedish), IVL Swedish Environmental Research Institute Ltd, IVL Rap-port/report B1527, 2003.
Jacobson, M. Z.: Strong radiative heating due to the mixing state of black carbon in atmospheric aerosols, Nature, 409, 695–697, 2001.
Jokinen, V. and M¨akel¨a, J. M.: Closed-loop arrangement with crit-ical orifice for DMA sheath/excess flow system, J. Aeros. Sci., 28, 643–648, 1997.
Kemp, K. and Palmgren, F.: The Danish Air Quality Monitoring Programme, Annual Report for 2002, National Environmental Research Institute, Roskilde, Denmark, NERI Technical Report No. 450, 2003.
Ketzel, M., W˚ahlin, P., Berkowicz, R., and Palmgren, F.: Particle and trace gas emission factors under urban driving conditions in Copenhagen based on street and roof-level observations, Atmos. Envir., 37, 2735–2749, 2003.
K¨unzli, N., Kaiser, R., Medina, S., Studnicka, M., Chanel, O., Filliger, P., Herry, M., Horak Jr., F., Puybonnieux-Texier, V., Qu´enel, P., Schneider, J., Seethaler, R., Vergnaud, J.-C., and Sommer, H.: Public-health impact of outdoor and traffic-related air pollution: a European assessment, Lancet, 356, 795–801, 2000.
M¨akel¨a, J. M., Koponen, I. K., Aalto, P., and Kulmala, M.: One-year data of submicron size modes of tropospheric background aerosol in southern finland, J. Aeros. Sci., 31, 595–611, 2000. Palmgren, F., W˚ahlin, P., Berkowicz, R., Ketzel, M., Illerup, J.
B., Nielsen, M., Winther, M., Glasius, M., and Jensen, B.: Aerosols in Danish Air (AIDA), Mid-term report 2001–2002, National Environmental Research Institute, Roskilde, Denmark, NERI Technical Report No. 460, http://www.dmu.dk/1 Viden/ 2 Publikationer/3 fagrapporter/rapporter/FR460.PDF, 2003.
Putaud, J. P., Van Dingenen, R., Baltensperger, U., et al.: A European Aerosol Phenomenology – physical and chemical characteristics of particulate matter at kerbside, urban, rural and background sites in Europe, European Commission and Joint Research Centre, EUR 20411 EN, http://ies.jrc.cec.eu.int/ Download/cc, 2002.
Seaton, A., MacNee, W., Donaldson, K., and Godden, D.: Particu-late air pollution and acute health effects, Lancet, 345, 176–178, 1995.
Tunved, P., Hansson, H.-C., Kulmala, M., Aalto, P., Viisanen, Y., Karlsson, H., Kristensson, A., Swietlicki, E., Str¨om, J., and Komppula, M.: One year boundary layer aerosol size distribu-tion data from five Nordic background stadistribu-tions, Atmos. Chem. Phys., 3, 2183–2205, 2003.
W˚ahlin, P. and Palmgren, F.: Source apportionment of PM10 and PM2.5 in a street in Copenhagen, Presented at “Particulate Mat-ter: Atmospheric Sciences, Exposure and the Fourth Colloquium on PM and Human Health”, 31 March–4 April, 2003, Pittsburgh, Pennsylvania, USA, 2003.
Wehner, B. and Wiedensohler, A.: Long term measurements of sub-micrometer urban aerosols: statistical analysis for correlations with meteorological conditions and trace gases, Atmos. Chem. Phys., 3, 867–879, 2003.
Wichmann, H. E. and Peters, A.: Epidemiological evidence of the effects of ultrafine particle exposure, Phil. Trans. R. Soc. Lond. A ,358, 2751–2769, 2000.
Wiedensohler, A.: An Approximation of the Bipolar Charge-Distribution for Particles in the Sub-Micron Size Range, J. Aeros. Sci., 19, 387–389, 1988.
Winklmayr, W., Reischl, G. P., Lindner, A. O., and Berner, A.: A New Electromobility Spectrometer for the Measurement of Aerosol Size Distributions in the Size Range from 1 to 1000 nm, J. Aeros. Sci., 22, 289–296, 1991.