HAL Id: halshs-01180621
https://halshs.archives-ouvertes.fr/halshs-01180621
Preprint submitted on 27 Jul 2015
HAL is a multi-disciplinary open access
archive for the deposit and dissemination of
sci-entific research documents, whether they are
pub-lished or not. The documents may come from
teaching and research institutions in France or
abroad, or from public or private research centers.
L’archive ouverte pluridisciplinaire HAL, est
destinée au dépôt et à la diffusion de documents
scientifiques de niveau recherche, publiés ou non,
émanant des établissements d’enseignement et de
recherche français ou étrangers, des laboratoires
publics ou privés.
hospitals in Shandong province in the context of the
drug policy reform
Laurene Petitfour, Xiezhe Huangfu, Martine Audibert, Jacky Mathonnat
To cite this version:
Laurene Petitfour, Xiezhe Huangfu, Martine Audibert, Jacky Mathonnat. Estimating and explaining
the efficiency of township hospitals in Shandong province in the context of the drug policy reform.
2015. �halshs-01180621�
C E N T R E D'E T U D E S E T D E R E C H E R C H E S S U R L E D E V E L O P P E M E N T I N T E R N A T I O N A L
Estimating and explaining the efficiency of township hospitals in
Shandong province in the context of the drug policy reform
Laurène PETITFOUR
Xiezhe HUANGFU
Martine AUDIBERT
Jacky MATHONNAT
Etudes et Documents n° 17
Juin 2015
C
ERDI65
BD.
F.
MITTERRAND63000
CLERMONT FERRAND–
FRANCE TEL.
+
33
4
73
17
74
00
FAX
+
33
4
73
17
74
28
www.cerdi.org
To cite this document:
Petitfour L., Huangfu X., Audibert M. and Mathonnat J. (2015) “Estimating and explaining the
efficiency of township hospitals in Shandong province in the context of the drug policy reform”,
Etudes et Documents, n° 17, CERDI.
http://cerdi.org/production/show/id/1714/type_production_id/1
2
The authors
Laurène Petitfour
PhD Candidate
Clermont Université, Université d'Auvergne, CNRS, UMR 6587, CERDI, F-63009 Clermont Fd
Email :
laurene.petitfour@udamail.fr
Xiezhe Huangfu
PhD Candidate
Clermont Université, Université d'Auvergne, CNRS, UMR 6587, CERDI, F-63009 Clermont Fd
Email :
huangfuxiezhe@hotmail.com
Martine Audibert
Director of Research at CNRS
Clermont Université, Université d'Auvergne, CNRS, UMR 6587, CERDI, F-63009 Clermont Fd
Email :
Martine.AUDIBERT@udamail.fr
Jacky Mathonnat
Professor
Clermont Université, Université d'Auvergne, CNRS, UMR 6587, CERDI, F-63009 Clermont Fd
Email :
Jacky.MATHONNAT@udamail.fr
Corresponding author: Jacky Mathonnat
Etudes et Documents are available online at:
http://www.cerdi.org/ed
Director of Publication: Vianney Dequiedt
Editor: Catherine Araujo Bonjean
Publisher: Chantal Brige-Ukpong
ISSN: 2114 - 7957
Disclaimer:
Etudes et Documents is a working papers series. Working Papers are not refereed, they
constitute research in progress. Responsibility for the contents and opinions expressed in the
working papers rests solely with the authors. Comments and suggestions are welcome and
should be addressed to the authors.
This work was supported by the LABEX IDGM+ (ANR-10-LABX-14-01) within the program
“Investissements d’Avenir” operated by the French National Research Agency (ANR)
3
Abstract
To cope with the rising price of drugs, in 2009 the Chinese government launched a large
pharmaceutical reform. Its key element is the implementation of a National Essential
Medicine List, leading to a reorientation of incentives for health services providers. Health
facilities are not anymore allowed to make any profit on drug sales (“zero mark-up policy”),
while this used to be their main source of financing. Different compensation schemes have
been implemented by the authorities. In a context of refunding of the financing structure of
health care facilities, it is crucial to understand how the reform has affected –or not- health
care facilities activity and efficiency.
This study relies on a survey data from a sample of 30 Township Hospitals of the rural
prefecture of Weifang (Shandong province). Using a two-stage procedure, it aims at assessing
the THs’ technical efficiency scores and then at identifying the determinants of this efficiency.
The first stage is realized with a non-parametric frontier approach, the so-called ‘partial
frontier’ method, order-m to deal with the problem of dimensionality. The identification of
the determinants of efficiency requires panel data models, with random individual effects.
Results show that the average efficiency remains constant between 2006-09 and 2010-12,
around 0.65. The most significant and robust factors of technical efficiency are the share of
subsidies in the TH incomes for the first sub-period (negative effect), and the number of
covered inhabitants per bed (positive effect). It suggests that drug reform hasn’t improve
primary health facilities efficiency, certainly because the reform did not tackle with success
the issues of the financial barriers to universal access to healthcare -out-of-pocket payments
from patients-, and of the perception of quality of public healthcare.
Key words: Chinese health care system, Hospitals, Incentives to health care providers,
Pharmaceutical sector reform, Rural health insurance, Soft budget constraint
JEL codes: I11, I13, I18
Acknowledgment
This paper is part of a research program conducted by the authors on health system
efficiency in developing countries. It benefited from the financial support of the the Agence
Nationale de la Recherche of the French government through the program "Investissement
d'Avenir" (ANR-10-LABX-14-01) and by FERDI (Fondation pour les études et les recherches sur
le développement international). We especially thank for their very fruitful collaboration
Professor Anning Ma, President of Weifang Medical University, Hongqi Sheng, Director of
Weifang Health Bureau, and their colleagues, We are also very grateful to Pr Ningshan Chen,
Deputy Director General, Department of Law and Legislation, National Health and Planning
Commission, PR of China and to Aurore Pélissier, University of Bourgogne for their remarks
and suggestions. This paper also benefited from stimulating comments when presented at
several workshops and conferences. But the authors alone are responsible for its content.
4
1. Introduction
From the 1970‘s to the 2010‘s, due to urbanization and the real income growth of a large part of the population, China experienced a major change of lifestyle (better access to rich food, less physical activity, spread of tobacco use for instance), and has faced the ageing of its population. This caused a spectacular demographic and epidemiological transition. The main factors of the burden of disease shifted from infectious, maternal and nutritional diseases to cardiovascular pathologies, cancers, hypertension, and chronic diseases (Wang et al., 2005). The emergence of those diseases increased the cost of healthcare, mainly borne by households, causing a large problem of inequalities in the access to healthcare. The spectacular increase of the insurance coverage rate between 2003 and 2008 (Audibert et al., 2013, You and Kobayashi, 2009) spurred the activity of public health facilities (Wagstaff et al., 2009), but failed to eradicate the phenomenon of catastrophic expenses (Meng et al., 2012). Financial burden of healthcare still represents a cause of impoverishment (Sun et al., 2009; Yip and Hsiao, 2009). Moreover, public policies around prevention (to tackle tobacco use and obesity for instance, (Wang et al., 2005) are still not satisfying. The education gradient observed in terms of diagnosis and treatment of hypertension in urban areas (Lei et al., 2012) underlines the weaknesses of the public healthcare services in terms of information.
Yet the quantity of financial resources injected in the system has kept increasing for more than three decades, largely because of the rise of costs. The issue of the inefficiency of Chinese healthcare facilities (Hu et al., 2008) has thus become crucial. The daily number of patients cared of by the medical staff has been proved to be weaker in China than in many other countries. The reasons were both intern (inappropriate recruitments and incentives) and environmental (collapse of health insurance, problem of access to healthcare). A growing defiance and dissatisfaction from patients due to a mediocre quality of healthcare in public facilities is also a matter of concern1.
The rural insurance reform of 2003 spurred health facilities‘ activity but didn‘t manage to contain the rise of costs and of out-of-pocket payments. Those costs being largely composed of drug expenses (Sun et al., 2008), in 2009 the government implemented a pharmaceutical reform to cut prices by a National Essential Medicine List (NEML) , and a zero mark-up policy on the sales of drugs. By reorienting the incentives for healthcare providers, it aims at a better use of all the resources of the healthcare system.
Relying on survey data, this study aims at estimating the technical efficiency of a sample of township hospitals (TH), - which are part of the primary level health facilities within the Chinese nomenclature - and its determinants. Particularly, it looks at a potential shift in the determinants of technical efficiency between before and after the pharmaceutical reform. It concludes that there was no significant change in the factors that drive technical efficiency.
Section 2 presents the two main reforms of the Chinese health system in the 2000‘s decade, the rural insurance and the NEML which are closely linked from the perspective of the objective of this study. Section 3 outlines a literature review about the determinants of efficiency. Section 4 presents the main characteristics of our sample and our study area, located in Weifang prefecture in Shandong province. Section 5 focuses on the estimation of the efficiency scores, while Section 6 deals with the identification of the determinants of efficiency. Results are discussed in Section 7, before a conclusion in Section 8.
2. Background
a. The revival of the Chinese Health Insurance system in rural area
In 1975, the Cooperative Medical System (CMS) ensured an almost universal access to basic healthcare to the Chinese rural population through a pre-payment insurance system (Bloom and Xingyuan, 1997; Dong, 2009). With its disentangling in the 1980‘s and 90‘s decades, healthcare became a financial burden for many households due to the absence of health insurance and rising prices. In 2003, the implementation of the New Rural Community Medical System (NRCMS) gave a large part of rural households an access to a basic health insurance, managed at the county level. From 2003 to 2013, the enrollment rate rose from less than 10% up to more than 95 % in 2013 (WB Policy Note 3, Yip et al., 2012 and official data quoted in China Daily, 2014-06-03).
1
The wave of violence against doctors recently observed in several provinces, and which is one extreme manifestation of this dissatisfaction, is being taken very seriously by the National Health and Family Planning Commission (2013 merging of Ministry of Health with the Family Planning Commission).
5
The NRCMS mainly aimed at avoiding catastrophic health expenditures, to prevent households from falling or sinking deeper into poverty. Though, deductibles and copayments rates have remained high, leaving high out-of-pocket payments for most of the medical acts, with, overall, ambiguous effects on catastrophic health expenditures. There are two main reasons. First, the NRCMS is ruled at the county level. The counties manage their benefit package within a policy guideline (You and Kobayashi, 2009), therefore there are some substantial differences between poor and rich areas (Meng et al., 2012). Second, until very recently, the benefit packages have been focusing mainly on inpatient care (Wagstaff et al., 2009 ; our discussion with members of the National Health and Family Planning Commission), despite the epidemiological transition, and the fact that chronic diseases mainly leads to poorly reimbursed outpatient cares.
b. The National Essential Drug Policy
At the same time, on the supply side, the financing modalities of health providers had spurred overpricing and overprescribing for many years. Central government subsidies to public health care facilities fell off during the 80‘ and 90‘, and to offset it, hospitals were allowed to take a markup on drug sales and ‗new‘ medical acts such as tests and surgeries. Simultaneously, there was a severe control of the price of ‗basic‘ cares (Blumenthal and Hsiao, 2005), on which health facilities could not make any profit. Those phenomena put together created incentives for health practitioners to overprescribe high-technology tests and expensive drugs rather than cheaper ones, to increase the TH income, through user fees. Drug benefits became the main source of hospitals financing (Yip et al., 2010). Until 2009, health facilities were allowed to take a 15% mark-up on the drug purchasing price, and used to ―take an average margin between 30% and 40%‖ (Wang Dongsheng, vice-director of the Social Development Division of National Development and Reform Commission, 2006). This made the financial burden of health expenditures even heavier for households. On the contrary, basic care services were neglected by health providers, enhancing a problem of quality of primary health in addition.
Drug overpricing was also spurred by the national drug supply chain, due to the excessive number of wholesalers, intermediaries between the drug producers and health facilities, and by the absence of bidding system ((Yu et al., 2010). Indeed, in China the pharmaceutical market was made of thousands of manufactures, selling their production to a ‗third-tier‘ who made the contact to another wholesaler, or to health facilities. Every actor of the supply chain taking a benefit, this structure participated in the very high prices of drugs in China (compared to the international prices).
To contain the excessive drug prices and disconnect hospitals income from drug sales, in 2009 the Chinese government implemented the National Essential Drugs Policy (NEDP). It aimed at improving the drug supply system and ensuring both equity in the access to basic care medicines and safety of drug utilization. A National Essential Medicine List (NEML) was released at the same time, updated in 2012. It includes three medicinal categories: chemical and biological drugs (317 drugs), traditional Chinese patent medicines (203 drugs) and traditional Chinese cut crude herbs (NHFPC, 2013). To meet regional specific needs, local governments were allowed to establish an additional list of essential drugs. In Shandong province, where our study area is located, the additional list (2010 version) consists of 216 drugs. All Primary Healthcare Facilities (PHF) must now prescribe exclusively essential drugs. As for other healthcare facilities, the utilization of essential drugs is compulsory, and the rate of essential drug utilization must reach the threshold defined by health authorities (NHFPC, 2009).
Another core objective of the reform was to strengthen TH (also called Township Health Center) initial missions in the health care pyramid: treatment for non-severe pathologies (and reference of severe cases to county hospitals), management of Village Health Stations (VHS) staff on their coverage area and prevention services. To ensure this preventive mission, the reform included the development of public health activities: vaccinations, health records for children and elder people, with specific subsidies for this purpose.
Since October 2009, the government also gradually implemented a zero-markup policy for the sales of essential drugs (NDRC, 2008). The selling price in PHF was adjusted to the purchasing price, including delivery costs but without any markup for PHF. This policy, completely redefined the structure of PHF financial balance. Indeed, the loss of drug benefits is a huge hole in PHF revenue and could have widely disturbed their daily activity.
To compensate losses due to the zero-markup policy, and ensure the stability of NEDP, different modes of financial compensation were implemented (Yuan and Tang, 2012; Zhuo and Zou, 2012). Each county can either choose one, or mix several modes of compensation among the following: exclusive government compensation, incentive system, multiple compensations, and separation of revenue and expenditure system.
6
When a financial compensation comes from the county, the performances of PHF are assessed for the attribution of the subsidies. The amounts are generally disbursed in several times such as once at the beginning of the period, once at the end. The first allocation is usually higher, to ensure the daily activity of PHF. In Weifang prefecture, our study area, 80 % of the subsidies are allocated monthly, during the current year. The remaining 20% are disbursed in March of the next year only if the PHF meets the requirements in the assessment organized by the county health authority. However, leaving a TH without any financing because of its poor performances would be unrealistic as it jeopardizes its activity for the following year. Thus, county governments actually handle most of the financial deficits in TH in Weifang, as long as their finances allow them. .
Due to the complexity of the compensation and of the incentives measures, the effects of the reform on THs efficiency are far from predictable and may seem contradictory.
3. Literature review and the potential effects of the zero mark-up policy on township
hospitals efficiency
a. Expected effects of the reform
Because of the high cost of care, we can consider that the health care demand at TH level is relatively price elastic, more precisely, elastic to the amount of the residual cost borne by the households. The mandatory use of essential drugs as well as the policy of zero mark-up should lead to a decrease in the unit cost of care and reduce catastrophic costs, all things being equal. For these reasons, an increase in healthcare demand is expected, and was found in various studies (Li et al., 2013; Xiao et al., 2013). This can result from a demand that was previously not satisfied for financial reasons (renunciation to care, self-medication) or from a transfer of demand from Village Health Stations or county hospitals to TH. On the other hand, increase may not be observed if patients, considering the decrease in unit costs, seek more sophisticated care than they would have without cost decrease. This effect was highlighted in Gansu province following the development of NCMS (Wagstaff and Yu, 2007).
Considering that Township Hospitals are far from being saturated, an increase of activity could be joined to an increase of efficiency of health facilities. The mean bed occupancy ratio (BOR) decreased over the 1990‘s (Liu et al., 1996). Pélissier et al., 2012, on the same area than this study, finds a decreasing BOR from 2000 to 2004 (from 40 to 35%) and then an increasing until 2008 (60% in 2008). In such a context, a take-off of activity does not necessary mean new inputs, but an increase of efficiency is expected as the physical and resources are fully used. In contrast to this hypothesis , Audibert et al., 2013 exhibits a positive and significant impact of the NRCMS on the THs‘ activity in Weifang, but a negative impact on their efficiency. It is thus essential, in terms of public policy, to distinguish the two analyses.
In the precise context of the pharmaceutical reform, three main scenarios (with variants) can be considered, suggesting that the effect of the reform on the efficiency of TH is unknown a priori:
i) Demand for care increases, all other things being equal: efficiency progress is noted.
ii) Demand for care increases, but its expected positive effect on efficiency is offset by an increase in the number of staff and other inputs. To anticipate and promote increased attendance in TH, the county health authorities (manning staff) or the TH manager (staff out of quota) may decide to increase the number of staff, despite the low staff productivity. If the demand does not increase sufficiently, the effect on the efficiency is potentially negative. It seems likely in Weifang, regarding our discussion with the local authorities.
iii) Demand remains unchanged as does the level of personnel and equipment. A decline or stagnation of efficiency is expected for several reasons:
a) Compensation for loss of income from drugs is partial; demand remains unchanged because THs develop coping strategies, for example by increasing medical activities (lab tests, drug injections) that are not supervised by the reform (Xiao et al., 2013). The unit cost of care borne by households does not decrease.
b) Cost of care decreases. If there is partial compensation, and without THs coping strategies, objective and/or perceived quality of care are likely to decline. The negative effect on demand neutralizes or outweighs the positive one coming from the decrease in the cost of care borne by households.
b. Determinants of efficiency and selection of potential determinants
7
The first type of determinants corresponds to the internal ones. Yip et al., 2010 underlines the crucial role of health care providers on hospitals efficiency: behaviors related to provider payments (which can create perverse incentives if not appropriate) and qualification. Here, all the THs implement the same provider payment system so we only study qualification and incentive of staff. Two variables are tested: the wage and bonus expenditure, per employee and the proportion of licensed staff (i.e. proportion of doctors among the medical staff).
Another crucial issue, especially in the context of the reform, is the financing structure of a hospital income, between subsidies and activity revenues. In a situation of soft budget constraint (Kornai, 2009), by a mechanism of moral hazard, the dependence of hospitals to public subsidies has a negative impact on their efficiency. On the contrary, if subsidies are allocated according to performances, then their effect can be positive on efficiency, by an incentive mechanism.
A methodological concern is the potential endogeneity of the effect of subsidies on technical efficiency, through reverse causality. In theory (according to the policy guidelines), the amount allocated to a TH is related to its performance, so the causality would be from efficiency to the amount of subsidy, with a positive sign. It can also be considered, in a situation of soft budget constraint, that if a TH is inefficient, it will be more likely to be bailed out at the end of the year to offset its deficit and reach a financial balance. In this case, the amount of subsidies is still explained by TH performances, but with a negative sign.
To check for the endogeneity of subsidies, we studied the determinants of subsidies in our sample through a panel data model. The results highlighted an absence of reverse causality between subsidies and efficiency scores. Indeed, the amount of subsidies allocated to each TH is largely driven by the population of the township (size effect), by the county GDP per capital (which has a positive effect on the financial capacities of the NCMS bureau), and unobservable factors. Neither the efficiency score, nor its lagged value being significant, the endogeneity of subsidies is thus rejected.
The importance of subsidies is captured through several variables. First, the proportion of subsidies in TH total income is used, as a proxy of TH dependence to public financing. Yet this variable is not fully satisfying, since it depends upon activity income. As an inefficient hospital probably exhibits a weak activity income, so mechanically subsidies will represent an important proportion of its global revenue. To deal with this issue, the proportion of subsidies in TH expenditures is also tested, as it is likely more stable. Other proxies are successively introduced in the model: amount of subsidies in the catchment area, per bed and medical staff.
The second type of determinants of efficiency is the external one. It gathers all the aspects of the hospitals environment: competition of other healthcare facilities, importance of the potential demand in the catchment area. In the same area, but on a previous period (2000-2008), those variables were found to be the most determinant factors of TH efficiency (Audibert et al., 2013). We use as external determinants the population covered by the NCMS in the township, the density of population, the net income per capita and the number of Village Health Stations under the responsibility of the TH. This last variable can have two opposite effects on TH efficiency: there can be a phenomenon of competition (a negative effect), or stimulation of activity by the referring of patients from VHS to TH (positive effect).
To check whether there was a shift in the determinants of efficiency between the beginning and the end of the period, the potential determinants were interacted with dummies corresponding to sub-periods, as well as variables at square to test non-linear relations.
4. Study area and descriptive statistics
a. Database
This study relies on annual survey data, from the rural part of the Weifang prefecture, in Shandong province, a relatively rich coastal province. The Weifang prefecture includes 12 administrative divisions, each formed of several townships. To each township is associated one Township Hospital. The sample is made of 30 TH randomly selected, belonging to the 8 rural counties of the prefecture. The study period runs from 2006 to 2012. Data was collected by the staff of Weifang Health Bureau, colleagues from Weifang Medical University and the authors. Sources of data include books and registers of TH, Statistical and Finance Offices of townships and counties.
8
b. Important evolutions of the activity
Every township in the sample is administratively classified rural, and actually exhibits a large majority of rural population (around 90%, stable across the period). The covered populations and density are very unequal between the TH, which can induce major differences in terms of potential demand for healthcare. The average net income per capita is rather homogenous between the 30 townships (and even more for end of the period, as the dispersion decreased), and almost doubled from 2006 to 2012 (Table 1, 5510 annual constant yuan in 2006, 10800 in 2012).
Table 1. Characteristics of the 30 Townships of the sample
2006 2009 2012
Mean Std dev.
Rel std
dev Mean Std dev.
Rel std
dev. Mean Std dev.
Rel std dev
Population of the Township 58599 29615 50.54% 72950 31666 43.41% 71359 33000 46.25%
TH catchment area 46233 17979 38.89% 55143 24453 44.34% 56317 25312 44.95%
Number of VHS under the TH
supervision 28 13 48.41% 34 16 48.89% 36 19 50.98%
Density of the covered population
(Inhabitants per km²) 483 187 38.79% 503 224 44.57% 495 232 46.78%
Density of the township population
(Inhabitants per km²) 545 408 74.93% 563 451 80.05% 553 482 87.12%
Average net income* 5511 1170 21.23% 7626 992 13.01% 10800 982 9.09%
Source: Data from Township registers. Rel. std dev= Std%mean ;
(*) Nominal values have been deflated by the General Retail Price Index in Shandong province, 2006=100 (from China Data Online)
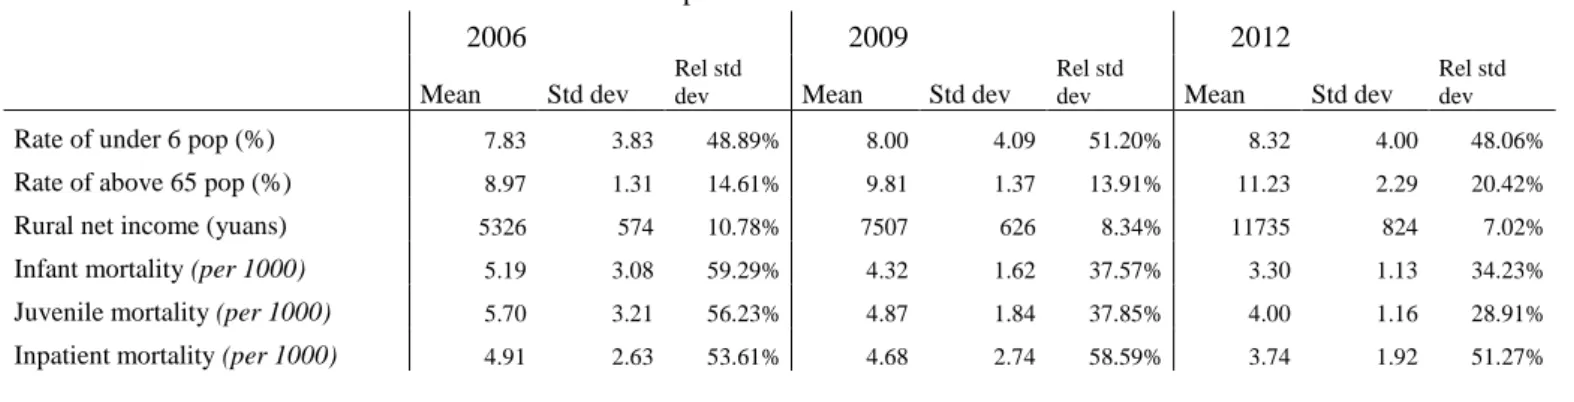
The broad characteristics of the population remained stable across the period (Table 2). Data from the county statistics show that there is no major demographic evolution between 2006 and 2012 (very slight increase of the proportion of inhabitants above 65 or below 6 years). Yet it can be noticed that infant and juvenile mortality decreased, suggesting that quality of maternal and postnatal care improved. In our context of randomly selected sample, the stability of demographic indicators, associated to the very precise missions of THs (curative treatment of non-severe cases only) justify a homogeneous case-mix across the THs of the sample, and across the period.
Table 2. Global statistics about the 8 counties of the sample
2006 2009 2012
Mean Std dev
Rel std
dev Mean Std dev
Rel std
dev Mean Std dev
Rel std dev
Rate of under 6 pop (%) 7.83 3.83 48.89% 8.00 4.09 51.20% 8.32 4.00 48.06%
Rate of above 65 pop (%) 8.97 1.31 14.61% 9.81 1.37 13.91% 11.23 2.29 20.42%
Rural net income (yuans) 5326 574 10.78% 7507 626 8.34% 11735 824 7.02%
Infant mortality (per 1000) 5.19 3.08 59.29% 4.32 1.62 37.57% 3.30 1.13 34.23%
Juvenile mortality (per 1000) 5.70 3.21 56.23% 4.87 1.84 37.85% 4.00 1.16 28.91%
Inpatient mortality (per 1000) 4.91 2.63 53.61% 4.68 2.74 58.59% 3.74 1.92 51.27%
Source: Data from County registers. Rel. std dev= Std%mean
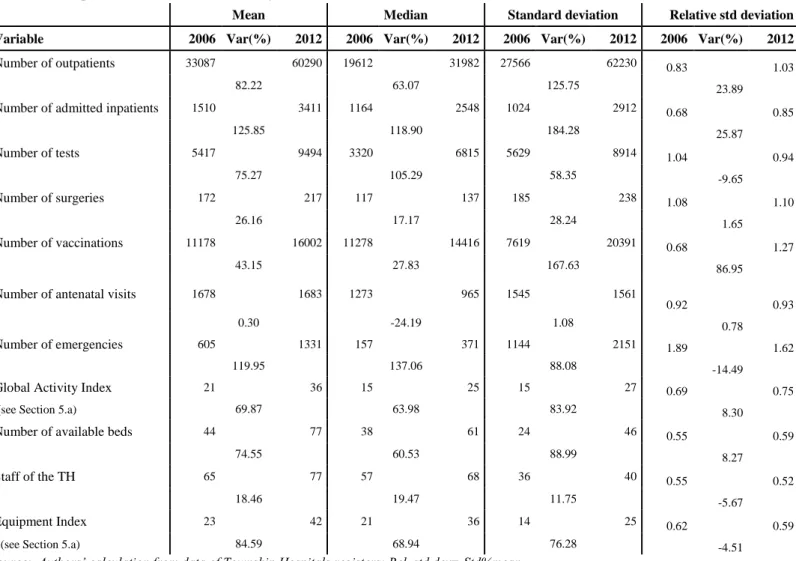
During the period under review, the level of both resources and activity increased. The activity of TH grew drastically regarding outpatients, inpatients, lab test, medical examinations (radiology, etc.) and preventive activities (Table 3). For instance, the number of outpatients increased by 82% and of inpatients by 126%. Nevertheless, no disruption in the trend is to be noted, the evolution being regular.
The inputs of THs also rose over the period. But the number of available beds (+75%) and the equipment index (+85%) grew faster than the staff (+19%). Indeed, TH managers frequently underlined their difficulties to hire staff in rural areas.
9
Table 3. Descriptive statistics about TH activity
Mean Median Standard deviation Relative std deviation
Variable 2006 Var(%) 2012 2006 Var(%) 2012 2006 Var(%) 2012 2006 Var(%) 2012
Number of outpatients 33087 60290 19612 31982 27566 62230 0.83 1.03
82.22 63.07 125.75 23.89
Number of admitted inpatients 1510 3411 1164 2548 1024 2912 0.68 0.85
125.85 118.90 184.28 25.87 Number of tests 5417 9494 3320 6815 5629 8914 1.04 0.94 75.27 105.29 58.35 -9.65 Number of surgeries 172 217 117 137 185 238 1.08 1.10 26.16 17.17 28.24 1.65 Number of vaccinations 11178 16002 11278 14416 7619 20391 0.68 1.27 43.15 27.83 167.63 86.95
Number of antenatal visits 1678 1683 1273 965 1545 1561
0.92 0.93
0.30 -24.19 1.08 0.78
Number of emergencies 605 1331 157 371 1144 2151 1.89 1.62
119.95 137.06 88.08 -14.49
Global Activity Index 21 36 15 25 15 27 0.69 0.75
(see Section 5.a) 69.87 63.98 83.92 8.30
Number of available beds 44 77 38 61 24 46 0.55 0.59
74.55 60.53 88.99 8.27
Staff of the TH 65 77 57 68 36 40 0.55 0.52
18.46 19.47 11.75 -5.67
Equipment Index 23 42 21 36 14 25 0.62 0.59
(see Section 5.a) 84.59 68.94 76.28 -4.51
Source: Authors’ calculation from data of Township Hospitals registers; Rel. std dev= Std%mean
At the same time, the expenditures of every NRCMS Bureau in our sample increased, with a strong acceleration starting from 2010, as well as the county subsidies devoted to the THs (Figures 1 and 2), contributing to ensure a quasi-universal coverage for a selected package of outpatients and inpatients care. In Shouguang county, where subsidies to TH increased the most, NRCMS expenditure have been multiplied by 10 in 3 years. There are mainly two complementary explanations to the growth of NRCMS expenditures, the deepening of the benefit package (rise of the reimbursement rate per inpatient case) and an increase of PHF activity. Those elements certainly spurred TH‘s activity, as the literature generally provides evidence of a positive influence of health insurance on the demand for care.
Figures 1 and 2. Evolution of NCMS deflated expenditures, Evolution of deflated county subsidies to TH
Source: Authors database from NCMS and Health Bureau data Nominal values have been deflated by the General Retail Price Index in Shandong province, 2006=100 (from China Data Online)
0 5000 10000 15000 20000 25000 T o ta l e xp e n d it u re s 2006 2008 2010 2012 year
Anqiu Changle Changyi Gaomi Linqu Qinzhou Shouguang Zhucheng
Evolution of NCMS expenditures, in 10 000 yuans
0 5000 10000 15000 c o u n ty s u b s id ie s d e v o te d t o T H 2006 2008 2010 2012 year
Anqiu Changle Changyi Gaomi Linqu Qingzhou Shouguang Zhucheng
10
As stated previously, the NEDP (National Essential Drugs Policy) reform sharply changed the income structure of PHF of the sample. Figure 3 shows the comparison of principal sources of income for all observed TH between 2006 and 2012. In 2006, over 80% of revenues came from hospitals‘ activities, such as inpatient activity, outpatient activity and drug prescription. Furthermore the drug prescription was the primary source of income, nearly the half of the total income. In contrast, activities rewarded hospitals up to 55% of its revenues in 2012. The huge decrease in drug income originated almost exclusively from the share of drug prescription. This loss of revenues was offset by governmental subsidies, especially subsidies from county level, which represent one third of hospitals‘ revenues.
Figure 3. Main financing sources of TH
Source: Authors database
5. Estimating efficiency of Township Hospitals
a. The choice of the production function
The definition of the production function has been made according to observations, and discussion with local actors. First, the multi-output production function of a hospital has to be dealt with. The literature around efficiency in health usually takes only into account the number of inpatients and outpatients (Yang and Zeng, 2014). Here preventive activities (vaccination, antenatal consults) are also at the core of a Primary Healthcare Facility, so a synthetic indicator was computed before the efficiency assessment to get a wider proxy of TH activity. Seven variables were selected as representative of an aspect of the TH‘s activity: annual number of outpatients, admitted inpatients, emergencies, surgeries, tests, vaccinations and antenatal consultations. A Principal Component Analysis (PCA) was computed in order to get some synthetic factors of the TH activity.
The first factor of the PCA was kept as the output in the production. It is by far the most explanatory axis, and it is positively correlated to each of the introduced variables. This axis, which captures 44% of the total variability, captures a global trend of the activity and is consistent with the characteristics of an output (an increase of any variable will increase the Global Activity Index). It is kept as the Global Activity Index and used as the output of our model.
The evolution of the Global Activity Index confirms the dynamic development activities for almost all TH (cf. Figures ), it rose by 70% in mean on the period.
16% 17% 27% 22% 8% 0%4%0%5% 15% 20% 13% 16% 5% 2% 26% 2%1% 2006 2012
OP Activity Income IP Activity Income OP Drug Income IP Drug Income
Preventive Income Subsidies from above county Subsidies from county Other subsidies
Other incomes
Graphs by year
11
Figure 4. Evolution of the Global Activity Index
Source: Authors database
Three inputs were identified, reflecting the human and physical capital of the TH: the number of available beds, the staff of the TH, and an equipment index. This latter was computed using a Principal Component Analysis (PCA) which included every kind of imaging and test machine found in a TH2.
b.Measurement of efficiency
There are mainly two ways of assessing health facilities efficiency: a parametric one, the Stochastic Frontier Analysis (SFA), and non-parametric ones such as the Data Envelopment Analysis (DEA). As pointed out by Hollingsworth, 2008, the DEA method has been widely used in assessing health facilities efficiency since its apparition in 1978 (Charnes et al., 1978, Birman et al., 2003; O‘Neill et al., 2008). It avoids making any assumptions about the form of the production function, when it is unknown.
Nonparametric efficiency methods can only compare DMUs (Decision Making Units) of the sample. The best performers of the sample will be defined as the efficient units and assessed a score of 1, and will be benchmarks for the other DMUs. The problem of the DEA method relies in its sensitivity to dimensionality, and to outliers in the given sample. If there is an outlier in the sample, the production frontier is distorted, and the scores of all the DMUs compared to those wrongly or artificially efficient units are biased.
Partial frontier methods were developed ((Cazals et al., 2002)(Daouia and Simar, 2007)) to cope with DEA limits. Two close techniques are used, so-called ‗order-m‘ and ‗order-α‘.
In the order-m frontier, introduced by Cazals et al., to estimate the efficiency of a DMU in an output orientation, many samples of
m DMUs are simulated, composed of DMUs using at most the same quantities of outputs in the sample (in an input orientation,
producing at least the same quantities of outputs). For each simulated sample, an efficiency score is assessed to every firm, relatively to the estimated frontier. The procedure is repeated n times, then the mean score of all those simulations becomes the order-m score. This method authorizes DMUs to be above the production frontier, and the scores to be above 1. It is also a way to detect outliers, defined as the DMUs whose score remains largely above 1 even when m increases (Simar, 2003). In the ‗order-α‘ technique (Daouia and Simar, 2007), the efficiency scores are computed so that a certain percentage of DMUs in the sample, fixed
a priori, remains above the frontier. Here, both techniques have been used and gave very similar results. We present and discuss
only the order-m results.
2
The PCA included the number of radiography and computed tomography machines, of echo-graphs, electrocardiogram machines, endoscopes, anesthetic machines and ECG monitoring instruments.
Guangong Jingzhi Jinzhongzi Linwu Wushan Xinanjiedao Zheshan Qiaoguan Wutujiedao Liutong Xiadan Chaigou Damujia Jinggou Kanjia Chengguanjiedao Dongchengjiedao Liushan Xinzhai Dongxia Gaoliu Heguan Shaozhuang Tanfang Wangfen Daotian Houzhen Tianliu Baichihe Mazhuang 0 20 40 60 80 1 0 0 2 0 1 0 /1 1 /1 2 Me a n 0 20 40 60 80 100 2006/07/08 mean
12
In the efficiency assessment, an output orientation was chosen. THs have limited choice concerning their inputs, the county authorities decide of their size and of the importance of the staff. In this context, their strategy can only have influence on the output level, given the level of their inputs.
The analysis of the evolution of activity exhibits that there is no disruption in the activity trend over the period. As our discussions with local actors suggested that the production function in itself didn‘t change, and the case-mix remained stable (see Section 4.b), a unique production frontier was estimated.
c. Efficiency scores
Technical efficiency remained quite stable over the period, suggesting that there was no improvement in the performance of THs from 2006 to 2012 (Figures 5 and A1, Table 4). A decrease in efficiency is even observed over the last three years of the period. Figure 5. Evolution of order-m scores
Table 4. Evolution of efficiency scores
year mean min max p25 p50 p75 sd 2006 0.662 0.071 1.002 0.434 0.722 0.929 0.300 2007 0.678 0.153 1.010 0.357 0.657 1.000 0.305 2008 0.662 0.154 1.078 0.397 0.712 0.861 0.284 2009 0.660 0.189 1.009 0.411 0.674 0.904 0.280 2010 0.657 0.166 1.034 0.445 0.685 0.925 0.270 2011 0.666 0.241 1.070 0.427 0.653 0.949 0.274 2012 0.649 0.002 1.052 0.400 0.628 0.972 0.300
6. Estimating the determinants of THs efficiency
a. Empirical strategy
The two-stage approach usually uses Tobit model to deal with the bounded nature of the DEA scores, between 0 and 1.
Nevertheless, the fact of this boundary being of a censored nature is a really questioned issue ((Ramalho et al., 2010; Wilson, 2008). Some alternative methods have been proposed (Banker and Natarajan, 2007; Simar and Wilson, 2007). Ramalho (2010) proposes an instrumentalist approach, considering that efficiency scores are observed managerial performances regarding a best observed practice, and not an estimate of the true efficiency of a score. He proposes a second stage based on fractional regression models (first developed by Wooldridge (2002)) that we use here. As some of our THs exhibits order-m higher than 1, they have been normalized so that they would be bound between 0 and 1.
This method needs to make certain hypothesis. First we have to choose between a one-part or a two-part regression model that would estimates different partial effects for efficient and inefficient firms. Here, as the proportion of efficient firms is small, we considered a one-part model. Then, the link function for the model has to be chosen according to the results obtained by the p-test.
0 .2 .4 .6 .8 1 2012 2011 2010 2009 2008 2007 2006
13
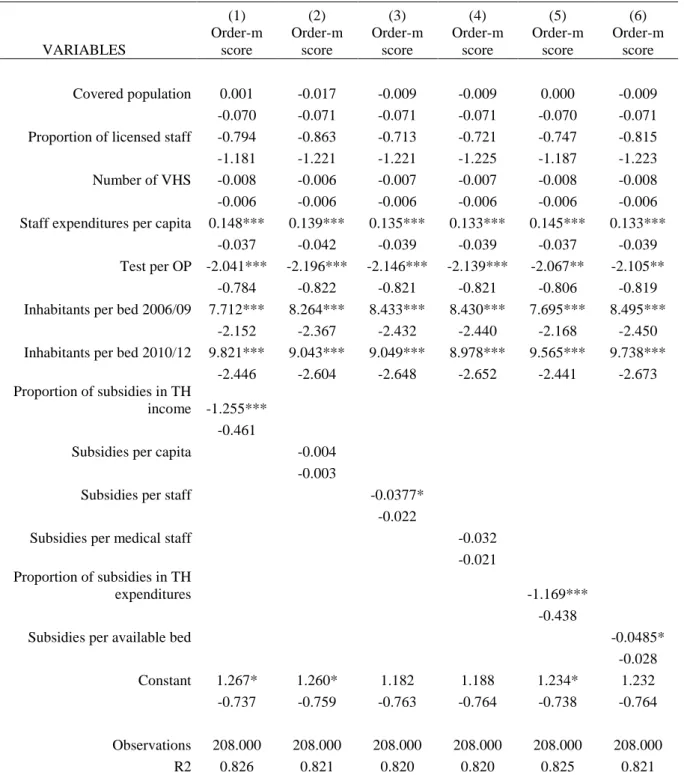
b. Results
Results of the second step are presented in Table 5, for normalized scores and a Probit link function, but the conclusions are robust to the use of DEA scores as dependent variable, and to another choice of link function (Tables 6 and 7 in annex).
Table 5. One-part fractional regressions with normalized order-m scores
(1) (2) (3) (4) (5) (6) VARIABLES Order-m score Order-m score Order-m score Order-m score Order-m score Order-m score Covered population 0.0177 0.00984 0.0141 0.0142 0.0173 0.0141 (0.042) (0.043) (0.042) (0.042) (0.042) (0.043) Proportion of licensed staff -0.496 -0.532 -0.447 -0.450 -0.468 -0.509 (0.706) (0.731) (0.732) (0.733) (0.709) (0.733) Number of VHS -0.007* -0.006 -0.006* -0.006* -0.007* -0.007* (0.004) (0.004) (0.004) (0.004) (0.004) (0.004) Staff expenditures per capita 0.086*** 0.079*** 0.077*** 0.076*** 0.085*** 0.076***
(0.022) (0.025) (0.023) (0.023) (0.021) (0.023) Test per OP -1.150** -1.237*** -1.211** -1.207** -1.170** -1.186**
(0.453) (0.474) (0.470) (0.470) (0.465) (0.466) Inhabitants per bed 2006/09 4.009*** 4.240*** 4.313*** 4.308*** 3.996*** 4.339***
(0.923) (1.004) (1.027) (1.029) (0.928) (1.024) Inhabitants per bed 2010/12 5.331*** 4.755*** 4.732*** 4.693*** 5.184*** 5.138***
(1.233) (1.276) (1.277) (1.279) (1.224) (1.295) Proportion of subsidies in TH income -0.754***
(0.270)
Subsidies per capita -0.002 (0.002)
Subsidies per staff -0.0213* (0.012)
Subsidies per medical staff -0.0181 (0.012) Proportion of subsidies in TH
expenditures -0.705***
(0.256)
Subsidies per available bed -0.029* (0.017) Constant 0.798* 0.805* 0.766* 0.769* 0.781* 0.795* (0.418) (0.429) (0.433) (0.434) (0.419) (0.431)
Observations 208 208 208 208 208 208 R2 0.822 0.816 0.816 0.815 0.822 0.816
Robust standard errors in parentheses, *** p<0.01, ** p<0.05, * p<0.1
The environment of a TH is crucial for its performance, but through one aspect only. The population doesn‘t have any effect, but the number of inhabitants per bed does. This means that where there are few people per bed (where the quantity of inputs is important relatively to the potential demand for healthcare), THs are the most inefficient. The quantity of inputs injected in THs may be excessive regarding the current demand in the catchment area (cf. § Discussion). Considering that staff productivity is very low in the sample – excluding public health activities - (per medical staff and per day, the mean number of outpatients is 1.5 in 2006 and 2.18 in 2012, and of inpatients 0.08 to 0.14), the demand has to grow to spur efficiency. This is a concern for both of the sub-periods, suggesting that the development of the NCMS benefit package across the period, or the implementation of the reform did not allow reaching equilibrium between healthcare demand and supply.
14
The number of VHS has a very weak impact on efficiency, suggesting that there is no dominant effect between competition and referring. This could mean that the reform succeeded pushing patients to enter the health system at the grassroots‘ level (VHS) rather than in THs (competition effect). Yet VHS can only deal with basic pathologies, so THs also benefit from this pyramidal system through the reference effect but the global effect is neutral.
As for the managerial factors, all the variables introduced to capture the effect of subsidies on efficiency exhibit a negative sign (with high level of significance and magnitude for the importance of subsidies in TH income and expenditure), giving evidence of the phenomenon of soft budget constraint. Subsidies induce a perverse incentive effect, and fail to spur efficiency. No significant change is noticed between the two sub-periods, so this situation did not change with the pharmaceutical reform and the redefinition of TH financing. One of the main goals of the reform has not been reached. This negative effect of subsidies is also found by (Hu et al., 2012) on coastal township hospitals, confirming the perverse effects of modalities of granting subsidies..
7. Discussion
Results of the first step exhibit no positive trend in TH efficiency between 2006 and 2012, contrary to what was expected of the pharmaceutical reform. A similar trend is found by (Yang and Zeng, 2014) and (Ng, 2011). Our result brings new elements suggesting that for now the Chinese health system hasn‘t entered into a phase of improvement of its performances despite the efforts and reforms.
From the second step of the analysis, several barriers to efficiency improvement can be identified, as well as levers for action. First, as the demand side is still crucial to explain TH efficiency, affordance of healthcare has to be spurred, mainly by a deepening of the benefit package of the NRCMS. In Weifang, in 2006 outpatients acts were reimbursed up to 30% only and many cases were not reimbursed at all. In 2012, user fees represent at least half the total costs of outpatient care, and from our discussion with local NCMS and Health Bureau, it is likely that there are still financial barriers to healthcare for some households. But in average, the amount of user fees paid by those who got outpatient and inpatient care is low compared to the households average net income (see Figure A2 in Annex). Moreover, from a county to another, the benefit packages are very different, leading to disparate user fees burden for households, while the net income is quite homogenous (see Table 10 in Annex).
The issue of the optimal size of TH is also a matter of concern. Our results suggest that the inputs of the healthcare system are not fully used, since more inhabitants per bed leads to a better performance (no congestion, or saturation effect for instance). Yet from 2012, the number of available beds per TH grew drastically (from 44 to 77 in average on the sample, see Table 3). In a situation of financial constraint, the priority should be in the improvement of healthcare quality and affordance for households, rather t han in the enlargement of existing hospitals. Our discussions with local health authorities suggest that, at this stage, there are both too many staff and not enough patients, and very likely – but it is a sensitive topic – too many TH, with a potential for merging some of them. Moreover, as pointed out by Yang and Zeng, 2014, too oversized hospitals may lead to quality concerns.
Another hot issue in the current Chinese health system is the availability of essential drugs, proved to be problematic in many areas despite of the reform, including in the prefecture of Weifang (from our discussions with local actors). Li et al., 2013 points that, because some ceiling prices have been fixed too low by the provincial government, manufacturers are reluctant to produce them, enhancing some shortage risks, that which was confirmed in Weifang where drug shortage was not rare. A decline of quality is also a concern if the price is the crucial criteria to discriminate firms during the bidding process (Xiao et al., 2013). The lack of availability for some essential drugs can be dramatic for TH daily activity and for healthcare costs (since households have to get drugs from other places, at higher prices).
The core of the reform relying in the reshape of TH financing, from drug margins to subsidies, it is crucial that those subsidies are allocated according to a systemic formula, with incentives, linking subsidies and results, following a Result Based Financing (RBF) approach. Results on the determinants of subsidies (Table 6) highlight a black box around those amounts. To avoid the perverse incentives of the soft budget constraint and not to jeopardize their daily activity, TH have to know how much they will get, and that they won‘t just be bailed out at the end of the period.
Finally, to re-orientate incentives, the provider payment has to be tackled in Chinese PHF. In our sample the fee-for-service method is still used, while it has been proved to be linked with higher costs than prospective payment methods (Yip et al., 2010). The introduction of this kind of payment is in discussion in Weifang, and appears to be an essential way to make public healthcare system more efficient, particularly in a situation of multitasking of healthcare (Cheng et al., 2012; Eggleston, 2005; Robyn et al., 2014)
15
8. Conclusion
Using a two-stage procedure, partial frontier methods to assess technical efficiency, and fractional regression model in the second-stage to explain it, this paper highlights the role of the public subsidies and demand side in the technical efficiency of primary health care facilities in the rural prefecture of Weifang. The technical efficiency remains constant over the first part of the period under review, and decreased on the three last years. A negative effect of the share of subsidies is identified. The soft budget constraint has not been efficiently tackled, showing that the way subsidies are allocated doesn‘t manage to spur efficiency.
In addition, deeper information has to be collected regarding the real criteria of subsidies allocation, as several elements suggest that in the field, because the local context, the real process may deviate by pragmatism from some of the criteria established in texts. This will be necessary to have a better understanding of how incentives are aligned or not with the health policy objectives. At the same time, the importance of demand side factors such as the density of covered population per available bed exhibits the fact that working on the managerial aspect is not sufficient to improve provider efficiency. To spur activity in this perspective, it is necessary that outpatient health care become more affordable (what is currently an objective of the National Health and Planning Commission) and that the NCMS enlarges its benefit package towards better reimbursement of outpatient care. Another crucial aspect is the households‘ perception of quality of care in TH. It‘s going better in Weifang, but room for improvement remains. Finally, it seems that, at least for some counties, THs may be oversized, regarding their intermediary position between VHS and county hospitals.
16
References
Audibert, M., Mathonnat, J., Pelissier, A., Huang, X.X., Ma, A., 2013. Health insurance reform and efficiency of township hospitals in rural China: An analysis from survey data. China Econ. Rev. 27, 326–338. doi:10.1016/j.chieco.2013.01.004 Banker, R.D., Natarajan, R., 2007. Evaluating Contextual Variables Affecting Productivity Using Data Envelopment Analysis.
Oper. Res. 56, 48–58. doi:10.1287/opre.1070.0460
Birman, S.V., Pirondi, P.E., Rodin, E.Y., 2003. Application of DEA to medical clinics. Math. Comput. Model. 37, 923–936. doi:10.1016/S0895-7177(03)00108-0
Bloom, G., Xingyuan, G., 1997. Health sector reform: Lessons from China. Soc. Sci. Med. 45, 351–360. doi:10.1016/S0277-9536(96)00350-4
Blumenthal, D., Hsiao, W., 2005. Privatization and Its Discontents — The Evolving Chinese Health Care System. N. Engl. J. Med. 353, 1165–1170. doi:10.1056/NEJMhpr051133
Cazals, C., Florens, J.-P., Simar, L., 2002. Nonparametric frontier estimation: a robust approach. J. Econom. 106, 1–25. doi:10.1016/S0304-4076(01)00080-X
Charnes, A., Cooper, W.W., Rhodes, E., 1978. Measuring the efficiency of decision making units. Eur. J. Oper. Res. 2, 429–444. doi:10.1016/0377-2217(78)90138-8
Cheng, S.-H., Chen, C.-C., Tsai, S.-L., 2012. The impacts of DRG-based payments on health care provider behaviors under a universal coverage system: A population-based study. Health Policy 107, 202–208. doi:10.1016/j.healthpol.2012.03.021 Daouia, A., Simar, L., 2007. Nonparametric efficiency analysis: A multivariate conditional quantile approach. J. Econom. 140,
375–400. doi:10.1016/j.jeconom.2006.07.002
Dong, K., 2009. Medical insurance system evolution in China. China Econ. Rev., Symposium on Health Economics Issues in China Health Symposium 20, 591–597. doi:10.1016/j.chieco.2009.05.011
Eggleston, K., 2005. Multitasking and mixed systems for provider payment. J. Health Econ. 24, 211–223. doi:10.1016/j.jhealeco.2004.09.001
Hollingsworth, B., 2008. The measurement of efficiency and productivity of health care delivery. Health Econ. 17, 1107 –1128. doi:10.1002/hec.1391
Hu, H.-H., Qi, Q., Yang, C.-H., 2012. Analysis of hospital technical efficiency in China: Effect of health insurance reform. China Econ. Rev. 23, 865–877. doi:10.1016/j.chieco.2012.04.008
Hu, S., Tang, S., Liu, Y., Zhao, Y., Escobar, M.-L., de Ferranti, D., 2008. Reform of how health care is paid for in China: challenges and opportunities. The Lancet 372, 1846–1853. doi:10.1016/S0140-6736(08)61368-9
Kornai, J., 2009. The soft budget constraint syndrome in the hospital sector. Int. J. Health Care Finance Econ. 9, 117–135. doi:10.1007/s10754-009-9064-4
Lei, X., Yin, N., Zhao, Y., 2012. Socioeconomic status and chronic diseases: The case of hypertension in China. China Econ. Rev. 23, 105–121. doi:10.1016/j.chieco.2011.08.004
Liu, X., Xu, L., Wang, S., 1996. Reforming China‘s 50 000 township hospitals—effectiveness, challenges and opportunities. Health Policy 38, 13–29. doi:10.1016/0168-8510(96)00834-2
Li, Y., Ying, C., Sufang, G., Brant, P., Bin, L., Hipgrave, D., 2013. Evaluation, in three provinces, of the introduction and impact of China‘s National Essential Medicines Scheme. Bull. World Health Organ. 91, 184–194. doi:10.2471/BLT.11.097998 Martineau, T., 2004. Changing medical doctor productivity and its affecting factors in rural China. Int. J. Health Plann. Manage.
19, 101–111.
Meng, Q., Xu, L., Zhang, Y., Qian, J., Cai, M., Xin, Y., Gao, J., Xu, K., Boerma, J.T., Barber, S.L., 2012. Trends in access to health services and financial protection in China between 2003 and 2011: a cross-sectional study. The Lancet 379, 805– 814. doi:10.1016/S0140-6736(12)60278-5
Ng, Y.C., 2011. The productive efficiency of Chinese hospitals. China Econ. Rev. 22, 428–439. doi:10.1016/j.chieco.2011.06.001 O‘Neill, L., Rauner, M., Heidenberger, K., Kraus, M., 2008. A cross-national comparison and taxonomy of DEA-based hospital
efficiency studies. Socioecon. Plann. Sci. 42, 158–189. doi:10.1016/j.seps.2007.03.001
Pélissier, A., Audibert, M., Mathonnat, J., Huan, X., Ma, A., 2012. Curative Activities of Township Hospitals in Weifang Prefecture, China: An Analysis of Environmental and Supply-side Determinants. Économie PubliquePublic Econ. 71–94. Ramalho, E.A., Ramalho, J.J.S., Henriques, P.D., 2010. Fractional regression models for second stage DEA efficiency analyses. J.
Product. Anal. 34, 239–255. doi:10.1007/s11123-010-0184-0
Robyn, P.J., Bärnighausen, T., Souares, A., Traoré, A., Bicaba, B., Sié, A., Sauerborn, R., 2014. Provider payment methods and health worker motivation in community-based health insurance: A mixed-methods study. Soc. Sci. Med. 108, 223–236. doi:10.1016/j.socscimed.2014.01.034
Simar, L., 2003. Detecting Outliers in Frontier Models: A Simple Approach. J. Product. Anal. 20, 391–424. doi:10.1023/A:1027308001925
Simar, L., Wilson, P.W., 2007. Estimation and inference in two-stage, semi-parametric models of production processes. J. Econom. 136, 31–64. doi:10.1016/j.jeconom.2005.07.009
Sun, Q., Liu, X., Meng, Q., Tang, S., Yu, B., Tolhurst, R., 2009. Evaluating the financial protection of patients with chronic disease by health insurance in rural China. Int. J. Equity Health 8, 42. doi:10.1186/1475-9276-8-42
Sun, Q., Santoro, M.A., Meng, Q., Liu, C., Eggleston, K., 2008. Pharmaceutical Policy In China. Health Aff. (Millwood) 27, 1042–1050. doi:10.1377/hlthaff.27.4.1042
Wagstaff, A., Lindelow, M., Jun, G., Ling, X., Juncheng, Q., 2009. Extending health insurance to the rural population: An impact evaluation of China‘s new cooperative medical scheme. J. Health Econ. 28, 1–19. doi:10.1016/j.jhealeco.2008.10.007
17
Wagstaff, A., Yu, S., 2007. Do health sector reforms have their intended impacts?: The World Bank‘s Health VIII project in Gansu province, China. J. Health Econ. 26, 505–535. doi:10.1016/j.jhealeco.2006.10.006
Wang, L., Kong, L., Wu, F., Bai, Y., Burton, R., 2005. Preventing chronic diseases in China. The Lancet 366, 1821–1824. doi:10.1016/S0140-6736(05)67344-8
Wilson, L.S.P.W., 2008. Statistical Inference in Nonparametric Frontier Models: Recent Developments and Perspectives, in: Fried, H.O., Lovell, C.A.K., Schmidt, S.S. (Eds.), The Measurement of Productive Efficiency and Productivity Change. Oxford University Press, pp. 421–521.
Xiao, Y., Zhao, K., Bishai, D.M., Peters, D.H., 2013. Essential drugs policy in three rural counties in China: What does a complexity lens add? Soc. Sci. Med. 93, 220–228. doi:10.1016/j.socscimed.2012.09.034
Yang, J., Zeng, W., 2014. The trade-offs between efficiency and quality in the hospital production: Some evidence from Shenzhen, China. China Econ. Rev. 31, 166–184. doi:10.1016/j.chieco.2014.09.005
Yip, W.C.-M., Hsiao, W.C., Chen, W., Hu, S., Ma, J., Maynard, A., 2012. Early appraisal of China‘s huge and complex health-care reforms. The Lancet 379, 833–842. doi:10.1016/S0140-6736(11)61880-1
Yip, W.C.-M., Hsiao, W., Meng, Q., Chen, W., Sun, X., 2010. Realignment of incentives for health-care providers in China. The Lancet 375, 1120–1130. doi:10.1016/S0140-6736(10)60063-3
Yip, W., Hsiao, W.C., 2009. Non-evidence-based policy: How effective is China‘s new cooperative medical scheme in reducing medical impoverishment? Soc. Sci. Med. 68, 201–209. doi:10.1016/j.socscimed.2008.09.066
You, X., Kobayashi, Y., 2009. The new cooperative medical scheme in China. Health Policy 91, 1–9. doi:10.1016/j.healthpol.2008.11.012
Yuan, Q., Tang, S., 2012. Comparative analysis of compensation model of essential drug system and its compensation mechanism research. China Med. Her. 9, 147–151.
Yu, X., Li, C., Shi, Y., Yu, M., 2010. Pharmaceutical supply chain in China: Current issues and implications for health syste m reform. Health Policy 97, 8–15. doi:10.1016/j.healthpol.2010.02.010
Zhuo, L., Zou, L., 2012. Discussion on Compensation Mechanism of Public Hospital after Cancelling Drug Price Addition. China Pharm. 23, 9–11.
18
Annex
Table A1. Descriptive statistics about explanatory variables
variable mean min max p25 p50 p75 sd staff - manning staff 4.05 -56 79 -11 0 17 24.14 Inhabitant per bed 0.10 0.03 0.70 0.07 0.10 0.11 0.07 NCMS reimbursment per OP (yuans) 20.605 8.328 57.718 12.929 17.675 23.225 10.451 Income from subsidies 140.56 0 1054.57 16.19 59.49 186.36 195.31 Proportion of subsidies in TH income 17.15 0 69.68 4.23 12.16 26.14 16.45 Subsidies per capita (yuans) 25.10 0 125.48 3.88 11.92 41.51 28.18 Proportion of licensed staff 0.39 0.11 0.66 0.33 0.39 0.45 0.10 Density of Village Health Centers 6.32 1.43 16.86 5.38 6.47 7.46 1.83 Density of covered population 0.05 0.02 0.15 0.04 0.05 0.05 0.02
Nominal values have been deflated by the General Retail Price Index in Shandong province, 2006=100 (from China Data Online)
Table A2. Comparison between DEA scores and Order-m scores in each sub-period Efficiency scores with order-m, 2006/07/08 /09
DEA <0.6 0.6<x<0.8 0.8<x<1 x=1 1<x<1.2 Total <0.6 46 18 11 4 0 79 0.6<x<0.8 0 5 12 4 5 26 0.8<x<1 0 0 4 2 3 9 x=1 0 0 0 5 1 6 Total 46 23 27 15 9 120
Efficiency scores with order-m, 2010/11/12
DEA <0.6 0.6<x<0.8 0.8<x<1 x=1 1<x<1.2 Total <0.6 39 11 8 3 1 62 0.6<x<0.8 0 4 6 0 1 11 0.8<x<1 0 0 7 0 6 13 x=1 0 0 0 1 3 4 Total 39 14 21 4 11 90
Figure A1. Evolution of the distribution of efficiency scores
0 .2 .4 .6 .8 1
2006/07/08/09
2010/11/12
DEA, 1 output order-m, 1 output
Order-m with m=200
19
Table A3. Fractional regression with DEA scores as dependent variable
(1) (2) (3) (4) (5) (6) VARIABLES DEA score DEA score DEA score DEA score DEA score DEA score
Covered population 0.095** 0.098** 0.0985** 0.099** 0.094** 0.095** -0.045 -0.045 -0.044 -0.044 -0.045 -0.045 Proportion of licensed staff -0.608 -0.583 -0.655 -0.657 -0.585 -0.598 -0.723 -0.764 -0.758 -0.757 -0.730 -0.755 Number of VHS -0.003 -0.004 -0.004 -0.004 -0.003 -0.003 -0.003 -0.003 -0.003 -0.003 -0.003 -0.003 Staff expenditures per capita 0.081*** 0.055** 0.041* 0.040* 0.079*** 0.062***
-0.021 -0.022 -0.022 -0.021 -0.021 -0.020 Test per OP -0.958** -0.958** -0.942** -0.946** -0.977** -0.975**
-0.460 -0.468 -0.464 -0.464 -0.466 -0.466 Inhabitants per bed 2006/09 1.876*** 2.007*** 1.941*** 1.941*** 1.886*** 2.006***
-0.577 -0.629 -0.635 -0.636 -0.584 -0.622 Inhabitants per bed 2010/12 1.711* 0.647 0.273 0.261 1.500 0.839 -1.006 -0.985 -1.000 -0.998 -0.980 -1.054 Proportion of subsidies in TH
income -0.585* -0.307
Subsidies per capita 0.001 -0.002
Subsidies per staff 0.025 -0.020
Subsidies per medical staff 0.024 -0.019 Proportion of subsidies in TH
expenditures -0.476*
-0.285
Subsidies per available bed -0.001 -0.021 Constant -0.075 -0.039 0.024 0.028 -0.080 -0.047 -0.405 -0.416 -0.422 -0.422 -0.409 -0.414
Observations 208 208 208 208 208 208 R2 0.751 0.745 0.747 0.747 0.749 0.745
20
Table A4 One part fractional regression with normalized order-m sores as dependent variables, and logit as link function (1) (2) (3) (4) (5) (6) VARIABLES Order-m score Order-m score Order-m score Order-m score Order-m score Order-m score Covered population 0.001 -0.017 -0.009 -0.009 0.000 -0.009 -0.070 -0.071 -0.071 -0.071 -0.070 -0.071 Proportion of licensed staff -0.794 -0.863 -0.713 -0.721 -0.747 -0.815 -1.181 -1.221 -1.221 -1.225 -1.187 -1.223 Number of VHS -0.008 -0.006 -0.007 -0.007 -0.008 -0.008 -0.006 -0.006 -0.006 -0.006 -0.006 -0.006 Staff expenditures per capita 0.148*** 0.139*** 0.135*** 0.133*** 0.145*** 0.133***
-0.037 -0.042 -0.039 -0.039 -0.037 -0.039 Test per OP -2.041*** -2.196*** -2.146*** -2.139*** -2.067** -2.105**
-0.784 -0.822 -0.821 -0.821 -0.806 -0.819 Inhabitants per bed 2006/09 7.712*** 8.264*** 8.433*** 8.430*** 7.695*** 8.495***
-2.152 -2.367 -2.432 -2.440 -2.168 -2.450 Inhabitants per bed 2010/12 9.821*** 9.043*** 9.049*** 8.978*** 9.565*** 9.738***
-2.446 -2.604 -2.648 -2.652 -2.441 -2.673 Proportion of subsidies in TH
income -1.255*** -0.461
Subsidies per capita -0.004 -0.003
Subsidies per staff -0.0377* -0.022
Subsidies per medical staff -0.032 -0.021 Proportion of subsidies in TH
expenditures -1.169*** -0.438
Subsidies per available bed -0.0485* -0.028 Constant 1.267* 1.260* 1.182 1.188 1.234* 1.232 -0.737 -0.759 -0.763 -0.764 -0.738 -0.764
Observations 208.000 208.000 208.000 208.000 208.000 208.000 R2 0.826 0.821 0.820 0.820 0.825 0.821
21
Table A5. Statistics about the cost of healthcare in 2012
Average burden of TH expenses
Mean user fees for 1 IP case in TH (yuans)
Mean user fees for 1 OP case in TH (yuans)
Mean user fees for 1 OP case in VHS (yuans)
Rural net income (yuans) Anqiu 0.42% 17.03 28.34 35.99 10773 Changle 0.31% 23.05 13.07 37.24 11576 Changyi 0.23% 21.24 6.28 27.93 11842 Gaomi 0.29% 21.77 11.89 48.05 11774 Linqu 0.22% 8.75 13.94 11.25 10512 Qinzhou 0.12% 6.28 7.41 64.62 11797 Shouguang 0.23% 11.59 18.10 67.39 12805 Zhucheng 0.44% 22.23 33.81 51.57 12804
NB: those figures were reconstructed using actual reimbursements by NCMS bureaus and reimbursement rates to estimate the mean cost of a case, and the user fee that is the difference between the two elements. Nominal values have been deflated by the General Retail Price Index in Shandong province, 2006=100 (from China Data Online)
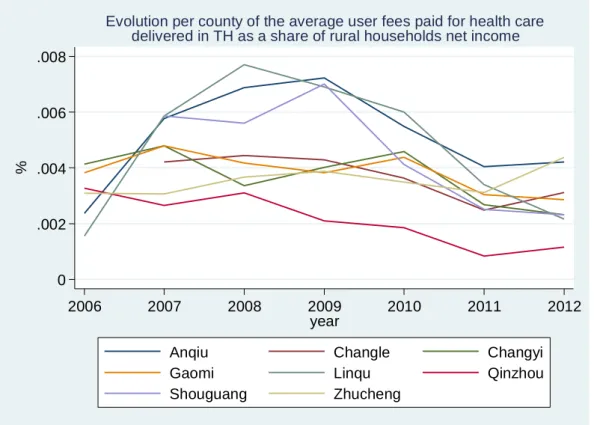
Figure A2. Evolution per county of the average user fees paid for health care delivered in TH as a share of rural households net income
Nominal values have been deflated by the General Retail Price Index in Shandong province, 2006=100 (from China Data Online) 0 .002 .004 .006 .008 % 2006 2007 2008 2009 2010 2011 2012 year
Anqiu Changle Changyi
Gaomi Linqu Qinzhou
Shouguang Zhucheng
Evolution per county of the average user fees paid for health care delivered in TH as a share of rural households net income