HAL Id: hal-00218344
https://hal.archives-ouvertes.fr/hal-00218344
Submitted on 27 Jan 2008
HAL is a multi-disciplinary open access archive for the deposit and dissemination of sci-entific research documents, whether they are pub-lished or not. The documents may come from teaching and research institutions in France or abroad, or from public or private research centers.
L’archive ouverte pluridisciplinaire HAL, est destinée au dépôt et à la diffusion de documents scientifiques de niveau recherche, publiés ou non, émanant des établissements d’enseignement et de recherche français ou étrangers, des laboratoires publics ou privés.
NMR-guided fragment-based approach for the design of
tRNA(Lys3) ligands.
Florence Chung, Carine Tisné, Thomas Lecourt, Frédéric Dardel, Laurent
Micouin
To cite this version:
Florence Chung, Carine Tisné, Thomas Lecourt, Frédéric Dardel, Laurent Micouin. NMR-guided fragment-based approach for the design of tRNA(Lys3) ligands.. Angewandte Chemie International Edition, Wiley-VCH Verlag, 2007, 46 (24), pp.4489-91. �10.1002/anie.200605201�. �hal-00218344�
RNA recognition
DOI: 10.1002/anie.200123456
NMR-guided fragment-based approach for the design of tRNALys3 ligands.
∗∗
Florence Chung, Carine Tisné,∗ Thomas Lecourt, Frédéric Dardel∗ and Laurent Micouin∗
RNA is a key player in many cellular processes or in viral infection and is thus an attractive target in drug discovery.[1] The
clinical utility of antibiotic drugs targeting the bacterial ribosome has demonstrated that RNA can indeed be a relevant target.[2]
Among other druggable RNAs, functional sites within the genomic RNA of HIV-1, such as TAR, RRE or the dimerisation initiation site, have been selected as possible targets for new anti-viral strategies.[3]
Like all retroviruses, HIV-1 uses a cellular tRNA, tRNA Lys 3 for
priming reverse transcription.[4] In virions, the 18 3'-terminal
nucleotides of tRNALys
3 are base-paired to the genomic RNA. This
complex in turn specifically recruits the reverse transcriptase.[5] The
aim of this study was to find molecules that bind to tRNALys 3 and
serve as leads for inhibitors of the formation of the HIV-1 reverse transcription initiation complex. Indeed, destabilisation of this process by oligodeoxyribonucleotides has been reported to result in an efficient inhibition of reverse transcription, providing the proof of concept of a possible new antiviral strategy.[6]
Despite recent breakthroughs in the understanding of the interaction between aminoglycosides and ribosomal RNAs,[7] the de novo design of new compounds that specifically bind to structured
RNAs is still a standing challenge. A recent promising approach for the synthesis of shape-specific 2-deoxystreptamine (2-DOS) dimers that can bind selectively to RNA loops has been reported.[8]
Rational design of selective tRNALys
3 binder is however difficult
because of the lack of known ligands[9] and of its shape-similarity to
other tRNAs.A combinatorial approach only led to low-affinity structure-specific peptidic ligands.[10] However, the availability of
crystallographic[11] and NMR data[12,13] and of an efficient
expression systemmade it possible to undertake a fragment-based
[∗] Dr. C. Tisné, Prof. F. Dardel
Cristallographie et RMN Biologiques, Université Paris Descartes, CNRS, 4 avenue de l'Observatoire, 75006 Paris (France)
Fax: (+33) 1 53 73 99 25
E-mail: carine.tisne@univ-paris5.fr F. Chung, Dr. T. Lecourt, Dr. L. Micouin
Chimie Thérapeutique, Université Paris Descartes, CNRS, 4 avenue de l'Observatoire, 75006 Paris (France)
Fax: (+33) 1 43 29 14 03
E-mail: laurent.micouin@univ-paris5.fr
[∗∗] FC is supported by a studenship from Ministère de la Recherche. This work was supported by ANRS, CNRS and Ministère de le Recherche.
Supporting information for this article is available on the WWW
approach.[14] We used NMR screening[15] to identify ligands from
spectral changes induced by their binding on the target.[16] A
primary screen was performed over a focussed collection of 50 in-house or commercial organic compounds using 1D NMR on the RNA imino proton window (10-15 ppm), which is devoid of ligand signals. As result, compounds 1 and 2 were detected to bind to tRNALys
3 (Figure 1).
Figure 1. Binding of a) compound 1 (2.1 mM) and b) kynuramine 2
(0.6 mM) to tRNALys3 monitored by NMR chemical shift perturbation of
the RNA imino protons (top spectra). Bottom: reference tRNALys3
spectrum (0.3 mM).
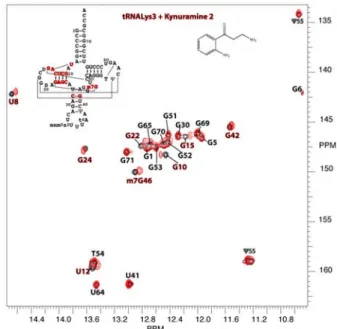
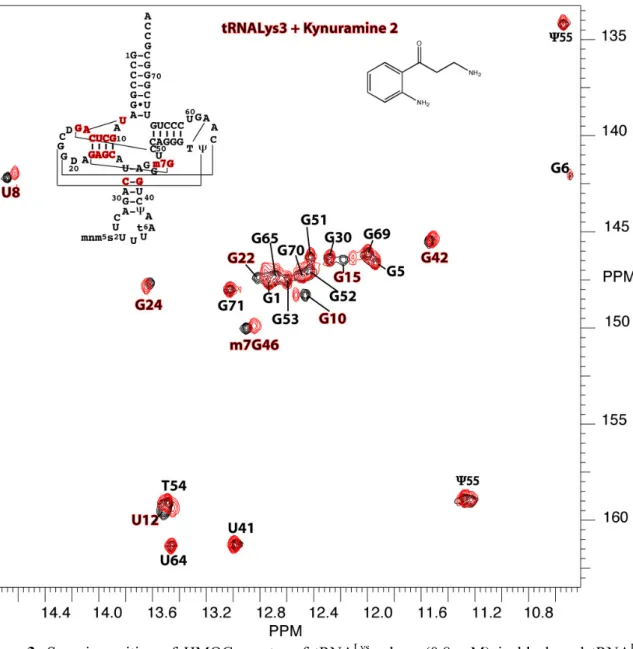
Their NMR footprints on the target were then determined on 2D HMQC spectra using 15N-labeled tRNA. Kynuramine 2 interacts
with the D-stem (Figure 2), and 1 exhibits binding to at least two specific sites located in the T and D-stems.[17] From NMR titrations,
the apparent dissociation constants of 1 and 2 for tRNALys 3 were
estimated to be 2mM and 5mM, respectively.
Figure 2. Superimposition of HMQC spectra of tRNALys
3 alone (0.8
mM) in black and tRNALys3 mixed with compound 2 (1.6 mM) in red.
A qualitative specificity study was conducted with these two compounds by analysing their NMR footprints with two other tRNAs: E. coli tRNAfMet and tRNAmMet. 1 binds to both tRNA
which have very similar T-arms sequences. Interestingly, 2 only binds to the D-arm of tRNAmMet, showing that this compound,
despite its moderate affinity, appears to interact in a sequence-specific manner with tRNAmMet and tRNALys3 with identical
D-was improved when the aniline moiety D-was changed for other heterocycles, except for compounds 4, 12 and 16. Reduction of the carbonyl function to the corresponding alcohol led to the loss of interaction. Binding of 3 was not improved by introduction of an extra nitrogen atom on the side chain (compound 13).
Ar = 2-NO2Ph Ar = 4-MeOPh Ar = 2-Furyl Ar = 2-Thienyl 4 5 6 7 Ar = 1-thiazolyl 8 O Ar a O Ar NMe2 Ar = 2-(N-Me)pyrrole Ar = 2-pyridyl Ar = 2-naphtyl 9 10 11 b O Ar NR 1 R2 c Ar = 2-NO2Ph, R1,R2 = (CH2CH2)2O Ar = Ph, R1 = Me, R2 = CH 2CH2NMe2 Ar = 2-Furyl, R1 = Me, R2 = CH 2CH2NMe2 12 13 14 Ar = Ph 3 O Ar' NR1 R2 Ar' = 2-NH2Ph, R1,R2 = (CH2CH2)2O Ar' = 2-NH2Ph, R1 = R2 = Me 15 16
Scheme 1. a) (CH2O)n, Me2NH.HCl, 35% aq. HCl, EtOH, Δ then
K2CO3; b) CH3I, CH2Cl2, r.t., then R1R2NH, CH3Cl, 60 °C; c) H2, Pd/C,
MeOH.
The fluorescent properties (λexc = 341 nm, λem = 478 nm) of
compound 11 were used to estimate its dissociation constant to tRNALys
3 (Kd = 191 ± 86 μM), and its binding to tRNALys3 D-arm
was confirmed by a 2D TROSY experiment.
The next step was to attempt to covalently link the two ligands in order to improve binding. 1 is a 2-DOS surrogate and hence an “RNA-friendly” compound, which probably binds to several sites on tRNA. As evidenced by the discrete NMR shifts, this multiple binding is nevertheless specific, resulting from the constrained amine geometry, a situation already described for 2-DOS with 16S ribosomal RNA.[18] This can be considered as an advantage for our
strategy, as it should improve the chances to get a productive linkage. BocHN NHBoc O Ar O Br a Ar O N3 b Ar O N N N O NHBoc BocHN c Ar O N N N O NH2 H2N Ar : S N O N N S S N 17 a-h a b c d e f g h
Scheme 2. a) NaN3, H2O/Acetone; b) CuSO4, sodium ascorbate; c)
HCl, MeOH then amberlyst resin, then NH MeOH.
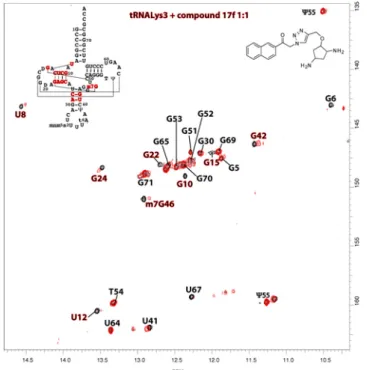
A library of connected fragments was prepared using a one-pot procedure leading to compounds 17a-h in 6-66% overall yield after a catch-and-release purification on sulfonic acid resin (Scheme 2). Binding of these compounds to tRNALys
3 was then monitored in a
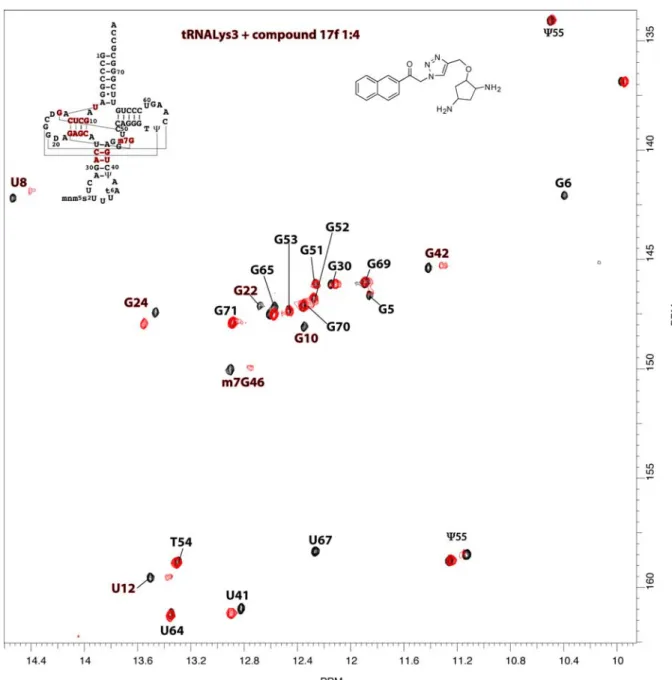
TROSY experiment, showing improved affinity and specificity with the D-arm region (Figure 3 for 17f) under stoichiometric conditions.
Figure 3. Superimposition of TROSY spectra of tRNALys3 alone (0.3
mM) in black and tRNALys
3 mixed with compound 17f (0.3 mM) in red.
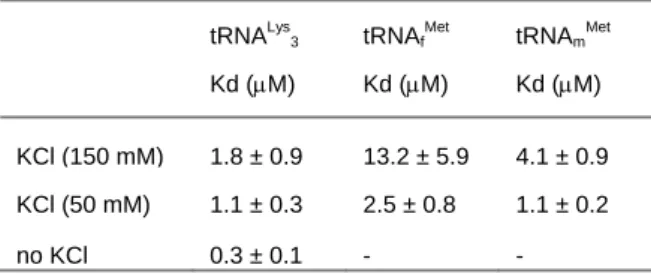
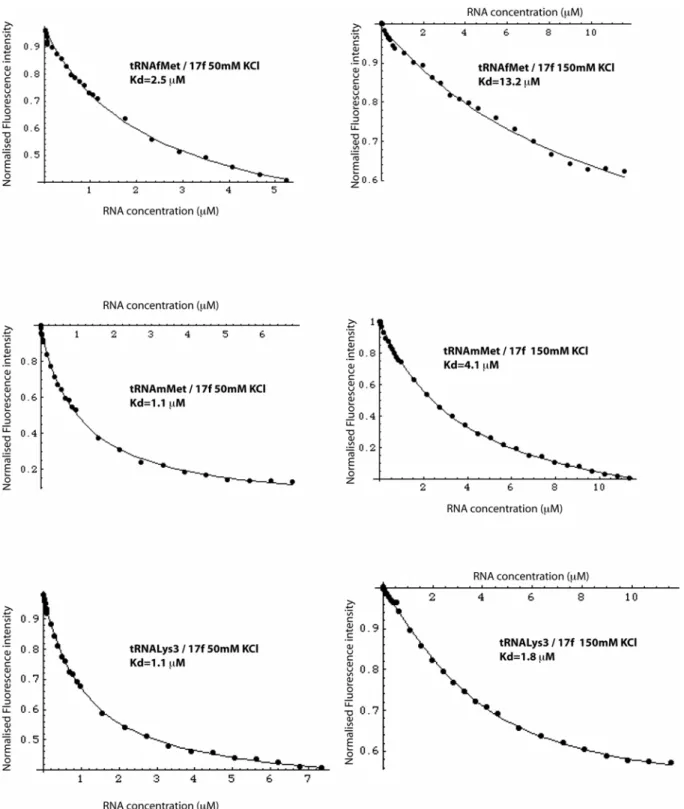
Fluorescence binding assays were then conducted on tRNALys 3,
tRNAmMet and tRNAfMet leading to a Kd of 1.8 μM for compound
17f with tRNALys3, at physiological ionic strength. Interestingly,
compound 17f exhibited a significant sequence selectivity for the D-arm of tRNALys
3 and tRNAmMet against that of tRNAfMet (Table 1
and Figure 4). This specificity is correlated with a reduced ionic-strength dependence of the interaction with tRNALys
3. The strong
ionic-dependence of the affinity to tRNAfMet reflects poorly
selective binding, dominated by electrostatic effects.[19]
Figure 4. Sequence and secondary structure of the various tRNA
Table 1. Dissociation constants of compound 17f for three different
tRNA at various ionic strengths.
tRNALys3 Kd (μM) tRNAf Met Kd (μM) tRNAm Met Kd (μM) KCl (150 mM) 1.8 ± 0.9 13.2 ± 5.9 4.1 ± 0.9 KCl (50 mM) 1.1 ± 0.3 2.5 ± 0.8 1.1 ± 0.2 no KCl 0.3 ± 0.1 - -
In conclusion, a selective ligand of tRNALys
3 with micromolar
dissociation constant has been synthesised for the first time. This study outlines the power of a fragment-based strategy in the field of RNA-ligand discovery, providing potential lead compounds for antiviral drug development. The use of compound 17f as an inhibitor of reverse transcription in cell-free assays will be investigated. Beside this important application, this work provides new information on the design of small RNA interacting molecules. This step is crucial for achieving a challenging goal: the cellular regulation at RNA level by small molecular effectors.
[1] G. J. R. Zaman, P. J. A. Michiels, C. A. A. Van Boeckel, Drug.
Discov. Today 2003, 8, 297-206.
[2] a) E. Westhof, Biochimie 2006, 88, 931-933; b) J. Poehlsgaard, S. Douthwaite, Nat. Rev. Microbiol. 2005, 3, 870-881.
[3] N. W. Luedtke, Y. Tor in Small Molecule DNA and RNA
Binders: From Synthesis to Nucleic Acic Complexes (Eds.: M.
Demeunynck, C. Bailly, W. D. Wilson), Wiley-vch, Weinheim
2003, vol. 1.
[4] R. Marquet, C. Isel, B. Ehresmann, Biochimie 1995, 77, 113-124.
[5] Z. Zhang, S. M. Kang, C. D. Morrow, AIDS Res. Hum.
Retroviruses 1998, 14, 979-988.
[6] X. Wei, M. Götte, M. A Wainberg, Nucleic Acid Res. 2000, 28, 3065-3074.
[7] B. François, R. J. M. Russel, J. B. Murray, F. Aboul-ela, B. Masquida, Q. Vincens, E. Westhof, Nucleic Acid Res. 2005, 33, 5677-5690 and references therein.
[8] a) X. Liu, J. R. Thomas, P. J. Hergenrother, J. Am. Chem. Soc.
2004, 126, 9196-9197; b) J. R. Thomas, X. Liu, P. J.
Hergenrother, J. Am. Chem. Soc. 2005, 127, 12434-12435; c) J. R. Thomas, X. Liu, P. J. Hergenrother, Biochemistry 2006, 45, 10928-10938.
[9] A few studies on the interaction between aminoglycoside derivatives and tRNAPhe are available: a) S. R. Kirk, Y. Tor,
Bioorg. Med. Chem. 1999, 7, 1979-1991; b) R. Szilaghi, S.
Shahzad-Ul-Hussan, T. Weimar, ChemBioChem 2005, 6, 1270-1276; c) N. E. Mikkelsen, K. Johansson, A. Virtanen, L. A. Kirsebom, Nat. Struc. Biol. 2001, 8, 510-514.
[10] C. Tisné, F. Guillière, F. Dardel, Biochimie 2005, 87, 885-888. [11] P. Benas, G. Bec, G. Keith, R. Marquet, C. Ehresmann, B.
Ehresmann, P. Dumas, RNA 2000, 6, 1347-1355.
[12] C. Tisné, B. P. Roques, F. Dardel, J. Mol. Biol. 2001, 443-454 [13] C. Tisné, B. P. Roques, F. Dardel., J. Biol. Chem. 2004, 279
3588-3595.
[14] a) D. C. Ress, M. Congreve, C. W. Murray, R. Carr, Nature Rev.
Drug. Disc. 2004, 3, 660-672; b) D. A. Erlanson, R. S.
McDowell, T. O'Brien, J. Med. Chem. 2004, 47, 3463-3482. [15] For NMR-guided discovery of RNA binders, see: a) L. Yu, T. K.
Oost, J. M. Schkeryantz, J. Yang, D. Janowick, S. W. Fesik, J.
Am. Chem. Soc. 2003, 125, 4444-4450; b) M. Mayer, T. L.
James, J. Am. Chem. Soc. 2004, 126, 4453-4460.
[16] This "target-observe" strategy (as opposed to ligand-observe schemes such as saturation transfer) is essential to filter-out promiscuous binders which inevitably arise through non-specific electrostatic interactions with the highly charged nucleic acid. Promiscuous binders cause a general broadening of the NMR spectrum of the target, whereas specific binders induce only a peak shifts which further allow the identification of the binding site. For a general review, see: H. O. Villar, J. Yan, M. R. Hansen, Curr. Opin. Chem. Biol. 2004, 8, 387-391.
[17] Not surprisingly, aminoglycosides (neomycin and kanamycin) were also detected as tRNALys
3 ligands. They are however too
complex for a fragment-based approach. On the contrary, compound 1 is an excellent 2-deoxystreptamine surrogate in the design of "RNA-friendly" compounds: L. Micouin, F. P. Dardel, C. Tisne-Vicrobeck, F. Maurice, M. Bonin, A. Perez Luna, C. J. Bournaud, G. Bégis, WO2006024784. [18] a) S. Yoshizawa, D. Fourmy, R.G. Eason, J.D. Puglisi,
Biochemistry 2002, 41, 6263-6270 and ref. 7.
[19] Both enantiomerically enriched (e.r. = 93/7) isomers of compound 17f were prepared and individually studied, leading to Kd = 1.2 ± 0.6 μM for (R)-17f and Kd = 1.1 ± 0.7 μM for
(S)-17f at 150 mM KCl. Interaction with tRNALys
3 is thus not
stereospecific and racemic ligands can be used in this approach. For the enantioselective preparation of 1, see: a) A. Pérez Luna, M.-A. Ceschi, M. Bonin, L. Micouin, H.-P. Husson, S. Gougeon, G. Estenne Bouthou, B. Marabout, M. Sevrin, P. George, J. Org. Chem. 2002, 67, 3522-3524; b) A. Pérez Luna, M. Bonin, L. Micouin, H.-P. Husson, J. Am. Chem. Soc. 2002,
124, 12098-12099.
Received:
Published online on
Keywords: RNA recognition · tRNA · aminoglycoside mimics · Drug
design · Fragment-based synthesis
RNA recognition
Florence Chung, Carine Tisné,* Thomas Lecourt, Frédéric Dardel* and Laurent Micouin*
NMR-guided fragment-based approach for the design of tRNALys3
ligands
An NMR-guided fragment-based approach has been used for the synthesis of a micromolar tRNALys3
D-stem binder from two millimolar ligands detected by flow-injection NMR screening. N N N O NH2 NH2 H2N NH2 HO 5 mM 2 mM 1.8 μM O NH2 H2N O
Supporting information
NMR-guided fragment-based approach for the design of tRNA
Lys3ligands
Florence Chung, Carine Tisné,
*Thomas Lecourt, Frédéric Dardel*
and Laurent Micouin*
Chemistry
Compound 1 and its N-Boc derivative were prepared according to reported procedures.[1] Kynuramine
2 was purchased from Sigma.
Typical procedure for the synthesis of Mannich Base:
Paraformaldehyde (1.43 g, 1 equiv.), dimethylamine hydrochloride (11.64 g, 3 equiv.) and acetophenone (13 mL, 2.3 equiv.) were dissolved in ethanol (10 mL). Hydrochloric acid 35% (0.2 mL) was added and the mixture refluxed for 5 hours. The yellowish solution was diluted with cold acetone (50 mL) and chilled for several hours at 0 °C. The crystals were filtrated, washed with acetone (2x20 mL), dissolved in water (20 mL) and then extracted in ethyl acetate (2x35 mL). The aqueous layer was treated with potassium carbonate (pH=10) and extracted in ethyl acetate (5x35 mL). The organic phases were dried over sulphate magnesium and concentrated under reduced pressure to give the Mannich base as an oil (77%).
O NMe2 3 1 H NMR δ 2.19 (s, 6H), 2.66 (t, 2H, J = 7.3 Hz), 3.05 (t, 2H, J = 7.3 Hz), 7.35 (t, 2H, J = 7.4 Hz), 7.44 (t, 1H, J = 7.4 Hz), 7.86 (d, 2H, J = 7.1 Hz); 13C NMR δ 36.9, 45.5, 54.4, 128.1, 128.6, 133.0, 137.0, 199.0, MS (ESI): 178 [M+H]+. O NMe2 4 NO2 1 H NMR (CDCl3) δ 2.21 (s, 6H), 2.70 (t, 2H, J = 7.2 Hz), 2.94 (t, 2H, J = 7.2 Hz), 7.42 (dd, 1H, J = 7.5, 1.3 Hz), 7.58 (td, 1H, J = 7.5, 1.3 Hz), 7.70 (td, 1H, J = 7.5, 1.0 Hz), 8,1 (dd, 1H, J = 7.5, 1.0 Hz); 13C NMR (CDCl3) δ 41.3, 45.3, 54.2, 124.4, 127.7, 130.5, 134.4, 138.0, 145.6, 201.8; MS (ESI): 223 [M+H]+.
O NMe2 5 MeO 1 H NMR (CDCl3) δ 2.25 (s, 6H), 2.73 (t, 2H, J = 7.4 Hz), 3.08 (t, 2H, J = 7.4 Hz), 3.13 (s, 3H), 6.89 (d, 2H, J = 8.9 Hz), 7.90 (d, 2H, J = 8.9 Hz); 13C NMR (CDCl3) δ 36.0, 45.0, 54.1, 55.0, 113.2-113.3, 129.6-129.9, 130.1, 163.0, 196.9; MS (ESI): 208 [M+H]+. O NMe2 6 O 1 H NMR (CDCl3) δ 2.17 (s, 6H), 2.64 (t, 2H, J = 7.3 Hz), 2.91 (t, 2H, J = 7.3 Hz), 6.45 (dd, 1H, J = 3.5, 1.6 Hz), 7.12 (d, 1H, J = 3.5 Hz), 7.51 (d, 1H, J = 1.6 Hz); 13C NMR (CDCl3) δ 36.7, 45.4, 54.2, 112.3, 117.1, 146.4, 152.7 188.2; MS (ESI): 168 [M+H]+. O NMe2 7 S 1 H NMR (CDCl3) δ 2.10 (s, 6H), 2.61 (t, 2H, J = 7.3 Hz), 2.95 (t, 2H, J = 7.3 Hz), 6.99 (dd, 1H, J = 4.9, 3.8 Hz), 7.49 (dd, 1H, J = 4.9, 0.9 Hz), 7.60 (dd, 1H, J = 3.8, 0.9 Hz); 13C NMR (CDCl3) δ 37.6, 45.4, 54.5, 128.2, 131.9, 133.7, 144.3, 191.9; MS (ESI): 184 [M+H]+. O NMe2 8 N S 1 H NMR (CDCl3) δ 2.25 (s, 6H), 2.77 (t, 2H, J = 7.1 Hz), 3.30 (t, 2H, J = 7.1 Hz), 7.65 (d, 1H, J = 3.1 Hz), 7.97 (d, 1H, J = 3.1 Hz); 13C NMR (CDCl3) δ 36.6, 45.3, 54.0, 126.3, 144.7, 167.0, 192.8; MS (ESI): 185 [M+H]+. O NMe2 9 NMe 1 H NMR (CDCl3) δ 2.26 (s, 6H), 2.69 (t, 2H, J = 7.4 Hz), 2.94 (t, 2H, J = 7.4 Hz), 3.9 (s, 3H), 6.11 (dd, 1H, J = 4.1, 2.4 Hz), 6.78 (dd, 1H, J = 2.4, 1.6 Hz), 6.97 (dd, 1H, J = 4.1, 1.6 Hz); 13C NMR (CDCl3) δ 37.2, 45.4, 55.1, 107.9, 119.2, 130.7, 131.1, 189.8; MS (ESI): 181 [M+H]+.
O NMe2 10 N 1 H NMR (CDCl3) δ 2.29 (s, 6H), 2.78 (t, 2H, J = 7. 2 Hz), 3.40 (t, 2H, J = 7.2 Hz), 7.47 (td, 1H, J = 7.7, 1.1 Hz), 7.83 (td, 1H, J = 7.7, 1.7 Hz), 8.05 (dd, 1H, J = 7.7, 1.1 Hz), 8.68 (dd, 1H, J = 7.7, 1.7 Hz); 13C NMR (CDCl3) δ 35.8, 45.5, 54.5, 121.9, 127.2, 136.9, 149.0, 153.4, 200.7; MS (ESI): 179 [M+H]+. O NMe2 11 1 H NMR (CDCl3) δ 2.47 (s, 6H), 3.02 (t, 2H, J = 7.3 Hz), 3.46 (t, 2H, J = 7.3 Hz), 7.59 (m, 2H), 7.89 (m, 2H), 8.01 (m, 2H), 8.52 (s, 1H); 13C NMR (CDCl3) δ 37.0, 45.6, 54.5, 123.8, 126.8, 127.8, 128.5, 129.6, 129.7, 132.5, 134.2, 135.6, 199.0; MS (ESI): 228 [M+H]+.
Typical procedure for transamination
Compound 3 (213 mg, 1 equiv.) and methyl iodide (374 µL, 5 equiv.) were dissolved in dichloromethane (4 mL) and stirred at room temperature for 3 hours. The mixture was concentrated, dissolved in chloroform (4 mL) and stirred with N,N,N’-trimethylethyldiamine (305 μL, 2 equiv.) at 60 °C for 18 hours. The crude product was washed with AcOEt (10 mL), H2O (2x 25 mL) and dried
over MgSO4. Purification by silica gel column chromatography (AcOEt/MeOH (98/2), AcOEt/MeOH
(95/5), AcOEt/MeOH (90/10)) afforded the compound (24%).
O N Me 13 NMe2 1 H NMR (CDCl3) δ 2.23 (s, 6H), 2.31 (s, 3H), 2.42-2.54 (2t, 4H, J = 6.8 Hz), 2.87 (t, 2H, J = 7.4 Hz), 3.18 (t, 2H, J = 7.4 Hz), 7.47 (t, 2H, J = 7.4 Hz), 7.55 (t, 1H, J = 7.4 Hz), 7.97 (d, 2H, J = 7.4 Hz); 13 C NMR (CDCl3) δ 36.3, 42.4, 45.6, 52.7, 55.3, 57.1, 127.9, 128.5, 133.0, 136.9, 199.3; MS (ESI): 235 [M+H]+.
O N NO2 O 12 1 H NMR (CDCl3) δ 2.44 (d, 4H, J = 4.5 Hz), 2.79 (t, 2H, J = 7.0 Hz), 2.98 (t, 2H, J = 7.0 Hz), 3.67 (d, 4H, J = 4.5 Hz), 7.46 (dd, 1H, J = 7.5, 1.3 Hz), 7.61 (td, 1H, J = 7.5, 1.3 Hz), 7.73 (td, 1H, J = 7.5, 1.0 Hz), 8.14 (dd, 1H, J = 7.5, 1.0 Hz); 13C NMR (CDCl3) δ 40.2, 53.4, 66.8, 124.2, 127.6, 130.4, 134.2, 138.0, 180.9, 201.6; MS (ESI): 265 [M+H]+. O N Me 14 NMe2 O 1 H NMR (CDCl3) δ 2.21 (s, 3H), 2.25 (s, 6H), 2.46-2.48 (2 t, 4H, J = 9.7 Hz), 2.78 (t, 1H, J = 7.2 Hz), 2.95 (t, 1H, J = 7.2 Hz), 6.46 (dd, 1H, J = 3.6, 1.7 Hz), 7.15 (dd, 1H, J = 3.6, 0.6 Hz), 7.52 (dd, 1H, J = 1.7, 0.6 Hz); 13C NMR (CDCl3) δ 36.1, 42.4, 45.6, 52.5, 55.0, 56.9, 112.4, 117.6, 146.8, 152.7, 188.6; MS (ESI): 225 [M+H]+.
Typical procedure for nitro reduction
Compound 4 hydrochloride (69 mg, 0.27 mmol) was dissolved in methanol (4 mL) and stirred with 10% palladium hydroxide (7 mg) under H2 atmosphere for 2 hours. The mixture was filtrated
through celite and concentrated under vacuum (92%).
O NMe2 15 NH2 1 H NMR (CD3OD) δ 2.94 (s, 6H), 3.53 (m, 4H), 6.61 (td, 1H, J = 7.1, 0.9 Hz), 6.79 (dd, 1H, J = 7.1, 0.9 Hz), 7.27 (td, 1H, J = 7.1, 1.4 Hz), 7.78 (dd, 1H, J = 7.1, 1.4 Hz); 13C NMR (CD3OD) δ 34.6, 42.8, 52.7, 124.7, 134.8, 198.8; MS (ESI): 193 [M+H]+. O N 16 NH2 O 1 H NMR (CD3OD) δ 2.54 (t, 4H, J = 4 Hz), 2.83 (t, 2H, J = 7.2 Hz), 3.17 (t, 2H, J = 7.2 Hz), 3.73 (t, 4H, J = 4 Hz), 6.65 (m, 2H), 7.27 (td, 1H, J = 7.0, 1.3 Hz), 7.74 (dd, 1H, J = 7.0, 1.3 Hz); 13C NMR
(CD3OD) δ 36.0, 53.1,54.0, 66.9, 115.8, 117.4, 131.0, 134.4, 150.4, 178.8, 201.1; MS (CI): 235 [M+H]+.
Protected diaminocyclopentanol (100 mg, 0.32 mmol) and propargyl bromide (105 μL, 0.96 mmol) were dissolved in 2.5 mL of anhydrous THF under argon atmosphere at 0 °C. After the slow addition of KHMDS (0.5M in toluene, 640 μL, 0.32 mmol) the mixture was stirred at room temperature for 18 hours. H2O (10 mL) was then added and the crude was extracted by EtOAc (2x 25 mL). The organic
phases were washed with brine and dried with MgSO4. After purification by silica gel column
chromatography (EtOAc:Cyclohexane 20:80, 30:70) the product was obtained as an oil (60%).
O BocHN NHBoc 1 H NMR (CDCl3) δ 1.47 (brs, 19H), 1.93 (m, 1H), 2.04 (m, 1H), 2.42 (t, 1H, J = 2.4 Hz), 2.52 (dt, 1H, J = 13.9 Hz, 8.2 Hz), 3.82 (m, 1H), 4.01 (m, 2H), 4.20 (m, 2H), 4.98 (m, 1H), 5.19 (m, 1H); 13C NMR (CDCl3) δ 28.5, 37.1, 49.3, 55.9, 56.7, 74.3, 79.5, 80.1, 83.5, 155.4; MS (ESI): 377 [M+Na]+.
Typical procedure for the synthesis of triazoles:
α-bromo-2’-acetonaphtone (225 mg, 2 equiv.) and sodium azide (61 mg, 2.05 equiv.) were stirred at room temperature in a 1/2 water/acetone mixture (4.5 mL) for 1 hour. Alkyne (160 mg, 1 equiv.) in acetone (1.5 mL) was then added, followed by the addition of sodium ascorbate (0.5 equiv.) and copper sulfate (0.5 equiv.). The resultant mixture was then stirred at room temperature until complete consumption of the alkyne (2 days) monitored by TLC (AcOEt:Cyclohexane 1:1). The precipitate was filtrated, rinsed with water and dried under vacuum. The crude product was then stirred for 1 hour in a 2M solution of methanolic hydrochloride (6 mL). After evaporation of the solvent, Amberlyst 15 resin (380 mg, 4 equiv.) and MeOH (6 mL) were added and stirred overnight. The resin was filtrated, rinsed with MeOH (5x5 mL), and stirred for 3 hours in a 2M solution of methanolic ammonia (6 mL). The resin was filtrated and rinsed with MeOH. Evaporation of the organic phase led to compound 17f as an oil (46%). O H2N NH2 N N N O 17f 1 H NMR (CD3OD) δ 1.23 (dt, 1H, J = 12.8, 8.5 Hz), 2.00 (m, 1H), 1.85 (m, 1H), 2.32 (dt, 1H, J = 12.8, 6.7 Hz), 3.19 (m, 1H), 3.43 (m, 1H), 3.79 (m, 1H), 4.65 (2d, 2H, J = 12.3 Hz), 7.62-7.71 (m, 2H),
126.9, 127.6, 128.5, 128.9, 129.5, 130.2, 131.5, 132.5, 136.1, 144.9, 191.4; HRMS (ESI) m/z calcd for C20H24N5O2 [M+H]+: 366.1930. Found: 366.1921. O H2N NH2 N N N O S N 17a 1 H NMR (CD3OD) δ 1.95 (m, 1H), 2,35 (m, 2H), 2.78 (m, 1H), 3.73(m, 1H), 3.91 (m, 1H), 4.47 (m, 1H), 4.90 (2d, 2H, J = 12,6 Hz), 6.41 (m, 2H), 8.11 (m, 1H), 8.30 (m, 1H), 8.50-8.40 (m, 2H), 8.53 (m, 1H), 8.72 (m, 1H), 8.91 (m, 1H); 13C NMR (CD3OD) δ 32.7, 34, 48.5, 55.1, 57, 61.5, 80.5, 125.7, 126.4, 132.0, 134.8, 140.6, 142.4, 144.9, 147.3, 184; MS (ESI): 399 [M+H]+. O H2N NH2 N N N O N N 17b 1 H NMR (400 MHz, CD3OD, 50°C) δ 2.07 (m, 1H), 2.57 (m, 2H), 2.80 (s, 3H), 3.00 (dt, J = 13.6, 6.9 Hz), 3.94 (m, 1H), 4.13 (m, 1H), 4.69 (m, 1H), 5.11 (2d, 2H, J = 12.9 Hz), 6.32 (s, 2H), 7.74-7.83 (m, 5H), 8.62 (s, 2H); 13C NMR (75 MHz, CD3OD) δ 11.1, 32.6, 33.9, 47.2, 55.0, 57.0, 61.5, 80.3, 117.4,
125.5, 129.3, 134.0, 141.0, 144.6, 185.4; HRMS (ESI) m/z calcd for C20H26N7O2 [M+H]+: 396.2148.
Found: 396.2172. 17c O H2N NH2 N N N O 1 H NMR (CD3OD) δ 1.21 (dt, 1H, J = 13 Hz, 8.5 Hz), 1.83 (m, 1H), 2.01 (m, 1H), 2.33 (dt, 1H, J = 13.0, 6.5 Hz), 3.20 (m, 1H), 3.43 (m, 1H), 3.80 (m, 1H), 4.66 (2d, 2H, J = 12.3 Hz), 7.47 (m, 3H), 7.71 (m, 2H), 7.83 (m, 2H), 8.03 (s, 1H), 8.15 (m, 2H); 13C NMR (CD3OD) δ 38.8, 41.0, 48.5, 57, 62.1, 86.0, 125.5, 127.1, 126.9, 128.3, 128.8, 128.6, 132.8, 139.3, 144.9, 146.8, 191.0; HRMS (ESI) m/z calcd for C22H26N5O2 [M+H]+: 392.2087. Found: 392.2103.
O H2N NH2 N N N O S 17d 1 H NMR (CD3OD) δ 1.17 (dt, 1H, J = 13.0, 8.7 Hz), 1.78 (m, 1H), 1.97 (m, 1H), 2.31 (dt, 1H, J = 13.0, 6.5 Hz), 3.15 (m, 1H), 3.38 (m, 1H), 3.76 (m, 1H), 4.65 (2d, 2H, J = 12.2 Hz), 7.29 (dd, 1H, J = 4.9, 3.7 Hz), 7.98 (d, 1H, J = 4.9 Hz), 8.06 (s, 1H), 8.09 (d, 1H, J = 3.7 Hz); 13C NMR (75 MHz, CD3OD) δ 39.1, 41.4, 49.1, 57.0, 62.0, 86.2, 125.5, 128.5, 133.7, 135.5, 140.3, 144.9, 184.5; HRMS
(ESI) m/z calcd for C14H20N5O2S [M+H]+: 322.1338. Found: 322.1307.
O H2N NH2 N N N O N O 17e 1 H NMR (CD3OD, 50°C) δ 2.18 (m, 1H), 2.55 (m, 2H), 3.00 (m, 1H), 3.10 (s, 3H), 3.92 (m, 1H), 4.13 (m, 1H), 4.67 (m, 1H), 5.06 (d+m, 2H, J = 12.7 Hz), 5.75 (s, 2H), 7.98 (m, 3H), 8.41 (m, 2H), 8.64 (s, 1H); 13C NMR (CD3OD) δ 12.8, 29.3, 33.9, 49.5, 55.0, 58.3, 61.9, 80.0, 114.3, 126.8, 128.6, 129.1,
143, 130.2, 161.7, 176.7, 185.6; HRMS (ESI) m/z calcd for C20H25N6O3 [M+H]+: 397.1988. Found:
397.1981. 17g O H2N NH2 N N N O S 1 H NMR (CD3OD) δ 1.30 (dt, 1H, J = 13.3, 7.9 Hz), 2.03 (m, 1H), 1.91 (m, 1H), 2.31 (dt, 1H, J = 13.3, 6.7 Hz), 3.24 (m, 1H), 3.49 (m, 1H), 3.83 (m, 1H), 4.68 (2d, 2H, J = 11.6 Hz), 7.57 (d, 1H, J = 5.4 Hz), 7.75 (d, 1H, J = 5.4 Hz), 8.04 (m, 3H), 8.63 (s, 1H); 13C NMR (CD3OD) δ 37.9, 39.9, 48.5, 22.6, 56.8, 62.1, 84.0, 122.7, 124.1, 124.4, 125.6, 128.5, 130.6, 139.7, 144.8, 145.4, 191.4; HRMS (ESI) m/z calcd for C18H22N5O2S [M+H]+: 372.1494. Found: 372.1463.
O H2N NH2 N N N O 17h 1 H NMR (300 MHz, CD3OD) δ 1.87 (dt, 1H, J = 13.1, 8.9 Hz), 2.27 (m, 2H), 2.70 (dt, 1H, J = 13.1, 7.7 Hz), 3.66 (m, 1H), 3.86 (m, 1H), 4.37 (m, 1H), 4.81 (2d, 2H, J = 12.6 Hz), 6.25 (s, 2H), 7.62 (m, 2H), 7.75 (m, 1H), 8.11 (m, 2H), 8.26 (s, 1H); 13C NMR (75 MHz, CD3OD) 32.5, 33.9, 47.1, 55.0,
56.4, 61.9, 80.1, 126.7, 128, 128.8, 134.0, 134.2, 191.1; HRMS (ESI) m/z calcd for C16H22N5O2
[M+H]+: 316.1774. Found: 316.1764.
Biologicals
Sample preparation
Human tRNALys3 was expressed in vivo in E. coli from a recombinant plasmid and purified as previously described.[2]
NMR experiments
Experiments were recorded on a Bruker Avance DRX 600 spectrometer equipped with a 3mm triple-resonance flow-injection probe. The probe was connected to a Gilson 215 liquid handler controlled by the NMR console (Bruker BEST system). For tRNA:ligand mixtures, solvent suppression was achieved by using the ‘jump-and-return’ sequence to avoid the saturation of imino protons.[3] All NMR experiments were conducted at 15°C. Samples for 1D NMR screening contained
0.3 mM of tRNA and 1.2 mM of ligand in 10mM phosphate buffer pH 6.5, in a total volume of 200 μl in 96-well plates. The injected sample volumes were 160 μl. For ligands identified in the primary screen, 1H-15N HMQC spectra[4] or TROSY spectra[5] were recorded using a sample containing 0.2
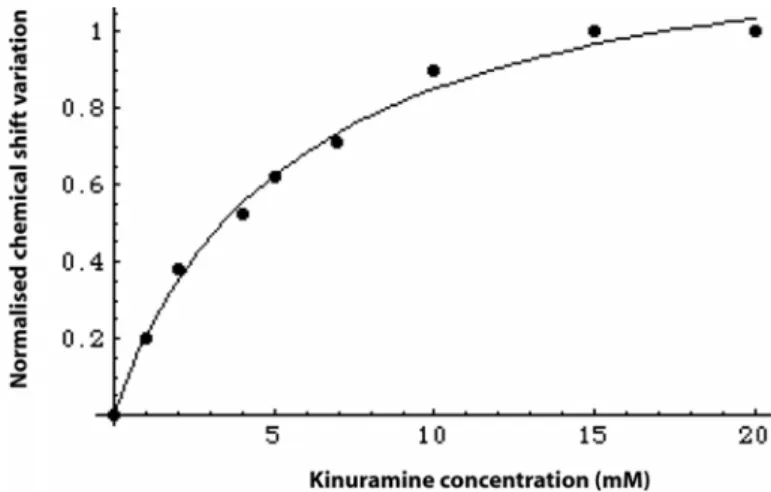
mM to 0.4 mM 15N labelled tRNA for equivalent of ligand concentration (1, 2, 4 and 7) in 10mM phosphate buffer pH 6.5. For the measurement of the dissociation constant (Kd) between kynuramine or 1 and tRNALys3, a sample containing 0.55 mM of tRNALys3 in 10mM phosphate buffer pH 6.5 was titrated by increasing concentrations of ligand in the same buffer : 2, 4, 5, 7, 10, 15 and 20 mM. Kd values were extracted by non-linear least square fitting of the variation of imino proton chemical shifts to a single-site binding hyperbolic function. Confidence limits on the Kd were estimated by Monte-Carlo sampling using the MC-fit program.[6]
Figure 1: NMR titration of tRNALys3 (0.55 mM) by kynuramine 2. The NMR signal of G24 imino proton is followed in 1D NMR experiment at 15°C.[3]
Figure 2: Superimposition of HMQC spectra of tRNALys3 alone (0.2 mM) in black and tRNALys3
mixed with compound 1 (1.4 mM) in red, no KCl. A preferential affinity for the T-arm can be observed at a 7/1 ligand/target ratio, but shift of G15 shows a possible secondary binding site on the
Figure 3: Superimposition of HMQC spectra of tRNALys3 alone (0.8 mM) in black and tRNALys3
Figure 4: Superimposition of TROSY spectra of tRNALys3 alone (0.3 mM) in black and tRNALys3
Figure 5: Superimposition of TROSY spectra of tRNALys3 alone (0.3 mM) in black and tRNALys3
Fluorescence titrations
Fluorescence titrations were conducted at 25.0°C on a JASCO spectrofluorimeter. Excitation and emission wavelengths were 341 nm and 478 nm respectively. The excitation and emission bandwidths were 5 nm.
Fluorescence titrations experiments were performed by adding increasing concentrations of nucleic acid to a fixed amount of ligand (2 μM) in buffers with different ionic strength (10 mM KPO4 pH 6.5,
for three salt concentrations, 0 mM, 50 and 150 mM NaCl). Fluorescence intensities were corrected for dilution and were fitted using equation (1). Confidence limits on the Kd were estimated by Monte-Carlo sampling using the MC-Fit program.[6]
I= I0−I0− I∞ 2nNt Kd + Lt+ nNt − K
(
d + Lt + nNt)
2 − 4LtnNt ⎛ ⎝ ⎜ ⎞ ⎠ ⎟ (1)where I0: Fluorescence intensity without RNA, I: fluorescence intensity at a given concentration of
RNA, I∞: fluorescence intensity at the plateau, n: number of RNA binding sites on the ligand, Lt: total
concentration of RNA, Nt: total concentration of ligand.
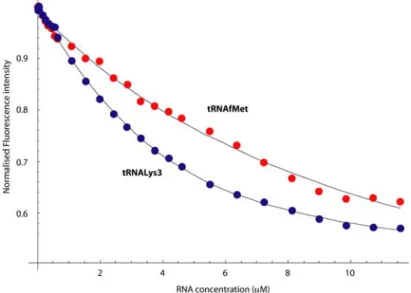
Figure 6: Comparison of fluorescence titration of compound 17f with tRNALys3 (in blue) and tRNAfMet (in red) at 150 mM KCl.
Figure 7: Fluorescence titration of compound 17f with tRNALys3, tRNAfMet and tRNAmMet at various
ionic strengths.
[1] L. Micouin, F. P. Dardel, C. Tisne-Vicrobeck, F. Maurice, M. Bonin, A. Perez Luna, C. J. Bournaud,
G. Bégis, WO2006024784.
[2] C. Tisné, M. Rigourd, R. Marquet, C. Ehresmann, F. Dardel, RNA 2000, 6, 1403-1412. [3] P. Plateau, M. Guéron, J. Am. Chem. Soc. 1982, 104, 7310-7311.
[4] A. A. Szewczak, G. W. Kellogg, P. B. Moore, FEBS Letters 1993, 327, 261-264. [5] J. Weigelt J. Am. Chem. Soc. 1998, 120, 10778-10779.