HAL Id: hal-02161361
https://hal.archives-ouvertes.fr/hal-02161361
Submitted on 20 Jun 2019HAL is a multi-disciplinary open access archive for the deposit and dissemination of sci-entific research documents, whether they are pub-lished or not. The documents may come from teaching and research institutions in France or abroad, or from public or private research centers.
L’archive ouverte pluridisciplinaire HAL, est destinée au dépôt et à la diffusion de documents scientifiques de niveau recherche, publiés ou non, émanant des établissements d’enseignement et de recherche français ou étrangers, des laboratoires publics ou privés.
Can we model otolith growth and opacity patterns as a
response to environmental factors and fish metabolism ?
A DEB-based framework
Ronan Fablet, Laure Pecquerie, Hans Hoie, Aurélie Jolivet, Richard Millner,
Henrik Mosegaard, Sebastian A.L.M. Kooijman, Hélène Pontual De
To cite this version:
Ronan Fablet, Laure Pecquerie, Hans Hoie, Aurélie Jolivet, Richard Millner, et al.. Can we model otolith growth and opacity patterns as a response to environmental factors and fish metabolism ? A DEB-based framework. [Research Report] University of California (University of California); Depart-ment of biology (University of Bergen); Laboratoire des sciences de l’environneDepart-ment marin (UMR CNRS 6539 - Institut Universitaire Européen de la Mer (IUEM) - Université de Bretagne Occidentale (UBO) - Institut de Recherche pour le Développement (IRD)); Centre for Environment, Fisheries & Aquaculture Science (Centre for Environment, Fisheries & Aquaculture Science); National Insti-tute of Aquatic Resources, Technical University of Denmark (National InstiInsti-tute of Aquatic Resources, Technical University of Denmark); Vrje Universiteit, Department of theoretical biology (Vrje Uni-versiteit, Department of theoretical biology); Institut français de recherche pour l’exploitation de la mer (IFREMER); Laboratoire en sciences et technologies de l’information, de la communication et de la connaissance (UMR CNRS 6285 Télécom Bretagne Université de Bretagne Occidentale -Université de Bretagne Sud - ENSTA Bretagne - Ecole Nationale d’ingénieurs de Brest). 2009, pp.23. �hal-02161361�
Can we model otolith growth
and opacity patterns as a response
to environmental factors and fish metabolism?
A DEB-based framework
Ronan Fablet (Télécom Bretagne, UMR CNRS 3192 Lab-STICC) Laure Pecquerie (University of California Santa Barbara, Department of Ecology, Evolution and Marine Biology) Hans Hoie (Department of biology, University of Bergen) Aurélie Jolivet (LEMAR/IUEM)
Richard Millner (Centre for Environment, Fisheries & Aquaculture Science) Henrik Mosegaard (National Institute of Aquatic Resources,
Technical University of Denmark)
Sebastian A.L.M. Kooijman (Vrije Universiteit, Department of theoretical Biology) Hélène de Pontual (Université européenne de Bretagne)
Collection des rapports de recherche de Télécom Bretagne
Can we model otolith growth and opacity patterns as a response to
environmental factors and fish metabolism? A DEB-based framework
Ronan FABLET
1,10, Laure PECQUERIE
2, Hans HOIE
3,4, Aurélie JOLIVET
5, Richard
MILLNER
6, Henrik MOSEGAARD
7, Sebastiaan.A.L.M. KOOIJMAN
8and Hélène De
PONTUAL
9
1. Institut TELECOM ; TELECOM Bretagne ; UMR CNRS 3192 Lab-STICC, Technopôle Brest Iroise CS 83818, 29238 Brest Cedex 2. University of California Santa Barbara, Department of Ecology, Evolution and Marine Biology, Santa Barbara, CA 93106-9610, USA 3. Department of Biology, University of Bergen, P.O. Box 7800, N-5020, Bergen, Norway
4. Institute of Marine Research, PO Box 1870 Nordnes, 5817 Bergen, Norway
5. LEMAR/IUEM, Technopôle Brest-Iroise, 29280 Plouzané
6. Centre for Environment, Fisheries & Aquaculture Science, Pakefield Road, Lowestoft,, 12 Suffolk, NR33 0HT, UK
7. National Institute of Aquatic Resources, Technical University of Denmark, 2920 Charlottenlund, Denmark
8. Vrije Universiteit, Department of Theoretical Biology, de Boeleaan 1087, 1081 HV, Amsterdam, The Netherlands
9. Ifremer/STH, BP 70, 29280 Plouzane, France
10. Université européenne de Bretagne, France
Abstract : this report presents a conceptual and numerical model of the formation of fish otoliths within a DEB-based (Dynamic Enerby Budget) framework. The proposed model relies on two mains assumptions:
1. The precipitation of the calcium carbonate in the endolymph is controlled by organic precursors;
2. The activity of these organic precursors can be modelled as a DEB product, i.e. as a function of metabolic fluxes, such as somatic growth and maintenance fluxes;
3. The existence of a temperature-driven effect on the dynamics of the precipitation of calcium carbonate for given conditions in the activities of ionic precursors;
From these assumptions, a DEB-based otolith model is described relating the dynamics of the otolith growth and opacity to temperature and feeding conditions. An extension to the simulation of otolith images is presented. This model is shown to conform to a number of well-known facts on otolith. Besides, comparisons between model simulations and real otolith patterns are reported for different cases: otolith data from rearing experiments and otolith patterns from two different cod stocks, namely Barents sea cod and North Sea cod. This example illustrates the great potential of the proposed approach.
Introduction
Fish otoliths, calcified structures located in the inner ears of the fish, are actual biological and environmental archives, (Campana and Thorrold 2001, Druffel). Their accretionary growth results from a strict physiological control of the organism, but is influenced by the environmental conditions in which the fish lives. For instance, environmental variables such as temperature and salinity, as well as season-based or age-based metabolic variations are known to influence the deposit rate and the incorporation of chemical elements. This accretionary process often leads to the formation of a sequence of structures (rings), whose periodicity goes from the day to the season. Otolith analysis then offers a unique potential to reconstruct, at a daily and/or yearly scale, environmental parameters as well as individual life traits (age, growth patterns, migration patterns,…) (Campana and Thorrold 2001, Fablet et al. 2007, Fablet and Le Josse 2005), and provides the mean to acquire information at different ecological levels : the individual level, in terms of individual life traits, the population level regarding age-based population statistics or spatio-temporal population structures, the environmental level in terms of reconstruction of temporal series of environmental parameters (Panfili et al. 2003). As an illustration of this potential, one can cite that several million of otoliths are analyzed yearly worldwide for fish stock assessment as well as for ecological studies.
Although otolith analysis is now recognized as an invaluable source of information, the knowledge on the biomineralization processes underlying the formation of the otoliths remain partial such that the effects of metabolic and environmental factors on the otolith growth as well as on the physico-chemical characteristics (Fablet et al.) are not well understood. Different studies and reviews (Beckman and Wilson 1996, Campana and Thorrold 2001) have indeed stressed that empirical studies consisting in analyzing the seasonal timing of the formation of opaque and translucent otolith rings may lead to contradictory observations when relating this seasonal timing to the metabolic state of the fish and/or the temperature of the environment. Recent examples further outline this lack in the understanding of the key features of the biomineralization of the otoliths. Forr instance, the analysis of otoliths of tagged hakes from the Bay of the Biscay shows that the interpretation of hake otoliths, according to internationally agreed protocol, is biased due to the presence of opaque and translucent rings not following a seasonal or behavorial deposit as assumed by experts. Only the understanding of the conditions of the formation of these rings and of their relation to environmental factors and/or fish behaviour would permit defining a relevant ageing protocol. These different examples emphasize the need for new tools and concepts aimed at analyzing and modelling the formation of fish otoliths. Few studies (Hussy and Mosegaard 2004, Romanek and Gauldie 1996, Schirripa and Goodyear 1997) have attempted to adopt a modelling perspective to contribute to these issues. Based on previous work on purely mineral aragonite precipitation, the model proposed in (Romanek and Gauldie 1996) assumes that the formation of the otolith is mainly driven by the dynamics of the ionic concentrations in the endolymph*. Recent results both on the chemistry of the endolymph (Allemand et al. 2007,
Hussy and Mosegaard 2004, Takagi 2002) and on the empirical relation between protein synthesis and otolith growth (Hussy et al. 2004) however show that this assumption does not apply relevantly to the biomineralization of the otolith. Besides, these models mainly focused on otolith growth. Models proposed in (Hussy and Mosegaard 2004, Schirripa and Goodyear 1997) attempt to link otolith formation to fish bioenergetics, especially by tacking into account maintenance costs in otolith growth. These models permit accounting for the decoupling between fish and otolith growth during low feeding or starvation period. An important limitation of these models is that they do not provide a generic framework for modelling the otolith formation in relation to fish bioenergetics and environmental factors, as they rely on fitting empirical relations between otolith variables (e.g., growth, opacity) and environmental and/or fish quantities (e.g., temperature, body protein synthesis, respiration rate) requiring a detailed knowledge on the physiology of the targeted species. Besides, these models only deal with modelling otolith growth. In (Hussy et al. 2004), a relation between
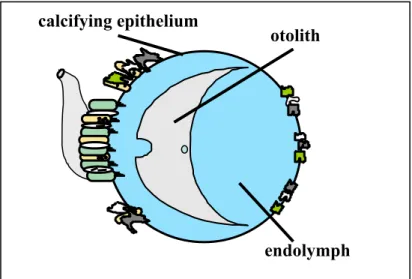
* The endolymph is the fluid in the otosac in which evolves the otolith (see Figure 1 for schematic representation
of the otolith-endolymph-otosac complex). The endolymph is an acellular medium containing the mineral and organic precursors involved in the biomineralization of the otolith (Allemand, D., Mayer-Gostan, N., de Pontual, H., Boeuf, G., and Payan, P. 2007. Fish Otolith Calcification in Relation to Endolymph Chemistry. In Handbook of biomineralization. Edited by E. Bäuerlein, Behrens, P., and Epple, M. (eds.). Wiley. pp. 291-308.
otolith opacity and body protein synthesis was established. But, no actual model of otolith formation, including both otolith growth and opacity, was proposed. However, no actual joint model of otolith growth and opacity was proposed.
In this context, our contributions are four-fold:
- developing a conceptual and generic model of the formation of fish otoliths implemented in the framework of the DEB theory;
- providing a mathematically-sound and biologically-sound numerical framework based on clear assumption on the key features of the biomineralization;
- demonstrating the capacity of the model to explain otolith ring formation as due to temperature variations and/or feeding shifts;
- stressing that opaque and translucent otolith zones are not uniquely defined in terms of temperature and metabolic conditions such that fish biology and behavior are of key importance in the interpretation of fish otoliths for the reconstruction of individual life traits.
As outlined previously, this work is, to our knowledge, the first relating within a generic conceptual and numerical framework otolith formation to fish bioenergetics and environmental factors. This contribution is also of great interest for other biominerals, such as corals, bivalves, statoliths, for which, to our knowledge, no similar approach has been proposed yet.
Material and methods
Conceptual model of the formation of fish otoliths
Fish otoliths are mainly composed of crystals of aragonite (one of the types of calcium carbonate crystals)†. The precipitation of calcium carbonate is governed by the chemical equation:
+ −
++HCO ⇔CaCO +H
Ca2 3 3 (1)
characterized by its saturation coefficient Ω=
[ ]
Ca2+[
HCO3−]
KS−1, with[ ]
Ca
2+ and[
HCO3−]
respectively the activity of calcium and carbonate ions in the endolymph at the otolith surface (cf. Figure 1), and KS the solubility product.. The value of the saturation coefficient Ω characterizes the
saturation state of the solution:
- If Ω is below 1, the solution is undersaturated, no precipitation occurs;
- If Ω is greater than 1, the solution is supersaturated and a precipitation occurs; - If Ω equals 1, the solution is at equilibrium.
From a modelling point of view, the amount of the precipitation is generally described by a power law . This assumption is supported for aragonite by in vitro experiments (Romanek and Gauldie 1996). Interestingly, these experiments have shown that the parameters of this law are temperature-dependent.
(
γλ
Ω
−
1
)
† Vaterite crystals may also be observed in fish otoliths. They however correspond to abnormal otoliths Panfili,
Figure 1 – Schematic representation of otosac and the of associated otolith-endolymph complex
otolith
endolymph
calcifying epithelium
Whereas most in vitro experimental and modeling work have dealt with purely mineral precipitation, fish otoliths include an organic fraction (Allemand et al. 2007). Though the organic matrix of the otoliths is only partially characterized, recent studies on otolith proteins (Allemand et al. 2007, Murayama et al. 2004, Murayama et al. 2002, Sollner et al. 2003) as well as on the chemistry of the endolymph (Allemand et al. 2007, Takagi 2002) have shown that the organic matrix plays a key role of in the control of the shape of the otolith (Sollner et al. 2003) as well as in the regulation of the growth (Guibbolini et al. 2006). Besides, proofs of passive transports of the ion precursors of the biomineralization have been given (Allemand et al. 2007).
These results lead us considering the following assumptions to state a conceptual model of the formation of the otolith‡:
A1: The concentrations in the organic precursors synthesized by the saccular epithelium act as a control on the activities of the ionic precursors and subsequently on the growth of the otolith through a power law of the type
λ
(
Ω
−
1
)
γ;This statement is a direct transcription of the results on the role of the organic matrix mentioned above.
A2: The organic fraction of the otolith is metabolism-dependent, i.e. relative proportions of the different constituents of the organic matrix may vary;
This statement is supported by recent results on the local characterization of the organic matrix on otolith sections showing that variations in the relative proportions of its compounds can be observed (Jolivet et al. 2008). Given statement A1, the knowledge that fast somatic growth leads to fast otolith growth also motivates this second statement, as it means that metabolic activities associated to somatic growth and maintenance do not act in the same way on the formation of the biomineral.
A3: Aragonite precipitation depicts a specific temperature-depend effect independent on fish metabolism through temperature-dependent parameters λ and γ of the power law
λ
(
Ω
−
1
)
γ . This statement follows previous work on the modeling of the formation of aragonite and relies on the general law considered to model crystallization processes (Romanek and Gauldie 1996, Takagi 2002).‡ It should be stressed that the time scale considered here is typically at daily time step. Modelling the
biomineralization process at a subdaily scale, especially the formation of the daily opaque and translucent microstructures, is beyond the scope of this work.
A4: Variations in otolith opacity is induced by variations in the ratio between the organic fraction and the mineral fraction deposited at a given time.
This last statement is motivated by the observation that fish otoliths with greater relative organic fractions tend to be more opaque than others (Mugiya 1965, Tomas et al. 2004). Besides, otolith opacity has been shown to depict a positive correlation to body protein synthesis (Hussy and Mosegaard 2004, Hussy et al. 2004).
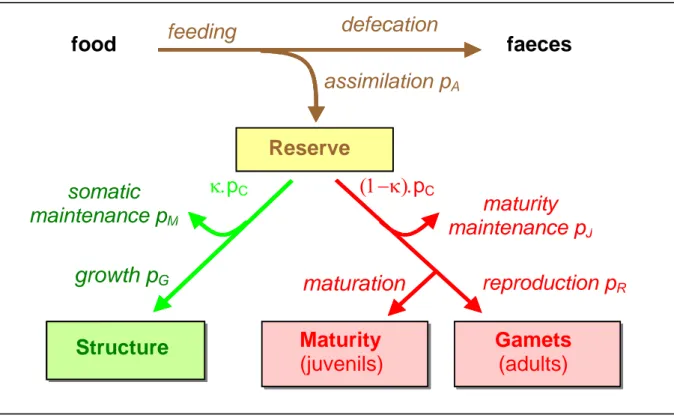
Figure 2: Key principles of the DEB model (Kooijman 2000): three state buffers are considered, the reserve pool, the structure and the reproduction buffer, as well as the associated energetic fluxes, the assimilation flux pA, the catabolic flux pC allocated with a
fixed κ fractionation rule to the structure, corresponding to the somatic growth flux pG
and the somatic maintenance flux pM, and the reproduction buffer, to cover maturity
development and maintenance with flux pJ and reproduction buffer with flux pR. The
DEB model states the dynamics of its state variables, the structural volume, the energy in the reserve pool and the energy of the reproduction buffer, through the dynamics of the energy fluxes.
food faeces
assimilation p
Areserve
feeding
defecation
Standard DEB model for fish bioenergetics
The DEB theory provides a conceptual and mathematical framework to model the metabolic organization of an organism (Kooijman 2000, Nisbet et al. 2000, van der Meer 2006). An introduction to the DEB theory can be found in (Nisbet et al. 2000) and a special emphasis on model calibration is provided in (van der Meer 2006). Following a well-founded formulation, the DEB model states that the energetic processes, such as food assimilation or maintenance, depend either on the surface or on the volume of the body. The key feature of the DEB model is to consider a reserve pool which all assimilated products are allocated to. The energy stored in this reserve pool is then allocated to structure-related and reproduction-related metabolic fluxes: maintenance, somatic growth and reproduction. The other important statement of the DEB model is to apply a fixed allocation rule to reproduction. More precisely, a fraction κ of energy is allocated to maintenance and somatic growth, with priority to maintenance, and the remaining fraction 1-κ to reproduction (van der Meer 2006). Using a standard DEB model, we consider one type of food, one type of reserve and one type of structure for an isomorph, i.e. an individual that does no change in shape during its growth. Three state variables are introduced: the structural volume V (cm3), the energy of the reserve (J) and the energy of
the reproduction buffer. Within the DEB theory, a strong homeostasis assumption is made, i.e. that he
maturity
maintenance p
Jmaturation
somatic
maintenance p
Mgrowth p
Greproduction p
R(1−κ).p
CGamets
(adults)
Reserve
κ.p
CMaturity
(juvenils)
Structure
chemical composition of the structure, reserve and reproduction buffer does not change along the life span of the individual. The reserve, which comprises all the material available to support metabolic costs, is continuously replenished through the assimilation process with no maintenance cost. The structure material is continuously degraded and reconstructed which implies maintenance costs, especially regarding protein degradation and synthesis.
The DEB theory derives three partial differential equations setting the dynamics of the state variables (Kooijman 2000, van der Meer 2006). These equations are governed by six energy fluxes:
- The assimilation flux pA proportional to the body surface V2/3;
- The catabolic flux pC proportional to a weighted sum of the structural volume V and of the body
surface V2/3;
- The maintenance flux pM proportional to the structural volume V;
- The maturity maintenance flux pJ proportional to the structural volume V;
- The growth flux pG given by pG= κ pC-pM;
- The reproduction flux pR given by pR= (1-κ) pC-pJ;
The dissipation flux pD, corresponding to the sum of all maintenance costs, is given by pD= pM+pJ
+(1-κR)pM where (1-κR) is the specific costs of the production of eggs from the reproduction buffer. As
physiological rates depend on body temperature (fish models considered in this work are ectoderms), a temperature effect on all DEB fluxes given by an Arrhenius law, with a species-specific parameterization, is considered. A detailed presentation of the DEB equations and parameters can be found in (Kooijman 2000). An important feature of the DEB theory is the relatively low number of compound parameters (typically, ten compound parameters) given the generic and theoretical background provided by the model. The key principles of the DEB model are illustrated (Figure 2). Three life stages are considered: the embryo, juvenile and adult stage. The transition from one stage to the next one occurs when the cumulated energy allocated to maturation reaches a predefined threshold. During the embryo stage, the individual switches on feeding. The actual allocation to maturation starts at puberty, i.e. the transition from the embryo stage to the juvenile stage. When the adult stage is reached, the allocation to the reproduction buffer begins. A species-specific reproduction rule, typically related to the spawning season, is defined to empty the reproduction buffer each year.
A great interest of the DEB theory lies in its ability to model and predict physiological states or variables, such as the heat, the nitrogen waste, the respiration rate, stated as DEB products and formally derived from the three main DEB fluxes, i.e. the dissipation flux pD, the growth flux pG, and
the assimilation flux pA (Kooijman 2000). The concept of the DEB product has also been applied to
wood for trees, hairs for mammals or shells for molluscs (Kooijman 2000). To understand the dynamics of the DEB product, it is important to know the general trends of the three main DEB fluxes: - As growth tends to decrease along the life span of the individual, the associated DEB flux follows
a similar trend;
- Opposite is the main trend of the dissipation flux as it is a function of the structural volume. It tends to increase along the lifespan of the individual up to an asymptote;
- The dynamics of the assimilation flux is directly linked to the dynamics of food availability. No specific asymptotical behaviour can then be expected in general. Depending on fish behaviour and the environmental variability, seasonal patterns may or not be generated.
Given the clear interpretation of the DEB fluxes in terms of metabolic states, it provides a comprehensive understanding of the dynamics of the considered DEB product. The specific effect of the temperature is also handled through the Arrhenius law set on DEB fluxes.
Modeling otolith formation as a DEB product
Exploiting the DEB theory, the synthesis and transport of biomineralization precursors in the endolymph is modeled as a DEB product. The observed nichtemeral variations of the concentrations of these precursors and of their turnover lead us to assume that the mass of these precursors changes in pseudo-steady state at the considered modeling time scale (typically daily or weekly). Hence, the volume of the precipitated otolith material is also stated as a DEB product given by a weighted sum of the assimilation, dissipation and growth fluxes. The proposed model indeed considers two different DEB-predicted dynamics for the organic and mineral fraction of the otolith. This formulation is a straightforward transcription of statements (A1) and (A2) on the biomineralization of the otolith.
From the physico-chemical properties of the precipitation of calcium carbonate, two additional constraints can be derived on the weighting factors of the three DEB fluxes:
- the growth of otolith is physically limited by the volume of the otosac. Hence, otolith growth should be null when the volume of the endolymph vanishes. To comply with this physical constraint, a regulation factor, issued from the precipitation power law and computed as a function of the volume of the endolymph, is considered both on the dynamics of the organic and mineral fraction of the accretion;
- Experiments on purely mineral aragonite precipitation clearly show that temperature acts on the actual precipitated volume (Romanek and Gauldie 1996): typically, a temperature increase leads for constant ion concentrations to an increase of the precipitated volume of aragonite. Assuming that the precipitation of the aragonite follows a power lass of the type , it resorts to considering that parameters λ and γ might depict a temperature effect. Given a model of the relative variations of these parameters with respect to a reference temperature, the precipitation of the mineral fraction of the otolith is then modeled as where λ
(
γλ
Ω
−
1
)
(
)
** γ
λ
G
DEB * and γ* stand for therelative variations of parameters λ and γ with respect to a reference temperature and GDEB is the
volume of the mineral precipitation predicted at the reference temperature by the DEB model. Following the experiments reported in (Romanek and Gauldie 1996) for the precipitation, γ* is
assumed constant and an exponential law, equaling one at the reference temperature, is considered for λ*.
Given that the mineral fraction of the otolith account for more than 95% of the overall content of the otolith, the volume of the otolith is taken as the cumulated volume of the precipitated mineral fractions.
Modelling the dynamics of the organic and mineral fraction of the otolith provides the basis for considering a model of otolith opacity. From the empirical observations that more opaque fish otoliths were associated with a greater amount of organic compounds (Mugiya 1965, Tomas et al. 2004) and that otolith opacity depicts a positive correlation to global body protein synthesis (Hussy and Mosegaard 2004), otolith opacity can be interpreted as a result of an increased light scattering due to the presence of organic particles in the crystal: the more organic particles in the aragonite crystals, the more opaque the otolith. Hence, otolith opacity is modelled as a function of the ratio between the relative masses of the organic and mineral fraction of the newly formed layer. In the context of the DEB theory, both quantities are computed from a weighted sum of the assimilation, dissipation and growth fluxes. The organic matrix is known to comprise various organic compounds, such as proteins, proteoglycans, sugars, collagens. Some of these organic compounds are involved in the control of the accretion. Besides, their variations are not necessarily correlated (Allemand et al. 2007) meaning their synthesis is not governed by a single metabolic process. In the context of the DEB theory, variations in otolith opacity at constant temperature are then interpreted as resulting from different relative contributions of the DEB fluxes in terms of mass and type of the organic matrix of the otolith with respect to the total mass of the precipitated aragonite crystals. Formally, otolith opacity is modelled as the ratio between the mass of the organic compounds, given by a weighted sum of the DEB fluxes, and the precipitated mass of aragonite, given by a function of a weighted sum of the DEB fluxes also taking into account the discussed temperature-specific effect on aragonite precipitation. Changes otolith opacity can then result both from temperature changes and from variations of the DEB fluxes whose relative effects on organic compounds and aragonite precipitation may be different. In (Hoie et al. 2007) otolith opacity is shown to be positively correlated to feeding conditions at constant temperature. Therefore, the parameterization of the opacity model is such that the relative effects of the growth flux on the mass of the organic compounds is greater than the one of the dissipation flux compared to the relative weights set for the mineral fractions.
From the interpretation of the DEB fluxes in terms of metabolic processes, a number of formal properties can be derived for the proposed model of otolith formation in agreement with experimental observations (Hoie et al. 2008):
- At constant temperature, fast somatic growth results in fast otolith growth, in good correlation between the fish and otolith growth and in greater otolith opacity, as the contribution of the dissipation flux to the otolith formation tends to be weaker compared to the growth flux;
- Conversely, at constant temperatures, slow or null fish growth leads to a decoupling between fish and otolith growth as the otolith growth is then mainly or totally driven by the contribution of the dissipation flux. Besides a decrease in otolith opacity is generated.
Similar trends can be deduced regarding a temperature effect for given metabolic conditions as reported in experimental studies (Hoie and Folkvord 2006):
- A temperature increase leads to a greater otolith growth and a lower opacity;
- Conversely a temperature decrease results in a slower otolith growth and a greater opacity. Besides, the joint effects of temperature and somatic growth can also be analyzed:
- Simultaneous fish growth increase and temperature decrease (or conversely) act in a similar way on otolith opacity whereas an opposite effect is predicted on otolith growth;
- On the contrary, simultaneous increase or decrease of fish growth and temperature act in a similar way on otolith growth whereas an opposite effect is predicted on otolith opacity.
Model calibration and simulation
The simulation of the DEB-based otolith model uses as inputs series of feeding conditions and temperature series. A generic integration method is exploited to simulate model dynamics from the DEB differential equations. The outputs of the model are three-fold: the growth pattern of the fish, the otolith growth pattern and the otolith opacity pattern. The model is implemented under Matlab using the debtool§ toolbox.
Model calibration involves two different stages:
- the calibration of the generic DEB fish model (van der Meer 2006) involving five compound DEB parameters (namely, DEB parameters κ, g, kM,v kJ, and K) and three maturity parameters Hb, Hj,
Hp, (cf. Table I and (van der Meer 2006)). In the present study, model calibration is mainly issued
from the knowledge of the general Von Bertallanffy growth law known for the considered species. Let us stress that our interest in this work is not in precisely fitting a DEB model, but rather in analyzing the relative effects of temperature and metabolic conditions on the biomineralization of the otolith;
- the calibration of the DEB-based otolith model. It mainly involves the setting of the relative weights of the DEB fluxes and of the temperature-specific effects. Individual otolith growth patterns for known temperature and feeding conditions are used to this end.
The somatic and otolith growth patterns can be straightforwardly compared to experimental data to check for the relevance of the model. Regarding opacity, the situation is slightly different. Opacity is only a relative measure. Not only otolith characteristics define the measured opacity, but a number of other factors influence the mean opacity value and its range: for instance, the width of the otolith sections, the lighting conditions both in terms of power and direction, the non-linear contrast function of imaging device. Therefore, the comparison of predicted opacity patterns to real ones is dealt with using correlation statistics, and the associated regression is exploited to visually check for the correspondence between two opacity signals.
2D simulation of otolith images
The proposed DEB-based otolith model generates one-dimensional otolith patterns, namely otolith growth and opacity patterns, for any input temperature and feeding conditions. Based on the shape-based model introduced in (Fablet et al., Fablet et al. 2007), we propose a two-dimensional extension of this model. We proceed as follows (Figure 3). We first extract a mean shape history model from a reference otolith image (or a collection of otolith images) for the species and/or stock of interest using the method described in (Fablet et al., Fablet et al. 2007). We then combine this shape history model to the one-dimensional otolith patterns predicted by the DEB otolith model: at any time, the corresponding otolith shape issued from the shape history model is scaled up to the surface predicted by the DEB otolith model, and, the newly formed otolith surface (i.e., the otolith surface at the current
§ The debtool Matlab toolbox can be downnloaded at http://www.bio.vu.nl/thb/deb/deblab. Otolith-specific
timestep minus the otolith surface at the previous tie step) is assigned the opacity value predicted by the DEB otolith model.
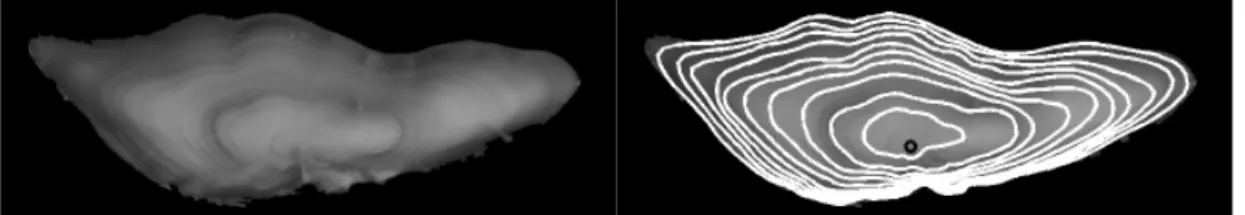
Figure 3 – Two-dimensional extension of the DEB otolith model using the shape history representation introduced in (Fablet et al., Fablet et al. 2007): image of a cod otolith acquired in reflected light (first row, left), representation of the shape history through the sequence of otolith shapes superimposed to the opacity image (first row, right), predicted 1D otolith growth pattern for constant temperature and feeding conditions (second row, left), associated otolith opacity pattern (second row, right), simulated 2D otolith growth pattern (image values represent time steps) (third row, left), simulated opacity image (third row, right).
This simulation scheme does not take into account the growth anisotropy observed on fish otoliths. Otolith zones with greater relative growths (for instance, dorsal and ventral axes compared to distal and proximal zones) are more opaque (Fablet et al.). Therefore, the 2D otolith model is complemented with an additional growth anisotropy modulation. The growth anisotropy measure is locally evaluated as the relative growth with respect to the mean growth at the corresponding time, mean computed all points defining the otolith edge at this time. The modulation is stated as a linear factor of this local relative growth measure as illustrated (Figure XXX).
Model inversion: reconstructing individual feeding and growth histories from otolith
patterns
A key interest of the proposed DEB otolith model is its potential for reconstructing individual life histories from otolith patterns. Let us assume that for a given species and stock a mean DEB otolith model has been calibrated. Let us further assume that temperature conditions experienced by the fish are known. Such temperature data may be issued from Data Storage Tags (DSTs) (Righton et al. 2001), direct environment monitoring or ocean models. In such conditions, otolith growth and opacity patterns predicted by the DEB model solely depend on the feeding history. Hence, given real opacity and growth otolith patterns, the reconstruction of feeding and growth histories can be stated an the inversion of the model, i.e. retrieving the feeding history leading to the best prediction of the observed otolith patterns. Formally, this inversion resorts to the minimization of a error criterion U(f)
∑
∫
−
+
∫
−
=
i T O i DEB LO T O i DEB OO
t
O
t
dt
LO
t
LO
t
dt
f
U
(
)
α
(
)
(
)
2α
(
)
(
)
2where f is the time series of feeding conditions to be reconstructed,
α
Oandα
LOthe weighting factors of the opacity and otolith growth terms, i the index of the ith observed otolith patterns, Oi the opacitypattern of sample I, LOi the otolith length of sample I, ODEB the opacity pattern predicted by the DEB
model and LO
B
DEB the growth pattern predicted by the DEB. Considering the form of the equations
defining the dynamics of the DEB model, in particular the property that fish growth depends on state-parameter E but not directly on f, a direct method may be considered. The inversion ahs however been proven unstable using such a direct approach. Therefore, the use of tools developed for optimal control theory and variational assimilation has been considered (Le-Dimet and Talagrand 1986, Lions 1971). Thanks to the adjoint formulation introduced by Lions (Lions 1971), it is possible to estimate a state space of high dimension following a dynamical law on the basis of noisy, multiple and incomplete sources of observations, which is typically the case for reconstructing a series of feeding conditions from several, possibly incomplete, otolith patterns. The minimization of criterion U is then carried out using a gradient-based method, where the gradient is computed from the adjoint forumation, using the state and observation model issued from the DEB model.
Results
Experimental setting and comparison to experimental data
With a view to evaluating the ability of the model to simulate realistic otolith patterns, we consider cod otoliths, among the main models in the field of otolith research such that a number of experimental data dedicated to otolith formation for various feeding and temperature setting are available, e.g. (Folkvord et al. 1997, Hoie and Folkvord 2006, Hoie et al. 2008, Hoie et al. 2004b, Hussy and Mosegaard 2004).
In our study, otolith data from two different controlled experimental settings are exploited: - otoliths from cods raised with shifts in the feeding conditions (Hoie et al. 2008);
- otoliths from cod raised at constant feeding conditions with seasonal temperature cycles (IBACS 2006).
The available experimental data are depicted for each experiment (Figure 3 and 5). It might be stressed that the time calibration of the otolith data is issued from the successive tagging otolith marks for the first experiments, while, for the latter, the time calibration is issued from the registration of the recorded temperature series in the pens and to the sampled series of the oxygen isotope ratios of the otoliths in time (Hoie et al. 2008). Given the time calibration of the otolith signals, all the reported visualizations of otolith signals are done with respect to a daily time scale, rather than with respect to the distance to the edge of the otolith.
Shift in feeding regimes
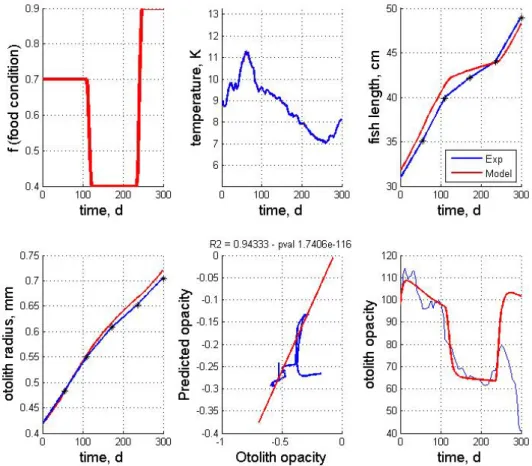
The experimental setting of the first experiments is depicted (Figure 4). Three feeding periods are considered: mid-feeding conditions at the beginning of the experiment (100 days) followed by a low-feeding period during 80 days, and food ad libidum the last 70 days. Cods were reared in pen cages such that the temperature followed seasonal variations, depicting a season high at day 60 of the experiments, an almost constant decrease from day 60 to day 250 and an increase during the 60 last days.
Two different model simulations are reported and compared to real otolith data:
- a simulation not taking into account the otolith-specific temperature effect, i.e. λ* is set constant to 1 (Figure 3);
- a simulation with the proposed otolith-specific temperature effect, i.e. λ* a increasing function of temperature T (Figure 4).
The considered parameter setting is reported (Table I).
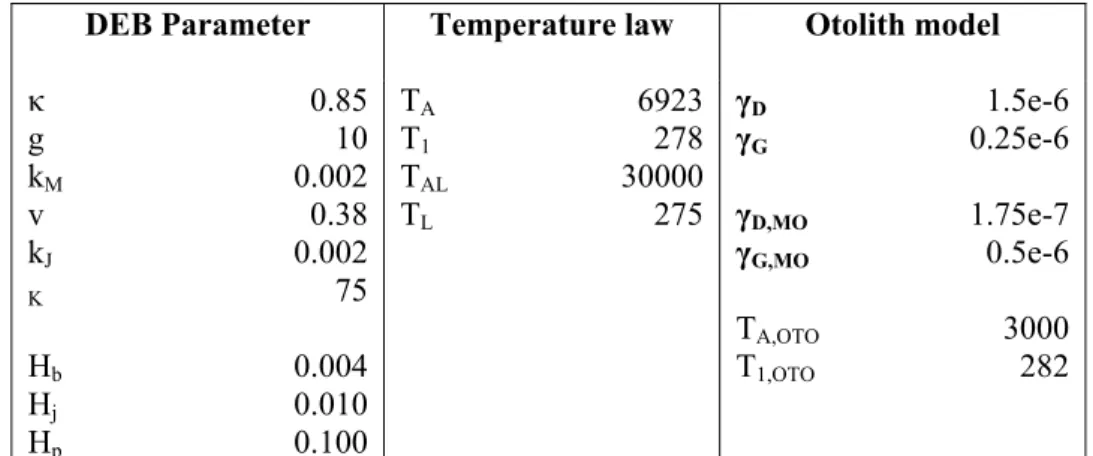
DEB Parameter Temperature law Otolith model
κ g kM v kJ K Hb Hj Hp 0.85 10 0.002 0.38 0.002 75 0.004 0.010 0.100 TA T1 TAL TL 6923 278 30000 275 γD γG γD,MO γG,MO TA,OTO T1,OTO 1.5e-6 0.25e-6 1.75e-7 0.5e-6 3000 282 Table I: Parameter setting considered for the first experiment (Figures 3 and 4): κ, g, kM,v kJ, and K are the compound parameters of the fish DEB model; Hb,, Hj, Hp the
maturity parameters defining the embryo, juvenile and adult stage; TA, T1 ,TAL ,TL the
parameters of the Arrhenius temperature law set on the DEB energy fluxes; γD, γG, γD,MO, γG,MO the relative weights of the growth flux pG and of the dissipation flux pD for
TA,OTO,T1,OTO the parameters of the exponential law exp(TA,OTO/T1,OTO-TA,OTO/T) defining
the temperature effect λ* on aragonite precipitation.
Simulations of fish and otolith growth are reported in both cases (Figures 3 and 4) depicting as expected a decrease in growth speed during the low-feeding period, but with a lower effect on otolith growth. In both cases, a good match between the simulations and the real otolith and fish growth is reported. Regarding opacity, the model only taking into account the relative variations of the growth and dissipation DEB fluxes (Figure 2) recovers the general opacity trend with an abrupt opacity decrease after the shift to the low-feeding period. The second simulation (Figure 3) depicts a better correlation between the real and the predicted opacity signals. A very high correlation (greater than 0.9, p < 1e-6) is observed between the simulated opacity signals and the real one for the first 250 days of the experiments, only the last 50 days are simulated with an opacity range comparable to the real one. It may be explained by specific edge effects on opacity which are often observed and may be due to interactions between the otolith and the embedding material and/or increased alteration of the characteristics of the otolith close to the edge due to the successive preparation steps of the otolith sections. Focusing on the first 250 days of the experiments, a good illustration of the joint effects of feeding and temperature conditions on otolith opacity is reported. While the opacity trend is due to the shift in the feeding variations, the higher-frequency variations of the opacity are explained by temperature variations. In particular, it can be noted that the temperature peak corresponds to relative minimum of the opacity at day 60.
Figure 2 -
Model simulation with NO specific temperature effect on otolith opacity:from left to right, feeding conditions, temperature series, somatic growth, otolith growth, predicted opacity vs. measured opacity, opacity signals. The model simulation is compared to a real otolith data corresponding to the considered feeding and temperature conditions. Model simulation is depicted in red and experimental data in blue.
Figure 3 - Model simulation involving the proposed specific temperature
effect on otolith opacity
: from left to right, feeding conditions, temperature
series, somatic growth, otolith growth, predicted opacity vs. measured opacity,
opacity signals.
The model simulation is compared to a real otolith data corresponding to the considered feeding and temperature conditions. Model simulation is depicted in red and experimental data in blue.Constant feeding conditions and seasonal temperature cycles
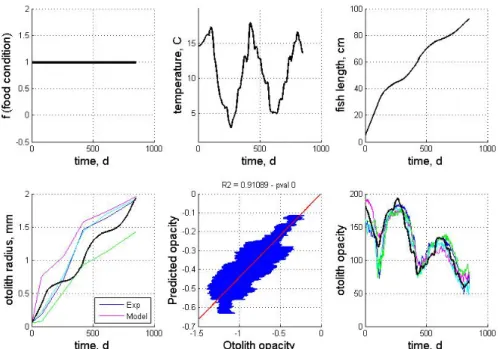
The second experimental data involve cods raised in pen cages and fed ad libidum under uncontrolled temperature conditions. At start cods were 7 months old and this experiment lasted 22 months. The temperature was monitored as depicted (Figure 4). Besides, micromilling techniques were used to measure the ratios of oxygen isotopes of four otoliths from the core to the edge of the otolith. These oxygen isotope ratios have been shown to be good proxy of the temperature (Hoie et al. 2004a). These isotopic signals were then compared to the monitored temperature series with a view to estimating otolith growth and calibrating in time opacity signals. As depicted (Figure 4), all four otolith opacity signals share the same trends with a great negative correlation to temperature. It should be stressed that three of the four otoliths depict an abrupt and important opacity decrease at day 100, corresponding to the temperature maximum of the first summer, whereas the remaining otolith shows a lower and smoother opacity decrease.
Reported simulations have been carried out with the same parameter setting as for the first experiments (see Table I), except for otolith parameters γD and γG set respectively to 1.75e-6 and
0.5e-6 as the cod otoliths were bigger in this second experiment. Three different simulations are reported: - a simulation not taking into account the otolith-specific temperature effect, i.e. λ* is set constant to
1 (Figure 4);
- a simulation with the proposed otolith-specific temperature effect λ* (Figure 5);
- a simulation with the proposed otolith-specific temperature effect and an added abrupt decrease in feeding conditions at day 100 corresponding to the high temperature period (i.e., temperatures greater than 16) during the first summer (Figure 6).
In all cases are reported the feeding and temperature series, the predicted fish growth, the predicted otolith growth and the real otolith growths of the four considered fish, the plot of observed otolith opacity vs. simulated opacity for the considered cod otoliths and the predicted and real opacity time
signals. The correlation between predicted and observed opacity is evaluated using a spearman rank coefficient and the associated p-statistics is computed.
These simulations outline that:
- opacity variations can be mostly explained by temperature variations introduced in the model by the otolith-specific temperature-regulated factor λ* with a correlation coefficient greater than 0.9
(p <1e-5) compared to a correlation coefficient below 0.7, when not considering this temperature effect (Figures 4 and 5);
- the opacity lowering occurring during the warm period (temperatures greater than 16) of the first summer observed for three of the four processed otoliths cannot be explained by the model as a direct temperature effect. The reported simulation (Figure 5) better matches to the fourth otolith which does not depict this abrupt opacity decrease;
- An abrupt lowering of feeding capacity during this first warm period (around day 100 of the experiment) could explain this abrupt opacity decrease observed at day 100.
Figure 4: Model simulation with NO specific temperature effect on otolith opacity: from left to right, feeding conditions, temperature series, somatic growth, otolith growth, predicted opacity vs. measured opacity, opacity signals. The model simulation is compared to the otolith data for the four otoliths of cod reared in the considered feeding and temperature conditions. Model simulations are in black and coloured plots correspond to one of the four real otolith data.
Figure 5: Model simulation with the proposed specific temperature effect on otolith opacity: from left to right, feeding conditions, temperature series, somatic growth, otolith growth, predicted opacity vs. measured opacity, opacity signals. The model simulation is compared to the otolith data for the four otoliths of cod reared in the considered feeding and temperature conditions. Model simulations are in black and coloured plots correspond to one of the four real otolith data.
Figure 6: Model simulation with the proposed specific temperature effect on otolith opacity AND an abrupt lowering of the feeding conditions around day 100: from left to right, feeding conditions, temperature series, somatic growth, otolith growth, predicted opacity vs. measured opacity, opacity signals. The model simulation is compared to the otolith data for the four otoliths of cod reared in the considered feeding and temperature conditions. Model simulations are in black and coloured plots correspond to one of the four real otolith data.
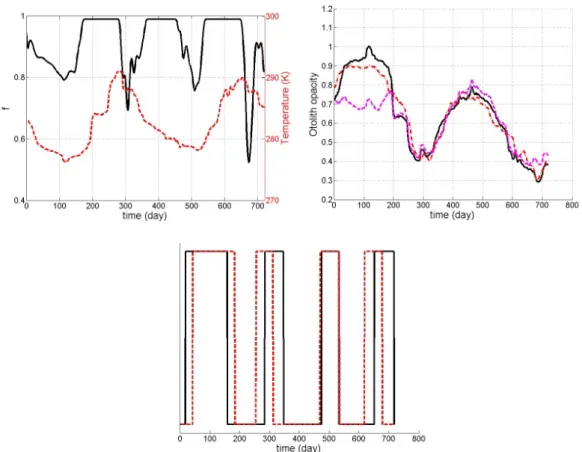
Reconstructing individual feeding and growth histories from otolith patterns
The application of the model to the reconstruction of individual feeding and growth histories is reported for the otolith data presented in Figure 5 and 6 (Figure 7). Interestingly, the falls in the feeding history refer to highs or lows of the temperature series. The correlation between a version of this feeding history thresholded at 0.7 and the temperature series thresholded at 15°C and 6°C leads to a correlation greater than xxxx (significant p value lower than). This corrobates observations in the tanks that fish fed less at high and low temperatures.
Figure 7: reconstructing the feeding history from otolith patterns depicted in Figures 5 and 6: reconstructed feeding history (solid line) and temperature conditions (dotted line) (top left), fitted opacity (black solid line), mean real opacity pattern (dashed dotted line), predicted opacity pattern with constant feeding conditions (dotted line) (top right), thresholded versions of the reconstructed feeding history (f < 0.9) and temperature series (T<279 or T>288) (respectively, solid and dotted lines, bottom)
Comparison of North Sea cod and Barents Sea cod otolith patterns
Using reference data taken from (Høie et al.), the comparison of North Sea (NS) and Barents Sea (Gardner et al.) cod otolith patterns has been investigated from a model-driven perspective. Environmental conditions and migratory behaviour are considered as among the main factors that could explain the differences in the observed otolith patterns for these two stocks. Using environment data (temperature and food density data) issued from (Høie et al.), DEB otolith model simulations have been carried out for these two stocks (Figure 9). Besides, comparisons to real otolith patterns are reported both in terms of the timing of otolith zone formation (Figure 10) and opacity images. Model simulations show that the main differences between the two stocks, in terms of the timing of zone formation and 2D opacity patterns, can be explained by the differences in the temperature and feeding conditions experienced by the fish.
Figure 8: comparison of model simulations for two different cod stocks, namely Southern North Sea cod and Barents Sea cod: food density series (top left), temperature series (top right), otolith growth pattern (bottom left), otolith opacity pattern (bottom right). (dashed line). NS cod data are depicted as solid lines and BS cod data as dashed line. 1 2 3 4 5 6 7 8 9 10 11 12 Month 0.0 0.1 0.2 0.3 0.4 0.5 0.6 0.7 0.8 0.9 1.0 P ropor ti on t rans lunc ent ot ol it h edges cold years warm years a
1 2 3 4 5 6 7 8 9 10 11 12 Month 0.0 0.1 0.2 0.3 0.4 0.5 0.6 0.7 0.8 0.9 1.0 P ropor ti on t rans lunc ent ot ol it h edges cold years warm years b
Figure 9: Comparison of the timing of otolith zone formation for simulated and real data for NS and BS cod: a
verage proportions of translucent otolith edges for real
otoliths (data taken from (Høie, #80), NS cod (top left), BS cod (top right)), zoom
on the simulated opacity patterns (NS cod (solid line), BS cod (dashed line)) from
July of the fourth year to December of the fifth year
.NS cod BS cod
Figure 10: Comparison of simulated otolith images to real NS and BS cod otolith images: real otolith images acquired under reflected light (first row), simulated images with no 2D growth anisotropy factor (second row), simulated images with a 2D growth anisotropy factor (third row).
Discussion
A generic numerical model of otolith formation
Based on a conceptual model of fish otolith biomineralization and its numerical implementation in the framework of the DEB theory, a numerical model of the formation of the otolith has been proposed. This model simulates to otolith features: the growth of the otolith and its opacity. In both cases, the proposed model clearly relates otolith features to metabolic energy fluxes and to the assumed temperature-dependent precipitation of calcium carbonate in its aragonitic form.
The proposed model conforms to a number of general observations on otolith growth and opacity, reported in previous studies, which can then be interpreted with respect to the key features of the proposed model, the relative effects of the DEB energy fluxes, pG and pD, and the temperature effect
λ*:
- the general decrease of opacity along the lifespan of the fish as a result of the relative decrease of growth energy flux pG compared to the increasing dissipation flux pD;
- the greater opacity variations in seasonally contrasted environment, e.g. otoliths from fish living in tropical waters generally not depicting seasonal rings compared to otoliths from fish living in temperate waters generally depicting seasonal growth rings, as a straightforward result of the temperature effect on aragonite precipitation;
- the existence of a decoupling between the fish and otolith growth, at low or null somatic growth, reported in numerous studies (Hoie et al. 2008, Hussy and Mosegaard 2004, Panfili et al. 2003,
Schirripa and Goodyear 1997), as a result of the formulation of the otolith growth as a weighted function of the growth and dissipation energy fluxes pG and pD;
- the explanation of the reported observation that fish with a lower growth have larger otoliths, as a result of a relatively greater dissipation flux pD;
- the explanation of the fact that fish raised at greater temperature have bigger otoliths (Folkvord et al. 1997, Otterlei et al. 2002), as a result of the temperature effect on aragonite precipitation; - The generation of translucent zones at low feeding conditions or during starvation, as a result of
the associated decrease of the growth flux pG;
The comparison of simulated and real otolith features for known temperature and feeding conditions validate the proposed model and demonstrates that opacity and growth changes can be explained as mainly due to two different factors: temperature variations directly acting on the precipitated volume of aragonite, and metabolic conditions, more precisely the relative effects of the growth and dissipation energy fluxes, acting differently on the relative proportions of the mineral and organic fractions of the newly formed otolith layer.
Apart its clear contribution to the understanding of the formation of the otolith, this model can be viewed as a new tool for reconstructing life traits. For instance, it provides a new back-calculation model for fish length in which changes in metabolic regimes (e.g., starvation periods vs. normal feeding) are well taken into account, which may be provide a generic alternative to previous models such as those proposed in (Hussy and Mosegaard 2004, Schirripa and Goodyear 1997). Similarly, the formalized relation between ring opacity, temperature and metabolic factors permit investigating the reconstruction of the metabolic and feeding history of the fish from opacity opacity for known temperature conditions. Using optimal control techniques (Le-Dimet and Talagrand 1986, Lions 1971), we have presented such an model inversion method and exemplified its application to exhibit feeding behavioral changes of cod reared at low and high temperatures. Such a tool enlarges the potential decoding of the information archived by the otolith. For instance, applied to fish otolith patterns associated with DSTs (Righton et al. 2001), it might permit revealing embolic and/or feeding behavorial changes in relation to fish movements exhibited by DSTs.
The extension of DEB otolith model, initially one-dimensional, to a 2D model is also a important methodological contribution. It benefits from the extraction of level-set representations of otolith shape histories from images (Fablet et al., Fablet et al. 2008). This novel 2D simulation tool provides an easy-to-interpret mean to compare model simulations to real data as illustrated for BS and NS cod otoliths. These simulations also stress the anisotropic feature of otolith growth and opacity. In future work, the extension to a 3D model might be further investigated as well as the combination of the method presented in (Fablet et al.) for shape history reconstruction to the inversion of the DEB model for jointly and directly estimating these two components from otolith images.
Besides, the proposed modeling framework provides the basis for considering additional otolith signatures, especially chemical signatures, such as strontium-calcium ratios, reported to be linked to growth, salinity and/or temperature, or δ13C signatures, assumed to be related to water δ13C values and
the δ13C signatures of the food. These issues are under investigation (Pecquerie et al.). Its extension to
other biominerals such as bivalve shells or corals would also be of great interest. The proposal model is thought to be generic and applicable to such cases.
Effects of feeding conditions and temperature on otolith growth and opacity
The proposed model provides the basis for analyzing the coupled effects of feeding conditions and temperature on otolith growth and opacity. The formation of translucent (conversely opaque) otolith zones may be issued from two different factors:
- a lowering of food resulting in a decrease of the somatic growth rate and of the otolith growth rate; - an increase of the temperature resulting in relatively higher increase of the otolith growth rate
compared to the somatic growth rate (assuming the temperature remains below the optimum temperature for the considered fish species).
The good match between the simulated and experimental data (Figures 3, 5 and 6) demonstrates that the proposed model not only formally conforms to the expected effects of feeding and temperature conditions on otolith growth and opacity, but also numerically approximates the relative influences of these two effects. A number of differences in opacity changes due to feeding lowering and to temperature increase may be stressed:
- the response to the temperature shift is expected to be “instantaneous” (at the considered modelling scale) as it is viewed as a direct effect of the temperature on the dynamics of the precipitation of the aragonitic fraction of the otolith, given that internal fish temperature is strongly servoed to water temperature for endotherm. By comparison, the response to a food lowering is smoother, as the energy stored in the reserve pool allows the fish to smooth its metabolic response. Consequently, fish species with smaller reserve pool (e.g., small pelagic species, such sardines and anchovy) are expected to be more sensitive to food lowering than species associated with larger reserve pools such as cod or hake;
- differences in some physico-chemical features of these two types of translucent zones may also be expected as a output of the proposed modelling framework. The general motivation for considering that the growth flux and the dissipation one do not affect similarly otolith opacity is that these two fluxes may be associated to different types of organic compounds or to different relative proportions of these organic compounds. On the contrary, the temperature effect is only expected to have an effect on the relative proportions of the organic and mineral fractions of the otoliths. The local characterization of the mineral and organic fractions of the otolith zones associated with an opacity shift due, on the one hand, to a feeding lowering, and, the other hand, to a temperature increase, should then permit determining discriminant features of these two situations;
Besides, the comparison of simulated and real otolith patterns for two different cod stocks, namely North Sea cod and Barents Sea cod, further stress the potential of the proposed model to investigate the key factors determining differences in otolith patterns depending on environmental ccnditions and behavioural factors. As such, it should be of particular interest for the determination of protocols for the interpretation of opaque and translucent otolith macrostructures:
- the model provides the basis for better understanding the effects of the environment as well as the biology and the behaviour of the fish on the formation of opaque or translucent otolith zones. As an example, the models offers the potential for simulating changes in metabolic regimes of the fish for instance between migratory and sedentary behaviours;
- it also opens new research directions aimed at discriminating the opaque and translucent otolith strictures resulting from different metabolic an environmental states from fine scale characterizations of the organic and mineral fractions of the otoliths;
- the comparison of simulated and real otolith patterns should assist in the determination of validated interpretation protocols of otolith macrostructures based on explicit hypothesis on the biology of the fish and/or the variability of the environment.
Acknowledgements
The authors are grateful to XXXX for fruitful discussions regarding the development and calibration of the DEB model. This work was supported by project ANR JC OTOCAL.
References
Allemand, D., Mayer-Gostan, N., de Pontual, H., Boeuf, G., and Payan, P. 2007. Fish Otolith Calcification in Relation to Endolymph Chemistry. In Handbook of biomineralization. Edited by E. Bäuerlein, Behrens, P., and Epple, M. (eds.). Wiley. pp. 291-308.
Beckman, D.W., and Wilson, A.W. 1996. Seasonal timing of opaque zone formation in fish otoliths. In Recent developments in fish otolith research. Edited by D.H. Secor, Dean, J.M., Campana, S.E. Univ. of South Carolina Press. pp. 27-43.
Campana, S.E., and Thorrold, S.R. 2001. Otoliths, increments, and elements: keys to a comprehensive understanding of fish populations? Canadian Journal of Fisheries and Aquatic Sciences 58(1): 30-38. Druffel, E. 1997. Geochemistry of corals: proxies of past ocean chemistry, ocean circulation, and climate. Proceedings of the National Academy of Sciences of the United States 94(16): 8354-8361. Fablet, R., Chessel, A., Carbini, S., Benzinou, A., and de Pontual, H. Reconstructing individual shape histories of fish otoliths: a new image-based tool for otolith growth analysis and modeling. Fisheries Research Submitted.
Fablet, R., Daverat, F., and De Pontual, H. 2007. Unsupervised Bayesian reconstruction of individual life histories from otolith signatures: case study of Sr : Ca transects of European eel (Anguilla anguilla) otoliths. Canadian Journal of Fisheries and Aquatic Sciences 64(1): 152-165.
Fablet, R., and Le Josse, N. 2005. Automated fish age estimation from otolith images using statistical learning. Fisheries Research 72(2-3): 279-290.
Fablet, R., Pujolle, S., Chessel, A., Benzinou, A., and Cao, F. 2008. 2D Image-based reconstruction of shape deformation of biological structures using a level-set representation. Computer Vision and Image Understanding 111(3): 295-306.
Folkvord, A., Rukan, K., Johannessen, A., and Moksness, E. 1997. Early life history of herring larvae in contrasting feeding environments determined by otolith microstructnre analysis. Journal of Fish Biology 51: 250-263.
Gardner, J.P., Mather, J.C., Clampin, M., Doyon, R., Greenhouse, M.A., Hammel, H.B., Hutchings, J.B., Jakobsen, P., Lilly, S.J., Long, K.S., Lunine, J.I., McCaughrean, M.J., Mountain, M., Nella, J., Rieke, G.H., Rieke, M.J., Rix, H.W., Smith, E.P., Sonneborn, G., Stiavelli, M., Stockman, H.S., Windhorst, R.A., and Wright, G.S. 2006. The James Webb Space Telescope. Space Science Reviews 123(4): 485-606.
Guibbolini, M., Borelli, G., Mayer Gostan, N., Priouzeau, F., De Pontual, H., Allemand, D., and Payan, P. 2006. Characterization and variations of organic parameters in teleost fish endolymph during day-night cycle, starvation and stress conditions. Comparative Biochemistry and Physiology A: Molecular and Integrative Physiology 145(1): 99-107.
Hoie, H., Andersson, C., Folkvord, A., and Karlsen, O. 2004a. Precision and accuracy of stable isotope signals in otoliths of pen-reared cod (Gadus morhua) when sampled with a high-resolution micromill. Marine Biology 144(6): 1039-1049.
Hoie, H., Folkvod, A., Mosegaard, H., Li, L., Worsoe Clausen, L., Norberg, B., and Geffen, A. 2007. Restricted fish feeding reduces cod otolith opacity. JOURNAL OF APPLIED ICHTHYOLOGY. Hoie, H., and Folkvord, A. 2006. Estimating the timing of growth rings in Atlantic cod otoliths using stable oxygen isotopes. Journal of Fish Biology 68(3): 826-837.
Hoie, H., Folkvord, A., Mosegaard, H., Li, L., Clausen, L.A.W., Norberg, B., and Geffen, A.J. 2008. Restricted fish feeding reduces cod otolith opacity. Jal of Applied Ichtyology 0(0): ???-???
Høie, H., Millner, R., McCully, S., Nedreaas, K.H., Pilling, G.H., and Skadal, J. Seasonality of otolith zone formation; a comparison between the southern North Sea and the Barents Sea cod stocks. Fisheries Research Submitted.
Hoie, H., Otterlei, E., and Folkvord, A. 2004b. Temperature-dependent fractionation of stable oxygen isotopes in otoliths of juvenile cod (Gadus morhua L.). Ices Journal of Marine Science 61(2): 243-251. Hussy, K., and Mosegaard, H. 2004. Atlantic cod (Gadus morhua) growth and otolith accretion characteristics modelled in a bioenergetics context. Canadian Journal of Fisheries and Aquatic Sciences 61(6): 1021-1031.
Hussy, K., Mosegaard, H., and Jessen, F. 2004. Effect of age and temperature on amino acid composition and the content of different protein types of juvenile Atlantic cod (Gadus morhua) otoliths. Canadian Journal of Fisheries and Aquatic Sciences 61(6): 1012-1020.
IBACS. 2006. WP6 report: Long time rearing for monitoring of near natural conditions. IBACS project (Integrated Approach to the Biological Basis of Age Estimation in Commercially Important Fish Species, QQLRT-2001-01610).
Jolivet, A., Bardeau, J.F., De Pontual, H., and Fablet, R. 2008. Fine scale characterization of mineral and organic compounds of fish otoliths using RAMAN spctrometry. In Prep.
Kooijman, S.A.L.M. 2000. Dynamic Energy and Mass Budgets in Biological Systems. Cambridge University Press.
Le-Dimet, F.X., and Talagrand, O. 1986. Variational algorithms for analysis and assimilation of meteorological observations: theoretical aspects. Tellus: 97-110.
Lions, J.L. 1971. Optimal Control of Systems Governed by Partial Differential Equations. Springer-Verlag.
Mugiya. 1965. Calcification inf fish and shell fish: IV. The differences in nitrogen content between opaque and translucent zones of otoliths in some fish. B Jpn Soc Sci Fish 31: 896-901.
Murayama, E., Takagi, Y., and Nagasawa, H. 2004. Immunohistochemical localization of two otolith matrix proteins in the otolith and inner ear of the rainbow trout, Oncorhynchus mykiss: comparative
aspects between the adult inner ear and embryonic otocysts. Histochemistry and Cell Biology 121(2): 155-166.
Murayama, E., Takagi, Y., Ohira, T., Davis, J.G., Greene, M.I., and Nagasawa, H. 2002. Fish otolith contains a unique structural protein, otolin-1. European Journal of Biochemistry 269(2): 688-696. Nisbet, R.M., Muller, E.B., Lika, K., and Kooijman, S. 2000. From molecules to ecosystems through dynamic energy budget models. Jal of Animal Ecology 69(6): 913-926.
Otterlei, E., Folkvord, A., and Nyhammer, G. 2002. Temperature dependent otolith growth of larval and early juvenile Atlantic cod (Gadus morhua). Ices Journal of Marine Science 59(2): 401-410. Panfili, J., de Pontual, H., Troadec, H., and Wright, P. 2003. Manual of Fish Sclerochronology. Eds. Ifremer.
Pecquerie, L., Fablet, R., Lorrain, A., Dufour, E., Nisbet, R., and Kooijman, S.A.L.M. Modeling δ13C dynamics in soft tissues and calcified structures of aquatic organisms in the context of the Dynamic Energy Budget (DEB) theory. In preparation.
Righton, D., Metcalfe, J., and Connolly, P. 2001. Fisheries: Different behaviour of North and Irish Sea cod. Nature 411(6834): 156-156.
Romanek, C.S., and Gauldie, R.W. 1996. A predictive model of otolith growth in fish based on the chemistry of the endolymph. Comparative Biochemistry and Physiology a-Physiology 114(1): 71-79. Schirripa, M.J., and Goodyear, C.P. 1997. Simulation of alternative assumptions of fish otolith-somatic growth with a bioenergetics model. Ecological Modelling 102(2-3): 209-223.
Sollner, C., Burghammer, M., Busch Nentwich, E., Berger, J., Schwarz, H., Riekel, C., and Nicolson, T. 2003. Control of crystal size and lattice formation by starmaker in otolith biomineralization. Science 302(5643): 282-286.
Takagi, Y. 2002. Otolith formation and endolymph chemistry: a strong correlation between the aragonite saturation state and pH in the endolymph of the trout otolith organ. Marine Ecology-Progress Series 231: 237-245.
Tomas, J., Geffen, A.J., Allen, I.S., and Berges, J. 2004. Analysis of the soluble matrix of vaterite otoliths of juvenile herring (Clupea harengus): do crystalline otoliths have less protein? Comparative Biochemistry and Physiology a-Molecular & Integrative Physiology 139(3): 301-308.
van der Meer, J. 2006. An introduction to Dynamic Energy Budget (DEB) models with special emphasis on parameter estimation. Journal of Sea Research 56(2): 85-102.
앾
Télécom Bretagne, 2009 Imprimé à Télécom Bretagne Dépôt légal : juin 2009 ISSN : 1255-2275w
w
w
.t
e
le
c
o
m
-b
r
e
ta
g
n
e
.e
u
Campus de Brest Technopôle Brest-Iroise CS 83818 29238 Brest Cedex 3 France Tél. : + 33 (0)2 29 00 11 11 Fax : + 33 (0)2 29 00 10 00 Campus de Rennes 2, rue de la Châtaigneraie CS 1760735576 Cesson Sévigné Cedex France
Tél. : + 33 (0)2 99 12 70 00 Fax : + 33 (0)2 99 12 70 19 Campus de Toulouse 10, avenue Edouard Belin BP 44004
31028 Toulouse Cedex 04 France
Tél. : +33 (0)5 61 33 83 65 Fax : +33 (0)5 61 33 83 75