HAL Id: hal-02410881
https://hal.archives-ouvertes.fr/hal-02410881
Submitted on 14 Dec 2019
HAL is a multi-disciplinary open access
archive for the deposit and dissemination of
sci-entific research documents, whether they are
pub-lished or not. The documents may come from
teaching and research institutions in France or
abroad, or from public or private research centers.
L’archive ouverte pluridisciplinaire HAL, est
destinée au dépôt et à la diffusion de documents
scientifiques de niveau recherche, publiés ou non,
émanant des établissements d’enseignement et de
recherche français ou étrangers, des laboratoires
publics ou privés.
Fragmentation of Picolinium-Derived Redox Probes
Petra Dunkel, Anna Barosi, Hamid Dhimane, François Maurel, Peter Dalko
To cite this version:
Petra Dunkel, Anna Barosi, Hamid Dhimane, François Maurel, Peter Dalko. Photoinduced
Electron-Transfer (PET) Mediated Fragmentation of Picolinium-Derived Redox Probes. Chemistry - A
Eu-ropean Journal, Wiley-VCH Verlag, 2018, 24 (49), pp.12920-12931. �10.1002/chem.201801684�.
�hal-02410881�
Supported by
Accepted Article
Title: Photoinduced Electron-Transfer (PET) Mediated Fragmentation
of Picolinium-Derived Redox Probes
Authors: Petra Dunkel, Anna Barosi, Hamid Dhimane, Francois Maurel,
and Peter I. Dalko
This manuscript has been accepted after peer review and appears as an
Accepted Article online prior to editing, proofing, and formal publication
of the final Version of Record (VoR). This work is currently citable by
using the Digital Object Identifier (DOI) given below. The VoR will be
published online in Early View as soon as possible and may be different
to this Accepted Article as a result of editing. Readers should obtain
the VoR from the journal website shown below when it is published
to ensure accuracy of information. The authors are responsible for the
content of this Accepted Article.
To be cited as: Chem. Eur. J. 10.1002/chem.201801684
Link to VoR: http://dx.doi.org/10.1002/chem.201801684
FULL PAPER
Photoinduced Electron-Transfer (PET) Mediated Fragmentation of
Picolinium-Derived Redox Probes
Petra Dunkel,
[a][b]Anna Barosi,
[a][b]Hamid Dhimane,
[a]François Maurel,*
[c]and Peter I. Dalko*
[a]Abstract: The photolysis of covalently linked N-alkyl picolinium
phenylacetate — carbazole dyads was analyzed experimentally and by using density functional theory (DFT) and time dependent-DFT (TD-DFT) calculations. In contrast to earlier observations efficient one and two-photon fragmentations conditions were found for 15c (δu = 0.16 GM at 730 nm) opening the way for the design of a novel class of “caged” compounds.
Introduction
Light-sensitive probes (“caged compounds”) became popular tools in cellular biology, physiology and neurosciences and are used for the controlled release of a variety of biologically relevant substrates.1 Although sensitized probes, in which the
light-harvesting and working elements are functionally disconnected, allow considerably larger flexibility in the optimization process, somewhat surprisingly only modest interest has been paid for the development of such probes.2
Redox-gated systems are among those, developed essentially around the 4-picolyl family.3 The reduction potentials of the
parent phenacyl (Ered = –2.20 V vs SCE) and 4-picolyl esters
(Ered = –2.62 V vs SCE) were improved by N-alkylation of the
heterocycle (N-methyl-4-picolinium: Ered = –1.10 V vs SCE), and
also by adding electron-withdrawing groups to the pyridinium ring (2-cyano-picolinium esters Ered ≈ –0.50 V vs SCE).4 In
parallel, N-alkylpicolinium (NAP)+ mediator systems with
ketocoumarin dyes,5 gold nanoparticles6 and
tris(bipyridyl)ruthenium(II) (Ru(bpy)) dyes4 were developed for
the liberation of carboxylic acids, amino acids, phosphates, primary aliphatic and aromatic amines, under redox conditions.7
Liu et al. described a release system composed by an electron donor, typically L-cysteine or DTT, a semiconductor quantum dot
electron shuttle and NAP ester prodrug as acceptor.8 Most of the
biological applications require water-soluble probes with controlled, covalently linked donor-acceptor structure, however. Surprisingly the use of the tethered N-alkyl picolinium phenylacetate - carbazole dyad turned inefficient. 9,10,11 Although
the unlinked analogues released the carboxylate ligands, in the presence of an appropriate sensitizer with high efficiency, the tethered probe was inert even under prolonged irradiation.9,12 As
no charge-transfer intermediates were detected in laser flash
photolysis experiments, neither significant fluorescence was observed, authors suggested that the competing back electron transfer was the main deactivation path that occurred faster than the bond cleavage.9 Also, a fluorene-sensitized picolinium
derivative sensitive to two-photon activation has been prepared by the Anderson group.13,14 The construct suffered, however,
hydrolytic instability and low uncaging efficiency, presumably due to the fast back electron transfer, as was hypothesized in the earlier experiment.
In the wake of our program on the development of light-sensitive probes,15 we were interested in examining the
perspectives and pertinence of picolinium derivatives as redox-sensitive elements in covalently linked electron donor-acceptor dyads under PET conditions. Here we wish to disclose a first systematic study on the NAP platform.
Results and Discussion
N-Methyl picolinium phenylacetates 7, 9 and 11 (Scheme 1, path
A) were prepared by reduction of the corresponding pyridine carboxaldehydes followed by acylation using phenylacetyl chloride, and N-methylation of the resulting picolines (compounds 1, 3 and 5) in the presence of methyl triflate (for further details see the Experimental section). In turn, compounds
8, 10 and 12 were prepared by addition of methylmagnesium
bromide to the corresponding aldehydes followed by acylation, using phenylacetyl chloride and quaternarization in the presence of methyl triflate (Scheme 1, path B).
Scheme 1. Synthesis of N-methyl picolinium phenylacetates 7-12.
Redox potentials of the prepared phenylacetates were measured by cyclic voltammetry (Figure 1). Electrochemical experiments were performed at c = 1.0 mM concentration of the picoliniums, in dry ACN with [Bu4N][PF6] as the supporting
electrolyte (scan rate: 100 mV/s). Glassy carbon working and platinum auxiliary electrodes were used and the potential was
N 1 C(4) 3 C(3) 5 C(2) O H O Ph N 1) MeMgBr THF O Me O Ph N 7 C(4) 9 C(3) 11 C(2) O H O Ph N 8 C(4) 10 C(3) 12 C(2) O Me O Ph Me Me OTf N CHO 2 3 4 OTf MeOTf DCM MeOTf DCM 1) NaBH4 MeOH 2) PhCH2COCl 2) PhCH2COCl A B 2 C(4) 4 C(3) 6 C(2)
[a] Dr P. Dunkel, Dr A. Barosi, Pr Dr H. Dhimane, Dr P. I. Dalko
Université Paris Descartes, Laboratoire de Chimie et Biochimie
Pharmacologiques et Toxicologiques, UMR8601
45, rue des Saints-Pères, 75270, Paris Cedex 06, France
E-mail: peter.dalko@parisdescartes.fr
[b] Dr P. Dunkel and Dr A. Barosi contributed equally to this work.
[c] Pr Dr F. Maurel
Université Paris Diderot, Sorbonne Paris Cité, ITODYS, UMR CNRS 7086, 15 rue J-A de Baïf, 75013, Paris, France E-mail: maurel@univ-paris-diderot.fr
Supporting information for this article is given via a link at the end of the document.
Accepted
measured relative to ferrocene / ferrocenium reference. Cyclic voltammograms (see SI) showed irreversible redox processes for all six substrates, 7-12. The first reduction potential was observed between Ered = −1.09 V and Ered = −1.37 V, with Ered =
−1.11 V for 7 which is very close to the reported Ered = −1.08 V
value measured for the corresponding perchlorate salt.3
Compounds 7, 8 and 11, 12 (i.e. the C(2) and C(4) regioisomers) showed invariably smaller reduction potential than C(3) derivatives, 9 and 10. The nature of the side-chains i.e. primary
vs secondary esters affected only marginally the reduction
potentials.
Figure 1. Experimental and calculated (in parenthesis) reduction potentials of
N-methyl picolinium phenylacetates.
The ET ability of compounds 7-12 was analysed by DFT calculations as well.16,17 Redox potentials were calculated at the
most stable conformations according to the thermodynamic cycle depicted in Scheme 2.
Scheme 2. The thermodynamic cycle of the one-electron reduction of picolinium probes in acetonitrile (ACN) solution.
The standard Gibbs free energy of the overall reaction in solution can be expressed as follows:
Δ𝐺!"#$%!"# = Δ𝐺!"#$%!"# − Δ𝐺!"# 𝑀! + Δ𝐺!"# 𝑀 Δ𝐺!"#$%!"# = Δ𝐺!"#$%!"# + ΔΔ𝐺!"# where Δ𝐺!"#$%!"# = 𝐺!"# 𝑀 − 𝐺!"#(𝑀!) and ΔΔ𝐺!"#= Δ𝐺!"# 𝑀 − Δ𝐺!"# 𝑀!
and the redox potential is related to Δ𝐺!"#$%!"# as
Δ𝐺!"#$%!"# = −𝐹𝐸!"#$%°
where F is the Faraday constant, 23.06 kcal·mol-1·V-1. The
standard hydrogen electrode potential, VSHE was taken as
4.43 eV. Experimental values were compared in Figure 1. Noteworthy, calculated values correlate well with the experimental data (Figure 1).
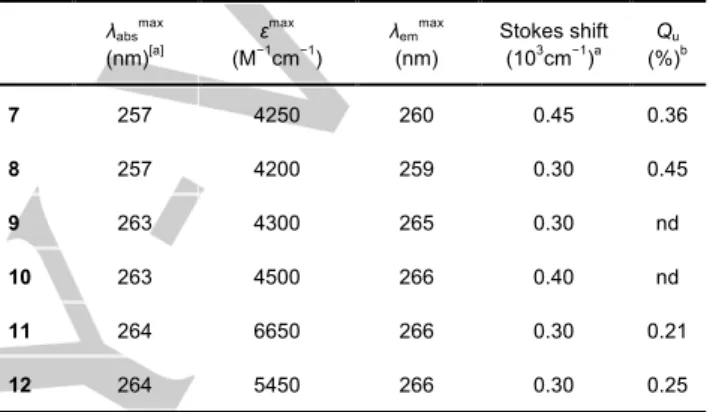
The UV–Vis spectra of 7 (c = 0.1 mM) did not show appreciable solvatochromism as was deduced by comparing spectra in dichloromethane, acetonitrile, methanol and in a mixture of acetonitrile / TRIS buffer (1 / 1) solution at 293 K (see SI-Figure 1). Absorption spectra of compounds 7-12 in acetonitrile / TRIS buffer (1 / 1) showed maxima around 257-264 nm with a shoulder corresponding to a π-π* transition and a very weak absorbance above 300 nm. Upon irradiation at 255 nm, the solution of compounds 7-12 exhibited a blue photoluminescence (PL) with a single peak at the 259 - 266 nm region, respectively (Table 1).
Table 1. Photophysical properties of compounds 7-12.
λabsmax (nm)[a] ε max (M−1 cm−1 ) λemmax (nm) Stokes shift (103 cm−1 )a Qu (%)b 7 257 4250 260 0.45 0.36 8 257 4200 259 0.30 0.45 9 263 4300 265 0.30 nd 10 263 4500 266 0.40 nd 11 264 6650 266 0.30 0.21 12 264 5450 266 0.30 0.25
[a] Stokes shift = 1/λabs – 1/λem. [b] See SI for details.
Among various sensitizers, 9-methylcarbazole (9-MC) was selected for the PET study. 9-MC is a well characterized chromophore, with a relatively high wavelength absorption maximum (λabsmax = 345 nm) and it is a strong reducing agent at
the excited state with an Eox* = –2.51 V vs SCE.19 Tethered
dyads 14-19 were prepared from picolyl phenylacetic esters 1-6, by using carbazoles 13a-c, having propyl-, hexyl-, or, dodecyl triflate side chains, respectively (Scheme 3). Similar to the non-tethered analogues, no appreciable solvatochromic effect was found for 14a in dichloromethane, acetonitrile, methanol and in a mixture of ACN / TRIS buffer (1 / 1) solution, at a concentration of c = 0.1 mM at 293 K between 250 – 500 nm (SI-Figure 3). UV spectra of 14–19 were recorded in ACN / TRIS buffer 1 / 1 (SI-Figures 4-9). All spectra appeared qualitatively similar, showing essentially the strong absorption of the tethered carbazole due to the larger molar extinction coefficient in the 300 – 450 nm region compared to picoliniums. First absorption maxima located around λabsmax = 341 – 346 nm with molar extinction at the
absorption maxima between εmax = 2250 and 3600 M-1cm-1
(SI-Figures 4-9). Differences were observed, however, in the UV absorption spectra between regioisomers and compounds having different spacer lengths. Longer spacers resulted invariably in bathochromic shifts: 14a–19a having propyl spacer (n = 3) were slightly blue-shifted (λabsmax = 341 and 342 nm)
compared to the free 9-MC, while for 14c–19c (n=12) maxima were slightly red-shifted (λabsmax = 346 nm) respectively (Table 2).
N N N Me Me Me R R R R=H -1.11 V (-1.14 V) R=CH3 -1.14 V (-1.14 V) R=H -1.35 V (-1.18 V) R=CH3 -1.37 V (-1.24 V) R=H -1.09 V (-1.03 V) R=CH3 -1.15 V (-1.12 V) 7 8 9 10 11 12 O O Ph O O Ph O O Ph OTf OTf OTf
M
+(g)
ΔG
M (g)
gas redoxM
+(ACN)
M (ACN)
ΔG
ACNredoxΔG
ACN(M
+)
ΔG
ACN(M)
Accepted
Manuscript
FULL PAPER
Noteworthy, propyl tethered analogs 14a–17a showed a broad weak absorption shoulder between 350 and 410 nm (C(3) and C(4) isomers).
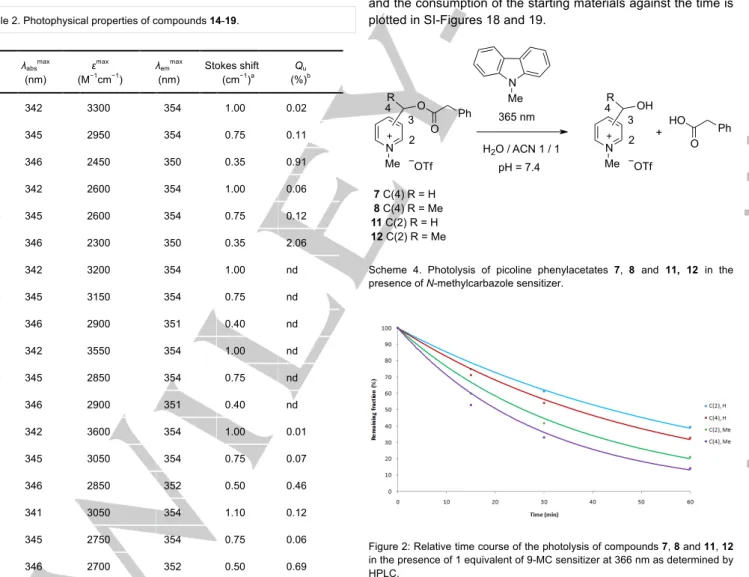
Scheme 3. Synthesis of tethered picoline phenylacetate-carbazole dyads 14-19. Table 2. Photophysical properties of compounds 14-19.
λabsmax (nm) εmax (M−1 cm−1 ) λemmax (nm) Stokes shift (cm−1 )a Qu (%)b 14a 342 3300 354 1.00 0.02 14b 345 2950 354 0.75 0.11 14c 346 2450 350 0.35 0.91 15a 342 2600 354 1.00 0.06 15b 345 2600 354 0.75 0.12 15c 346 2300 350 0.35 2.06 16a 342 3200 354 1.00 nd 16b 345 3150 354 0.75 nd 16c 346 2900 351 0.40 nd 17a 342 3550 354 1.00 nd 17b 345 2850 354 0.75 nd 17c 346 2900 351 0.40 nd 18a 342 3600 354 1.00 0.01 18b 345 3050 354 0.75 0.07 18c 346 2850 352 0.50 0.46 19a 341 3050 354 1.10 0.12 19b 345 2750 354 0.75 0.06 19c 346 2700 352 0.50 0.69
[a] Stokes shift = 1/λabs – 1/λem. [b] See SI for details.
The low-lying LUMOs of 7–12 suggest that photoactivated
N-methyl carbazole may easily reduce these substrates.20
Noteworthy, the energy of the charge-transfer (CT) states of N-methyl picoliniums, and also dyads, were estimated beneath of the lowest optically strongest allowed excited states.
The fragmentation of compounds 7-12 was studied in the absence and in the presence of 9-MC sensitizer, as well as for the tethered analogs 14-19 in TRIS / ACN (1 / 1) mixture under modified Falvey’s conditions at 366 nm, using a 8 W Carl Roth lamp (Scheme 4; for details see Experimental part). Esters 7-12 having only very weak transitions at 366 nm showed no fragmentation upon photolysis under prolonged irradiation (2 h), thus compounds 7-12 can be considered as photochemically inert under the examined conditions. The sensitized PET study of 7-12 was performed in the presence of a stoichiometric amount of 9-MC in TRIS / ACN (1 / 1) mixture at c = 0.1 mM, and the kinetic course of the photolysis is depicted in Figure 2. Noteworthy, efficient fragmentation was observed for all C(2) and C(4) isomers respectively (7, 8, 11 and 12), C(3) derivatives were inert in the presence, or, absence of 9-MC.
The time course of the PET reaction was followed by HPLC and the consumption of the starting materials against the time is plotted in SI-Figures 18 and 19.
Scheme 4. Photolysis of picoline phenylacetates 7, 8 and 11, 12 in the presence of N-methylcarbazole sensitizer.
Figure 2: Relative time course of the photolysis of compounds 7, 8 and 11, 12 in the presence of 1 equivalent of 9-MC sensitizer at 366 nm as determined by HPLC. N N OTf n N N n 1 C(4) R = H 2 C(4) R = Me 3 C(3) R = H 4 C(3) R = Me 5 C(2) R = H 6 C(2) R = Me 13a n = 3 b n = 6 c n = 12 O R O Ph OTf O R O Ph 2 3 4 14 C(4) R = H; a n = 3; b n = 6; c n = 12 15 C(4) R = Me; a n = 3; b n = 6; c n = 12 16 C(3) R = H; a n = 3; b n = 6; c n = 12 17 C(3) R = Me; a n = 3; b n = 6; c n = 12 18 C(2) R = H; a n = 3; b n = 6; c n = 12 19 C(2) R = Me; a n = 3; b n = 6; c n = 12 N N Me 7 C(4) R = H 8 C(4) R = Me 11 C(2) R = H 12 C(2) R = Me O R O Ph 2 3 4 Me OTf 365 nm pH = 7.4 H2O / ACN 1 / 1 N OH R 2 3 4 Me OTf HO O Ph +
Accepted
Manuscript
Monitoring the photolysis of esters 7 and 8 by H NMR confirmed the release of phenylacetic acid and the formation of the corresponding picolyl alcohols as major products (Table 3; for details see Experimental part). The photolysis was run in a mixture of CD3CN / D2O (4 / 1), and the conversion of the
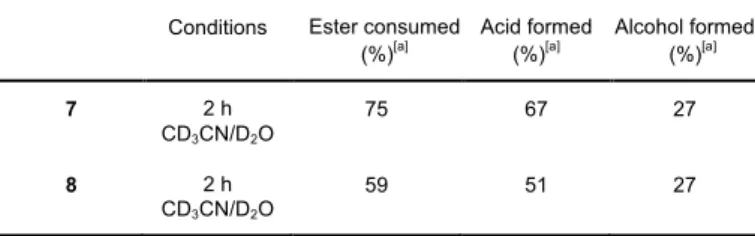
reaction was analysed after 2 h irradiation at 254 nm. Although the formation of the phenylacetic acid was observed in 89% (± 5%) and 86% (± 5%) yields (not isolated) at 75% and 59% conversions, respectively, important photobleaching of the picolinium was showed also as merely 36% and 46% (± 5%) of the expected hydroxymethylene derivatives were found at the same conversions. Noteworthy, no trace of decarboxylated product was observed within the detection limit. This observation is in agreement with the mechanistic rational proposed by Falvey et al. (Scheme 5) that suggests heterolytic rather than homolytic bond cleavage as the major photolysis path.9,11
Table 3. Photolysis of picolinium esters 7 and 8.
Conditions Ester consumed
(%)[a] Acid formed
(%)[a] Alcohol formed
(%)[a] 7 2 h CD3CN/D2O 75 67 27 8 2 h CD3CN/D2O 59 51 27 [a] Calculated by 1
H NMR using hexamethyldisiloxane as internal standard.
Scheme 5.
The mechanism of the photofragmentation according to Falvey.9,11
Noteworthy, the photolysis of the tethered dyads showed important concentration dependency in acetonitrile / TRIS mixture (1 / 1) (See SI-Figure 11). This dependency was attributed to the intermolecular π-π stacking interaction, and to the formation of aggregates between the carbazole units, rather than to inner filtering. In order to avoid aggregate formations a c = 0.1 mM solution was used in a TRIS (20 mM) / acetonitrile (1 / 1) (pH = 7.4) mixture, where no more dependency of the photolysis on the concentration was observed.
When tethered dyads 14a and 18a having a propyl linker were irradiated (366 nm), modest conversions were observed after 2 h, whereas α-methyl substituted analogs, 15a and 19a, offered clean and fast conversions (Figures 3 and 4). No
appreciable fragmentation was observed for C(3) derivatives
16a and 17a. Dyads having hexyl or dodecyl linkers (14-19b and c) showed more efficient fragmentations, and α-methyl
substituted derivatives offered systematically cleaner and faster conversions.
Scheme 6. Photolysis of tethered N-carbazole picoline phenylacetates 14a-c,
15a-c, 18a-c and 18a-c.
Figure 3: Relative time course of C(2) regioisomers photolysis at 366 nm determined by HPLC.
Figure 4: Relative time course of C(4) regioisomers photolysis at 366 nm determined by HPLC.
Finally, the most efficient dyad 15c was examined under two-photon (TP) irradiation conditions. Two-photon excitation
N R O 7 R = H 8 R = Me Me O OTf + 9-MC N R O Me O OTf * + 9-MC O O N R Me + H2O - e hν N R OH Me hν H2O N N n O R O Ph 14 C(4) R = H; a n = 3; b n = 6; c n = 12 15 C(4) R = Me; a n = 3; b n = 6; c n = 12 18 C(2) R = H; a n = 3; b n = 6; c n = 12 19 C(2) R = Me; a n = 3; b n = 6; c n = 12 365 nm pH = 7.4 H2O / ACN 1 / 1 N OH R 2 3 4 HO O Ph + N n OTf OTf
Accepted
Manuscript
FULL PAPER
possesses several advantages over more conventional single-photon activation conditions, such as higher spatial resolution, and also the fact, that scattered IR photons do not produce out of focus activation.1,21 The uncaging cross section (δ
u) of
phenylacetate 15c was determined directly from the consumption of the starting material. A 45 µL sample of a 0.1 mM ACN/TRIS 1/1 solution was irradiated using mode-locked Ti-Sapphire laser source at 730 nm wavelength (50 fs pulses at 80 MHz). The expanded beam was focused with a 32 mm lens so that the whole of the excitation volume was contained in the cuvette. Sample was irradiated for 4.5 h at 156 mW average power. The loss of the cage was quantified by HPLC, and the photolysis cross section calculated from the rate of reduction of the fractional cage concentration, giving a high, experimentally measured uncaging cross-section of δu = 0.16 GM, a remarkably
high value for a non-optimized structure.
Conformational analysis
In all calculated structures the electron-transfer impacted significantly the geometry of picolinium acceptor resulting generally in increased bond lengths and in the formation of more quinoidal structures. The TD-DFT optimized geometry of 7 in the S1 state is depicted in Figure 9 (see also SI-Table 2). The most
significant changes are the rotation of the phenyl group (of the phenylacetic ester) and the elongation of the O-CH2 bond from
1.419 (S0) to 1.502 Ǻ (S1) with an important diminution of the
torsion angle from 171° (S0) to 94.7° (S1). These changes are
controlled by the energy of the LUMO (see SI-Figure 14) and result in a π-stacked face-to-face arrangement of the picolinium and the phenyl rings, and also, a weakening of the O-CH2 bond.
Similar geometric changes were found between the calculated structures for the S0 to S1 transitions of 14a and 14c,
respectively (Figure 9).
Conformational analysis of compounds 7-12 was performed by semi-empirical calculations using AM1 Hamiltonian allowing the generation of the potential energy surfaces (SI-Figures 12 and 13). All conformation energy minima were optimized at the highest DFT level. In the following, results obtained for compound 7 are discussed, while qualitatively similar results were obtained for compounds 8-12 as well.
Two conformations with energy minima on the potential energy surfaces have been found for compound 7, hereafter named as extended and folded (SI-Figure 13). In the extended conformation dihedral angles α, β, γ and δ are close to 180°. In the folded conformation β is –89.4°, resulting in a more compact arrangement. Noteworthy, the phenyl group is orthogonal to the plan of the ester in both conformations (ε is close to 90°). Remarkably both conformations have similar stability in acetonitrile suggesting that they coexist in the medium.
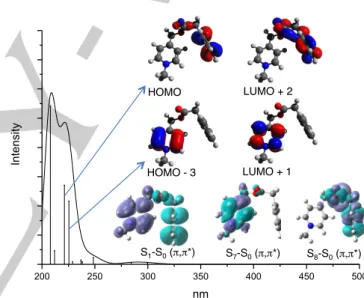
The absorption spectra of compounds 7-12 were calculated from the extended and folded conformations, respectively, using TD-DFT method (Figure 5). The calculated spectra show similar characteristics to the experimental ones, and the calculated lowest-energy electronic transitions correlate well with experimental values. The absorption spectrum of 7 in the folded conformation is dominated by several very weak bands around 300 nm that originate from electronic mono-excitations between orbitals localized on both aromatic rings and thus can be characterized as a π-π* charge transfer.
Figure 5. Calculated absorption spectrum of compound 7 representing main
orbitals implied in the electronic excitations and Sn-S0 density plots.
Figure 6. The S1 optimized geometries of 7, 14a and 14c.
200 250 300 350 400 450 500 In te nsi ty nm HOMO HOMO - 3 LUMO + 2 LUMO + 1 S1-S0 (π,π*) S7-S0 (π,π*) S8-S0 (π,π*)
Accepted
Manuscript
Therefore all these weak transitions show a charge transfer character between picolinium and phenyl rings. Two transitions are calculated at 225 (S0àS7) and 221 nm (S0àS8) and can be
assigned to the observed 255 and 258 nm transitions in the experimental spectrum. The S0àS7 transition involves HOMO-3
and LUMO+1 orbitals and corresponds to a picolinium-localized excitation while the S0àS8 transition (HàL+2) is localized on the
phenyl group. The character of the lowest excited states of 7, as charge transfer or localized states, can be determined using the S0-Sn differences density plot as presented in Figure 2. The
spatial arrangement of the tethered donor-acceptor dyads were considered next and is illustrated by the analysis of compounds
14a-c. Noteworthy, the aliphatic linker allows high degree of
conformational flexibility: a systematic conformational study of such element is beyond of the scope of this study. The conformation of compound 14a was generated by the addition of the N-propyl-carbazole fragment to the optimized folded geometry of 7. As was seen with the untethered picolinium probes, two conformation minima were found, denoted as
extended and folded (SI-Figure 14). The propyl chain adopts a trans-trans conformation in the extended and syn-pentane
conformation in the folded conformation, respectively. Noteworthy, the carbazole and picolinium rings adopt face-to-face orientation in the folded geometry (the N-N distance is estimated 3.09 Å). The energy difference between the extended and folded structures is relatively small (0.4 kJ.mol-1) suggesting
that the energetic penalty associated to the staggered conformation of the propyl chain in the folded geometry is compensated by a π-π interaction between the carbazole and picolinium units.
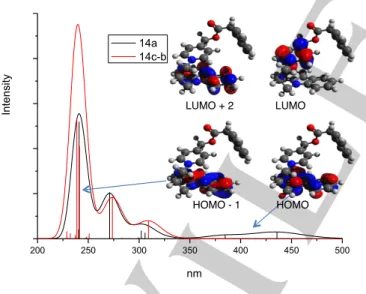
Figure 7. Calculated absorption spectra of compound 14a (black) and 14c-b (red), main orbitals involved in the first electronic excitations of 14a.
Several conformational minima of 14c were found on the potential energy surface, and labelled as a-d (SI-Figure 14). In the most stable conformation, 14c-a, the dodecyl chain adopts an all-trans arrangement. Others, such as 14c-b, 14c-c and
14c-d display a more folded structure. Noteworthy, the
carbazole is in the close proximity of the phenyl group in the second most stable conformation, 14c-b.
The calculated absorption spectrum of 14a (Figure 7) is in agreement with the experimental data (SI-Figure 4) and presents two regions. In the 200-350 nm window the spectrum shows three bands at 241 nm, 271 nm and around 300 nm. These bands reproduce nicely the spectrum of 9-MC19 and
originate from the localized excitation of the carbazole. The second region shows two weakly allowed charge transfer bands at 385 nm and 436 nm. These transitions are dominated by the HOMOàLUMO and HOMO-1àLUMO contributions. From the localization of these orbitals it is obvious that both transitions involve charge transfers from the carbazole to the picolinium (Figure 5 and SI-Table 4).
The absorption spectrum of 14c is similar to that of 14a in the region of 200-350 nm. Unlike the calculated absorption spectrum of 14a, the calculated absorption spectrum of 14c shows no charge transfer bands in the low energy region. This is probably due to the large spatial separation between the carbazole and picolinium units in the optimized geometries.
Conclusion
The single- and two-photon photolysis of 9-MC tethered picolinium probes were examined by experimental and theoretical approaches. These probes were considered photochemically inert earlier under similar conditions. Probes undergo tether length-dependent fragmentation: dyads with n = 12 carbon tether were photolyzed 30-40 times more efficiently at 366 nm than that of n = 3 derivatives. α-Methyl substituted derivatives offered systematically cleaner and faster conversions. Communication between the picolinium and carbazole chromophores was observed experimentally and analyzed by density functional theory (DFT) and time dependent-DFT (TD-DFT) calculations. The most efficient dyad, 15c, was photolyzed under TP irradiation conditions at 730 nm showing promisingly high δu = 0.16 GM uncaging cross-section.
9-MC tethered picolinium probes can be considered as new “caging” group leads in which the absorption and fragmenting elements are spatially separated, allowing much easier optimization than that of more conventional probes in which this two functions are intimately linked in the same heterocycle. Further applications in neurophysiology are underway.
Experimental Section
The UV irradiation experiments were accomplished by irradiation of a solution in roughly 0.1 mM concentration in an acetonitrile/TRIS buffer 1/1 solvent mixture (pH 7.4). The plot of lnA versus irradiation time showed a linear correlation for the disappearance of the starting material, which suggested a first order reaction, obtained by the linear least squares methodology for a straight line. For the UV irradiation, an aliquot (1 mL) of the solution was irradiated at approximately 366 nm by using 8W Carl Roth lamp. Between each irradiation a small aliquot (50 µL) of the solution was removed for analysis by reverse-phase HPLC using dual absorbance detection at 260 and 360 nm. Optical densities at 366 nm 200 250 300 350 400 450 500 In te n si ty nm 14a 14c-b LUMO + 2 LUMO HOMO - 1 HOMO
Accepted
Manuscript
FULL PAPER
were kept around 0.1 so that aggregate formation /inner-filtering of the irradiation and spatial gradients of concentrations could be neglected, and the progress curves were simple decaying exponentials. Dark hydrolysis rates were measured similarly except without illumination. One-photon quantum yields were determined by using Eq 1:
Qu = [σ(λexc)I0(λexc)t90%]-1 (Eq 1)
where σ(λexc) is the decadic extinction coefficient of the compound at the excitation wavelength (103 times ε), t90% is the time at which 90% of the product was converted, as determined by HPLC, and I0(λexc)is the light intensity at the excitation wavelength and is measured in einstein.cm-2.s-1.22The light intensityI0 value was determined by potassium ferrioxalate actinometry.22,23 Briefly, a 6.0 mM potassium ferrioxalate solution (3 mL) was irradiated for 60 s. An aliquot of the irradiated solution (2 mL) was added to NaOAc buffer (3 mL), 0.1% phenanthroline solution (3 mL) and 2 M KF solution (1 mL) and the volume was completed to 25 mL by distilled water. A blank sample was prepared the same way, except irradiation. Samples were kept 1 h in the dark for complexation then the absorbance was measured at 510 nm. The light intensity was calculated by using Eq 2:
𝐼 = !3 !!510
!"""!510V2ϕFet
(Eq 2)
where V3 is the final volume after dilution (25 ml), V2 is the volume of the aliquot taken for analysis (2 ml), ΔD510 is the difference of absorption of the irradiated sample and the blank at 510 nm, ε510 is the extinction coefficient of the (Fe(phen)32+) complex at 510 nm (11100 M-1cm-1), ϕFe is the quantum yield for ferrous ion formation at the irradiation wavelength and t is the irradiation time (s).
Electrochemical experiments were done on a voltammetry analyzer (Autolab PGSTAT101) with [Bu4N][PF6] as the supporting electrolyte (one chamber three electrode cell). The electrodes used were a glassy-carbon working, a platinum auxiliary, and the potential was measured relative to ferrocene/ferrocenium reference. The solution (1 mM for compound studied) was purged with nitrogen for 10 min prior to recording. Values obtained were converted to SCE by adding 0.40 V to the measured potentials.
HPLC analyses were carried out on Water 515 device with a normal inverse phase column X-Terra® MS C18 (length: 75 mm, diameter: 4.6 mm, stationary phase: 2.5 µm) using a Waters 2487 Dual Absorbance Detector (260-360 nm) and an isocratic system of elution (MeOH-MeCN-H2O 7-2-1 / (MeOH-MeCN-H2O AcONH4 (10 mM) pH 4.6). The volume of injection was 10 µL.
Thin-layer chromatography was performed on aluminium-backed Merck Kieselgel 60 F254 pre-coatedplates. Proton nuclear magnetic resonance (1H NMR) spectra and carbon nuclear magnetic resonance (13C NMR) spectra were recorded on a Bruker 250 spectrometer (250 MHz and 63 MHz) and on a Bruker AV-500 spectrometer (500 MHz and 125 MHz). Chemical shifts for proton sare reported in parts per million downfield from tetramethylsilane (TMS) and are referenced to residual proton in the NMR solvent (CDCl3: δ 7.26, CD3CN: δ 1.94). Chemical shifts for carbon are reported in parts per million downfield from tetramethylsilane and are referenced to the carbon resonance softhe solvent (CDCl3: δ 77.16, CD3CN: δ 118.26). Data are represented as follows: chemical shift, integration, multiplicity (s = singlet, d = doublet, dd = double doublet, t = triplet, q = quadruplet, qn = quintuplet, b = broad, m = multiplet), coupling constants in Hertz (Hz). All solvents and inorganic reagents were from commercial sources and used without purification unless otherwise noted. The mass analyser was an Agilent from ThermoFisher. The capillary
tension was 3.5 kV. The cone tension was 24 V. The temperature of the source was 130 °C and the temperature of desolvatation was 350 °C. Data were treated on ThermoQuest.
Characterization of the photolysis products by 1H NMR A solution of
4 µmol of picolinium esters 7 and 8, respectively, with an equal amount of 9-MC sensitizer was dissolved in about 0.5 mL of CD3CN/D2O (4/1) solvent mixture. Hexamethyl-disiloxane was added as internal standard. NMR spectra were recorded before irradiation, then the samples were transferred to a quartz cuvette for the irradiation. The solutions were irradiated at 366 nm for 2 h by using a 8 W Carl Roth lamp, then re-transferred to an NMR tube for analysis following the irradiation. Yields were determined by 1H NMR integration of the compound characteristic peaks relative to the internal standard.
TP photolysis NIR photolysis were performed by irradiation of a sample
solution (0.1 mM) in acetonitrile/TRIS buffer 1/1 solvent mixture (pH 7.4) for 1-4 hours. Two photon uncaging cross-sections (δu) were calculated from the fractional conversion of the cage with exposures of approx. 4 hours in a 45 microliters cuvette of 3 mm path length. The expanded output of a MaiTai BB (Spectra-Physics) pulsed laser was focused with a 30 mm focal length lens into the cuvette. The two-photon excitation volume was entirely contained within the cuvette volume to obviate the need to measure the beam waist. Beam parameters were 730 nm with 150 fs pulse width at 80 MHz and 100 mW average power after the cuvette. Samples were centrifuged if necessary to remove particles if apparent in the transmitted beam. For reference the two-photon uncaging cross-section for L-glutamate release from the widely used MNI-caged glutamate determined in this way was 0.05 GM (10-50cm4s/photon). The conversion of the product was assayed by HPLC by monitoring the remaining caged compound. The two-photon uncaging cross section δu was calculated as follows (Eq 3):
𝛿!= 3.41 x conversion % x !!!!!!!!(!"!)! (Eq 3)
where δu = TP uncaging cross-section (cm4.s/photon); V = sample volume (45×10-3cm3);
τ
P= pulse width; f = 80×106 Hz; n = 1.3;λ = wavelength (cm); t = exposure time (s); h = 6.6×10⁻³⁴J.sec;
c = 3×1010cm.s-1; P = average power (W).
Synthesis of esters 1-6
To a solution of the appropriate pyridylcarbinol (3.0 mmol) and triethylamine (1.5 eq, 4.5 mmol, 627 µL) in 10 mL acetonitrile, phenylacetyl chloride (1.5 eq, 4.5 mmol, 595 µL) was added. The reaction mixture was stirred at rt for 16 h. Dichloromethane and water were added, the organic phase was washed with water and brine, dried over Na2SO4, filtered and evaporated to dryness. The crude product was purified by column cromatography on silica gel (cyclohexane/EtOAc 4/1).
Pyridin-4-ylmethyl 2-phenylacetate (1)
Yellow oil (498 mg, 73%). 1H NMR (CDCl3, 250 MHz): δ 8.60 (d, J=4.7 Hz, 1H), 7.68 (td, J= 7.5 ,1.5 Hz, 1H), 7.36-7.29 (m, 5H), 7.26-7.21 (m, 2H), 5.28 (s, 2H), 3.77 (s, 2H). 13C NMR (CDCl3, 125 MHz): δ 171.0, 149.8, 145.2, 133.6, 129.4, 128.9, 127.5, 122.0, 64.6, 41.4. MS (ESI): m/z = 228.2 [M+H]+. HRMS (ESI): m/z calcd for [C14H13O2N+H]+ 228.1019, found 228.1012. 1-(Pyridin-4-yl)ethyl 2-phenylacetate (2) Yellow oil (565 mg, 78%). 1H NMR (CDCl3, 500 MHz): δ 8.52 (d, J=6.0 Hz, 2H), 7.34-7.30 (m, 3H), 7.30-7.25 (m, 2H), 7.12 (dm, J=6.0 Hz, 2H),
Accepted
Manuscript
5.83 (q, J=6.5 Hz, 1H), 3.67 (s, 2H), 1.50 (d, J=7.0 Hz, 3H). C NMR (CDCl3, 125 MHz): δ 170.6, 150.7, 149.9, 133.7, 129.3, 128.7, 127.4, 120.7, 71.8, 41.6, 22.0. MS (ESI): m/z = 242.2 [M+H]+. HRMS (ESI): m/z calcd for [C15H15O2N+H]+ 242.1176, found 242.1169.
Pyridin-3-ylmethyl 2-phenylacetate (3)
Yellow oil (586 mg, 86%). 1H NMR (CDCl3, 500 MHz): δ 8.58-8.56 (m, 2H), 7.61 (dt, J=8.0, 2.0 Hz, 1H), 7.34-7.31 (m, 2H), 7.28-7.25 (m, 4H), 5.14 (s, 2H), 3.67 (s, 2H). 13C NMR (CDCl3, 125 MHz): δ 171.3, 149.6, 149.6, 136.1, 133.7, 131.7, 129.4, 128.8, 127.4, 123.6, 64.1, 41.4. MS (ESI): m/z = 228.1 [M+H]+. HRMS (ESI): m/z calcd for [C14H13O2N+H]+ 228.1019, found 228.1012. 1-(Pyridin-3-yl)ethyl 2-phenylacetate (4) Yellow oil (623 mg, 83%). 1H NMR (CDCl3, 500 MHz): δ 8.56 (d, J=2.0 Hz, 1H), 8.53 (dd, J=4.5, 1.5 Hz, 1H), 7.57 (dt, J=7.5, 2.0 Hz, 1H), 7.34-7.28 (m, 4H), 7.25-7.23 (m, 2H), 5.91 (q, J=7.0 Hz, 1H), 3.65 (bs, 2H), 1.55 (d, J=6.5 Hz, 3H). 13C NMR (CDCl3, 125 MHz): δ 170.8, 149.3, 147.9, 137.1, 133.9, 133.8, 129.4, 128.8, 127.3, 123.5, 70.7, 41.7, 22.1. MS (ESI): m/z = 242.1 [M+H]+. HRMS (ESI): m/z calcd for [C15H15O2N+H]+ 242.1176, found 242.1171. Pyridin-2-ylmethyl 2-phenylacetate (5) Yellow oil (566 mg, 81%). 1H NMR (CDCl3, 500 MHz): δ 8.58 (bd, J=4.5 Hz, 1H), 7.64 (td, J=7.5, 2.0 Hz, 1H), 7.34-7.29 (m, 4H), 7.28-7.25 (m, 1H), 7.21 (d, J=8.0 Hz, 1H), 7.18-7.20 (m, 1H), 5.25 (s, 2H), 3.72 (s, 2H). 13C NMR (CDCl3, 125 MHz): δ 171.2, 155.7, 149.3, 137.0, 133.8, 129.4, 128.7, 127.2, 122.9, 121.7, 67.0, 41.3. MS (ESI): m/z = 228.1 [M+H]+. HRMS (ESI): m/z calcd for [C14H13O2N+H]+ 228.1019, found 228.1013.
1-(Pyridin-2-yl)ethyl 2-phenylacetate (6) Yellow oil (543 mg, 75%). 1H NMR (CDCl3, 500 MHz): δ 8.58 (d, J=4.0 Hz, 1H), 7.61 (t, J=7.5 Hz, 1H), 7.24-7.34 (m, 4H), 7.20-7.16 (m, 2H), 5.92 (q, J=6.5 Hz, 1H), 3.69 (d, J=2.5 Hz, 2H), 1.58 (d, J=6.5 Hz, 3H). 13C NMR (CDCl3, 125 MHz): δ 170.9, 160.3, 149.2, 137.1, 134.0, 129.4, 128.7, 127.2, 122.8, 120.4, 73.4, 41.6, 20.8. MS (ESI): m/z = 242.1 [M+H]+. HRMS (ESI): m/z calcd for [C15H15O2N+H]+ 242.1176, found 242.1169.
N-Methylation of esters 1-6
To a solution of compounds 1-6 (0.20 mmol, for 1,3,5: 45 mg, for 2,4,6: 48 mg) in dry dichloromethane (1 mL) is added methyl trifluoromethane-sulfonate (1.0 eq, 0.20 mmol, 23 µL). The mixture is allowed to stir at rt for 1 h (TLC shows no sign of starting material), under argon and protected from light. The solvent is evaporated and the product obtained is used without further purification. CAUTION: methyl
trifluoromethane-sulfonate is a powerful methylating agent, handle with extreme care in a well ventilated hood.
1-Methyl-4-((2-phenylacetoxy)methyl)pyridinium trifluoromethanesulfonate (7)
Pale yellow oil (quant.).1H NMR (CDCl3, 500 MHz): δ 8.70 (d, J=6.5 Hz, 2H), 7.74 (d, J=6.5 Hz, 2H), 7.36-7.33 (m, 2H), 7.30-7.28 (m, 3H), 5.31 (s, 2H), 4.36 (s, 3H), 3.77 (s, 2H). 13C NMR (CDCl3, 125 MHz): δ 170.9, 156.2, 145.4, 133.2, 129.5, 129.0, 127.8, 125.4, 63.3, 48.5, 41.0. MS
(ESI): m/z = 242.1 [M+H] HRMS (ESI): m/z calcd for [C15H16O2N+H] 242.1176, found 242.1170.HPLC: MeOH-MeCN-H2O 7-2-1 / H2O AcONH4 10 mM 4/6, flow rate: 0.45 mL/min, RT: 5.57 min.
1-Methyl-4-(1-(2-phenylacetoxy)ethyl)pyridinium trifluoromethanesulfonate (8)
Pale yellow oil (quant.).1H NMR (CDCl3, 500 MHz): δ 8.69 (d, J=6.5 Hz, 2H), 7.70 (d, J=6.5 Hz, 2H), 7.37-7.27 (m, 5H), 5.90 (q, J=6.5 Hz, 1H), 4.40 (s, 3H), 3.72 (s, 2H), 1.57 (d, J=6.5 Hz, 3H). 13C NMR (CDCl3, 125 MHz): δ 170.7, 161.0, 145.9, 133.3, 129.5, 128.9, 127.6, 124.7, 70.5, 48.3, 41.1, 21.4. MS (ESI): m/z = 256.3 [M+H]+. HRMS (ESI): m/z calcd for [C16H18O2N]+256.1332, found 256.1331. HPLC: MeOH-MeCN-H2O 7-2-1 / H2O AcONH4 10 mM 4/6, flow rate: 0.45 mL/min, RT: 5.05 min.
1-Methyl-3-((2-phenylacetoxy)methyl)pyridinium trifluoromethanesulfonate (9)
Pale yellow oil (quant.).1H NMR (CDCl3, 500 MHz): δ 8.73 (d, J=6.5 Hz, 1H), 8.68 (s, 1H), 8.22 (d, J=8.5 Hz, 1H), 7.88 (dd, J=8, 6 Hz, 1H), 7.33-7.26 (m, 5H), 5.27 (s, 2H), 4.35 (s, 3H), 3.72 (s, 2H). 13C NMR (CDCl3, 125 MHz): δ 171.2, 144.9, 144.5, 143.9, 138.1, 133.4, 129.6, 128.9, 128.1, 127.6, 61.9, 49.0, 40.9. MS (ESI): m/z = 242.2 [M+H]+. HRMS (ESI): m/z calcd for [C15H16O2N+H]+ 242.1176, found 242.1169.HPLC: MeOH-MeCN-H2O 7-2-1 / H2O AcONH4 10 mM 4/6, flow rate: 0.45 mL/min, RT: 4.80 min.
1-Methyl-3-(1-(2-phenylacetoxy)ethyl)pyridinium trifluoromethanesulfonate (10)
Pale yellow oil (quant.).1H NMR (CDCl3, 500 MHz): δ 8.72 (d, J=6.0 Hz, 1H), 8.60 (s, 1H), 8.17 (d, J=8.5 Hz, 1H), 7.87 (dd, J=8.0, 6.0 Hz, 1H), 7.32-7.23 (m, 5H), 5.94 (q, J=6.5 Hz, 1H), 4.32 (s, 3H), 3.69 (s, 2H), 1.58 (d, J=6.5 Hz, 3H). 13C NMR (CDCl3, 125 MHz): δ 170.7, 144.9, 143.3, 143.2, 142.3, 133.5, 129.5, 128.9, 128.3, 127.6, 69.1, 49.0, 41.2, 21.5. MS (ESI): m/z = 256.2 [M+H]+. HRMS (ESI): m/z calcd for [C16H18O2N+H]+ 256.1332, found 256.1323. HPLC: MeOH-MeCN-H2O 7-2-1 / H2O AcONH4 10 mM 4/6, flow rate: 0.45 mL/min, RT: 4.19 min.
1-Methyl-2-((2-phenylacetoxy)methyl)pyridinium trifluoromethanesulfonate (11)
Pale yellow oil (quant.).1H NMR (CDCl3, 500 MHz): δ 8.77 (d, J=6.0 Hz, 1H), 8.27 (td, J=8.0, 1.5 Hz, 1H), 7.81 (d, J=8 Hz, 2H), 7.32-7.22 (m, 5H), 5.40 (s, 2H), 4.22 (s, 3H), 3.73 (s, 2H). 13C NMR (CDCl3, 125 MHz): 170.8, 151.7, 147.5, 145.7, 133.0, 129.5, 128.9, 128.1, 127.7, 127.5, 61.2, 45.9, 40.7. MS (ESI): m/z = 242.1 [M+H]+HRMS (ESI): m/z calcd for [C15H16O2N+H]+ 242.1176, found 242.1170.HPLC: MeOH-MeCN-H2O 7-2-1 / H2O AcONH4 10 mM 4/6, flow rate: 0.45 mL/min, RT: 4.03 min.
1-Methyl-2-(1-(2-phenylacetoxy)ethyl)pyridinium trifluoromethanesulfonate (12)
Pale yellow oil (quant.).1H NMR (CDCl3, 500 MHz): δ 8.83 (d, J=5.5 Hz, 1H), 8.31 (td, J=8.0, 1 Hz, 1H), 7.87–7.84 (m, 1H), 7.72 (dd, J=8.0, 1.5 Hz, 1H), 7.33-7.26 (m, 3H), 7.22-7.20 (m, 2H), 6.00 (q, J=6.5 Hz, 1H), 4.29 (s, 3H), 3.67 (s, 2H), 1.63 (d, J=7.0 Hz, 3H). 13C NMR (CDCl3, 125 MHz): δ 171.1, 157.3, 147.5, 146.2, 132.7, 129.4, 129.0, 127.8, 127.4, 125.4, 67.3, 46.4, 40.9, 19.7. MS (ESI): m/z = 256.3 [M+H]+. HPLC: MeOH-MeCN-H2O 7-2-1 / H2O AcONH4 10 mM 4/6, flow rate: 0.45 mL/min, RT: 4.55 min.
Accepted
FULL PAPER
N-Alkylation of carbazoleTo a solution of carbazole (10.0mmol, 1.67 g) in DMF (25 mL), NaH (60% dispersion in mineral oil, 1.5 eq, 15.0mmol, 600 mg) was added at 0°C. After 30 min stirring, 1.5 eq of alkyl bromide was added (15.00 mmol, 3-bromopropanol: 1.34 mL; 6-bromohexanol: 2.72 g; 12-bromododecanol: 3.98 g) and the mixture was stirred at rt for 24 h. The mixture was poured onto water and extracted by DCM. The organic phase was washed with water and brine, dried over Na2SO4, filtered and evaporated to dryness. The crude product was purified by column cromatography on silica gel (cyclohexane/EtOAc 4/1).
3-(9H-Carbazol-9-yl)propanol White solid (1.36 g, 60%). 1H NMR (CDCl3, 250 MHz): δ 8.16 (d, J=7.3 Hz, 2H), 7.56-7.46 (m, 4H), 7.30 (ddd, J=7.3, 5.3, 2.2 Hz, 2H), 4.46 (t, J=6.6 Hz, 2H), 3.57 (t, J=6.6 Hz, 2H), 2.10 (qn, J=6.6 Hz, 2H), 1.80 (s, 1H). 13C NMR (CDCl3, 125 MHz): δ 140.5, 125.8, 122.9, 120.4, 119.0, 108.7, 59.6, 39.2, 31.4. 6-(9H-Carbazol-9-yl)hexanol White solid (1.70 g, 64%). 1H NMR (CDCl3, 500 MHz): δ 8.08 (d, J=7.5 Hz, 2H), 7.44 (td, J=8.0, 1.5 Hz, 2H), 7.37 (d, J=8.0 Hz, 2H), 7.21 (td, J=8.0, 1.0 Hz, 2H), 4.27 (t, J=7.0 Hz, 2H), 3.55 (t, J=6.5 Hz, 2H), 1.86 (qn, J=7.5 Hz, 2H), 1.49 (qn, J=7.0 Hz, 2H), 1.39-1.33 (m, 4H). 13C NMR (CDCl3, 125 MHz): δ 140.5, 125.7, 122.9, 120.5, 118.9, 108.7, 62.8, 43.1, 32.7, 29.0, 27.2, 25.6. 12-(9H-Carbazol-9-yl)dodecanol White solid (2.53 g, 72 %). 1H NMR (CDCl3, 500 MHz): δ 8.07 (d, J=8.0 Hz, 2H), 7.42 (td, J=8.0, 1.0 Hz, 2H), 7.35 (d, J=8.0 Hz, 2H), 7.19 (td, J=8.0, 1.0 Hz, 2H), 4.22 (t, J=7.5 Hz, 2H), 3.56 (t, J=6.5 Hz, 2H), 1.81 (qn, J=7.0 Hz, 2H), 1.50 (qn, J=7.0 Hz, 2H), 1.36-1.18 (m, 16H). 13C NMR (CDCl3, 125 MHz): δ 140.5, 125.6, 122.9, 120.4, 118.7, 108.7, 63.0, 43.1, 32.8, 29.7-29.5 (6C), 29.0, 27.4, 25.8.
Synthesis of compounds 13a-c
To a solution of the appropriate alcohol (1.80 mmol, 3-(9H-carbazol-9-yl)propanol: 406 mg, 6-(9H-carbazol-9-yl)hexanol: 481 mg, 12-(9H-carbazol-9-yl)dodecanol: 633 mg) and pyridine (1.0 eq, 1.80 mmol, 146 µL) in DCM (10 mL), trifluoromethanesulfonic anhydride (1.0 eq, 1.80 mmol, 303 µL) was added at 0°C. The mixture was stirred at rt for 2 h, then was poured onto water. The organic phase was washed with water and brine, dried over Na2SO4, filtered and evaporated to dryness. The crude product obtained was used directly for the next reaction step.
3-(9H-Carbazol-9-yl)propyl trifluoromethanesulfonate (13a)
Colourless oil (643 mg, quant).1H NMR (CDCl3, 250 MHz): δ 8.15 (d, J=8.4 Hz, 2H), 7.53 (ddd, J=8.4, 7.5, 1.3 Hz, 2H), 7.39 (d, J=8.4 Hz, 2H), 7.31 (ddd, J=7.5, 7.5, 0.8 Hz, 2H), 4.46 (d, J=6.2 Hz, 2H), 4.44 (d, J=6.5 Hz, 2H), 2.36 (qn, J=6.4 Hz, 2H).
6-(9H-Carbazol-9-yl)hexyl trifluoromethanesulfonate (13b)
Colourless oil (719 mg, quant).1H NMR (CDCl3, 250 MHz): δ 8.13 (d, J=7.9 Hz, 2H), 7.50 (ddd, J=7.5, 7.2, 1.0 Hz, 2H), 7.41 (d, J=7.9 Hz, 2H), 7.27 (ddd, J=7.9, 7.5, 1.0 Hz, 2H), 4.47 (t, J=6.2 Hz, 2H), 4.32 (t, J=7.0 Hz, 2H), 1.96-1.83 (m, 2H), 1.80-1.69 (m, 2H), 1.49-1.30(m, 4H).
12-(9H-Carbazol-9-yl)dodecyl trifluoromethanesulfonate (13c)
Colourless oil (870 mg, quant).1H NMR (CDCl3, 500 MHz): δ 8.11 (d, J=7.5 Hz, 2H), 7.47 (ddd, J=9.5, 7.0, 1.5 Hz, 2H), 7.41 (d, J=8 Hz, 2H), 7.25 (ddd, 7.5, 7.0, 1.2 Hz, 2H), 4.53 (t, J=6.5 Hz, 2H), 4.31 (t, J=7 Hz, 2H), 1.91-1.79 (m, 4H), 1.44-1.25 (m, 16H).
Synthesis of carbazole-linked esters 14-19
To a solution of the ester (1-6) (0.25 mmol) in 1.0 mL DCM, a solution of the triflate (13a-c) (1.0 eq, 0.25 mmol) in DCM (0.5 mL) was added, and the mixture was stirred at rt for 4 h under argon, while protected from light. After evaporation to dryness, if necessary, the crude product was purified by column cromatography on silica gel (DCM/MeOH 95/5). During work-up, purification and upon storing the products were carefully protected from light.
1-(3-(9H-Carbazol-9-yl)propyl)-4-((2-phenylacetoxy)methyl)pyridinium trifluoromethanesulfonate (14a)
Yellow oil (121 mg, 83%). 1H NMR (CD3CN, 500 MHz): δ 8.25 (d, J=7.0 Hz, 2H), 8.01 (d, J=7.5 Hz, 2H), 7.52 (d, J=8.0 Hz, 2H), 7.48 (ddd, J=8.0, 7.0, 1.2 Hz, 2H), 7.43 (d, J=6.5 Hz, 2H), 7.39-7.35 (m, 2H), 7.34-7.30 (m, 3H), 7.21 (ddd, J=8.0, 7.0, 1.2 Hz, 2H), 5.18 (s, 2H), 4.52 (t, J=7.0 Hz, 2H), 4.51 (t, J=7.0 Hz, 2H), 3.80 (s, 2H), 2.56 (qn, J=7.0 Hz, 2H). 13C NMR (CD3CN, 125 MHz): δ 171.7, 157.1, 144.2, 140.8, 134.9, 130.4, 129.5, 128.2, 127.0, 125.4, 123.6, 121.2, 120.3, 110.0, 63.9, 60.1, 41.1, 40.7, 30.0. MS (ESI): m/z = 435.2 [M+H]+. HRMS (ESI): m/z calcd for [C29H27O2N2+H]+ 435.2067, found 435.2078. HPLC: MeOH-MeCN-H2O 7-2-1 / H2O AcONH4 10 mM 7/3, flow rate: 0.7 mL/min, RT: 3.34 min.
1-(6-(9H-Carbazol-9-yl)hexyl)-4-((2-phenylacetoxy)methyl)pyridinium trifluoromethanesulfonate (14b) Yellow oil (136 mg, 87%). 1H NMR (CDCl3, 500 MHz): δ 8.50 (d, J=6.5 Hz, 2H), 7.99 (d, J=8 Hz, 2H), 7.53 (d, J=7 Hz, 2H), 7.39 (ddd, J=8.0, 7.0, 1.0 Hz, 2H), 7.32-7.22 (m, 7H), 7.15 (ddd, J=8.0, 7.0, 1.0 Hz, 2H), 5.07 (s, 2H), 4.27 (t, J=7.5 Hz, 2H), 4.19 (d, J=7.0 Hz, 2H), 3.69 (s, 2H), 1.75-1.66 (m, 4H), 1.28-1.24 (m, 2H), 1.20-1.16 (m, 2H). 13C NMR (CDCl3, 125 MHz): δ 170.7, 156.0, 144.2, 140.3, 133.1, 129.4, 128.9, 127.7, 125.9, 125.3, 122.7, 120.4, 119.0, 108.9, 63.1, 61.5, 42.7, 40.9, 31.2, 28.5, 26.4, 25.4. MS (ESI): m/z = 477.3 [M+H]+. HRMS (ESI): m/z calcd for [C32H33O2N2+H]+ 477.2537, found 477.2529. HPLC: MeOH-MeCN-H2O 7-2-1 / MeOH-MeCN-H2O AcONH4 10 mM 7/3, flow rate: 0.7 mL/min, RT: 5.66 min.
1-(12-(9H-Carbazol-9-yl)dodecyl)-4-((2-phenylacetoxy)methyl)pyridinium trifluoromethanesulfonate (14c) Yellow oil (142 mg, 80%). 1H NMR (CDCl3, 500 MHz): δ 8.69 (d, J=6.5 Hz, 2H), 8.06 (d, J=8.0 Hz, 2H), 7.72 (d, J=7.0 Hz, 2H), 7.43 (ddd, J=8.0, 7.0, 1.5 Hz, 2H), 7.38 (d, J=8.0 Hz, 2H), 7.34-7.30 (m, 2H), 7.29-7.25 (m, 3H), 7.19 (ddd, J=8.0, 7.0, 1.0 Hz, 2H), 5.22 (s, 2H), 4.46 (t, J=7.5 Hz, 2H), 4.25 (t, J=7.5 Hz, 2H), 3.74 (s, 2H), 1.88-1.78 (m, 4H), 1.38-1.30 (m, 2H), 1.30-1.15 (m, 14H). 13C NMR (CDCl3, 125 MHz): δ 170.8, 156.3, 144.4, 140.5, 133.1, 129.5, 128.9, 127.7, 125.7, 125.6, 122.8, 120.4, 118.8, 108.8, 63.2, 62.0, 43.1, 40.9, 31.5, 29.4-28.9 (8C), 27.3, 26.0. MS (ESI): m/z = 561.4 [M+H]+. HRMS (ESI): m/z calcd for [C38H45O2N2+H]+ 561.3476, found 561.3466. HPLC: MeOH-MeCN-H2O 7-2-1 / H2O AcONH4 10 mM 9/1, flow rate: 0.7 mL/min, RT: 5.71 min.
Accepted
1-(3-(9H-Carbazol-9-yl)propyl)-4-(1-(2-phenylacetoxy)ethyl)pyridinium trifluoromethanesulfonate(15a) Yellow oil (137 mg, 92%). 1H NMR (CDCl3, 500 MHz): δ 8.18 (d, J=7 Hz, 2H), 7.82 (d, J=8 Hz, 2H), 7.43-7.39 (m, 4H), 7.32-7.25 (m, 2H), 7.21-7.19 (m, 2H), 7.12 (ddd, J=8.0, 6.5, 2 Hz, 2H), 7.01 (d, J=6.5 Hz, 2H), 5.60 (q, J=7 Hz, 1H), 4.58 (t, J=7.0 Hz, 2H), 4.46 (t, J=6.5 Hz, 2H), 3.62 (s, 2H), 2.58 (qn, J=6.5 Hz, 2H), 1.31 (d, J=7.0 Hz, 3H). 13C NMR (CDCl3, 125 MHz): δ 170.3, 160.3, 143.2, 139.6, 133.1, 129.4, 128.9, 127.7, 126.5, 123.6, 122.7, 120.3, 119.7, 109.1, 69.8, 59.6, 41.1, 40.2, 29.0, 21.3. MS (ESI): m/z = 449.2 [M+H]+. HRMS (ESI): m/z calcd for [C30H29O2N2+H]+ 449.2224, found 449.2211. HPLC: MeOH-MeCN-H2O 7-2-1 / H2O AcONH4 10 mM 7/3, flow rate: 0.7 mL/min, RT: 3.78 min.
1-(6-(9H-Carbazol-9-yl)hexyl)-4-((2-phenylacetoxy)ethyl)pyridinium trifluoromethanesulfonate (15b) Yellow oil (123 mg, 77 %). 1H NMR (CDCl3, 500 MHz): δ 8.56 (d, J=6.5 Hz, 2H), 8.05 (d, J=8 Hz, 2H), 7.59 (d, J=6 Hz, 2H), 7.45-7.28 (m, 8 H), 7.24-7.18 (m, 3H), 5.82 (q, J=7 Hz, 1H), 4.37 (t, J=7.5 Hz, 2H), 4.27 (t, J=6.5 Hz, 2H), 3.69 (s, 2H), 1.77 (m, 4H), 1.48 (d, J=7 Hz, 3H), 1.35-1.20 (m, 4H). 13C NMR (CDCl3, 125 MHz): 170.4, 161.0, 144.5, 140.4, 133.0, 129.3, 128.9, 127.7, 125.8, 124.8, 122.8, 120.3, 118.9, 108.9, 61.5, 42.7, 41.1, 31.1, 28.5, 26.4, 25.5, 21.3. MS (ESI): m/z = 491.3 [M+H]+. HRMS (ESI): m/z calcd for [C33H35O2N2+H]+ 491.2693, found 491.2674. HPLC: MeOH-MeCN-H2O 7-2-1 / H2O AcONH4 10 mM 7/3, flow rate: 0.7 mL/min, RT: 6.62 min. 1-(12-(9H-Carbazol-9-yl)dodecyl)-4-((2-phenylacetoxy)ethyl)-pyridinium trifluoromethanesulfonate (15c) Yellow oil (121 mg, 67%). 1H NMR (CDCl3, 500 MHz): δ 8.72 (d, J=7 Hz, 2H), 8.08 (d, J=8.0 Hz, 2H), 7.71 (d, J=6.5 Hz, 2H), 7.47-7.25 (m, 9H), 7.21 (td, J=8.0, 1.0 Hz, 2H), 5.88 (q, J=6.5 Hz, 1H), 4.54 (t, J=7.5, 2H), 4.28 (t, J=7.5 Hz, 2H), 3.71 (s, 2H), 1.90-1.82 (m, 4H), 1.53 (d, J=7, 3H), 1.38-1.20(m, 16H). 13C NMR (CDCl3, 125 MHz): δ 170.6, 161.2, 144.8, 140.6, 133.2, 129.4, 129.0, 127.8, 125.7, 125.0, 122.9, 120.4, 118.8, 108.8, 70.4, 62.1, 43.2, 41.3, 31.6, 29.5-29.0 (7C), 27.4, 26.1, 21.5. MS (ESI): m/z = 575.4 [M+H]+. HRMS (ESI): m/z calcd for [C39H47O2N2+H]+ 575.3632, found 575.3610. HPLC: MeOH-MeCN-H2O 7-2-1 / H2O AcONH4 10 mM 9/1, flow rate: 0.7 mL/min, RT: 6.07 min.
1-(3-(9H-Carbazol-9-yl)propyl)-3-((2-phenylacetoxy)methyl)-pyridinium trifluoromethanesulfonate(16a) Yellow oil (121 mg, 83%). 1H NMR (CDCl3, 500 MHz): δ 8.17 (d, J=6.0 Hz, 1H), 8.07 (s, 1H), 7.80 (d, J=8.0 Hz, 2H), 7.61 (d, J=8.0 Hz, 1H), 7.41-7.35 (m, 4H), 7.25-7.20 (m, 2H), 7.20-7.15 (m, 3H), 7.13-7.09 (m, 3H), 4.68 (s, 2H), 4.56 (t, J=6.5 Hz, 2H), 4.42 (t, J=6.5 Hz, 2H), 3.60 (s, 2H), 2.56 (qn, J=6.0 Hz, 2H). 13C NMR (CDCl3, 125 MHz): δ 170.8, 142.33, 142.31, 141.3, 139.5, 137.1, 133.4, 129.5, 128.8, 127.5, 126.8, 126.4, 122.6, 120.2, 119.7, 109.1, 61.4, 60.1, 40.7, 40.1, 28.8. MS (ESI): m/z = 435.2449.2 [M+H]+. HRMS (ESI): m/z calcd for [C29H27O2N2+H]+435.2067, found 435.2048. HPLC: MeOH-MeCN-H2O 7-2-1 / H2O AcONH4 10 mM 7/3, flow rate: 0.7 mL/min, RT: 3.00 min.
1-(6-(9H-Carbazol-9-yl)hexyl)-3-((2-phenylacetoxy)methyl)pyridinium trifluoromethanesulfonate (16b) Yellow oil (118 mg, 75%). 1H NMR (CDCl3, 500 MHz): δ 8.54 (s, 1H), 8.52 (d, J=6.5 Hz, 1H), 8.01 (d, J=7.5 Hz, 2H), 7.98 (d, J=8.5 Hz, 1H), 7.65 (dd, J=8.0, 6.0 Hz, 1H), 7.39 (ddd, J=8.0, 7.0, 1.0 Hz, 2H), 7.33 (d, J=8.5 Hz, 2H), 7.24-7.15 (m, 7H), 5.1 (s, 2H), 4.32 (t, J=7.5 Hz, 2H), 4.20 (t, J=7 Hz, 2H), 3.64 (s, 2H), 1.77-1.68 (m, 4H), 1.28-1.18 (m, 4H). C NMR (CDCl3, 125 MHz): δ 171.0, 143.8, 143.7, 143.0, 140.4, 138.1, 133.4, 129.5, 128.8, 128.1, 127.5, 125.9, 122.7, 120.4, 119.0, 108.9, 62.1, 61.8, 42.7, 40.9, 31.2, 28.6, 26.5, 25.6. MS (ESI): m/z = 477.2 [M+H]+. HRMS (ESI): m/z calcd for [C32H33O2N2+H]+ 477.2537, found 477.2521. HPLC: MeOH-MeCN-H2O 7-2-1 / H2O AcONH4 10 mM 7/3, flow rate: 0.7 mL/min, RT: 5.50 min.
1-(12-(9H-Carbazol-9-yl)dodecyl)-3-((2-phenylacetoxy)methyl)pyridinium trifluoromethanesulfonate (16c) Yellow oil (126 mg, 71%). 1H NMR (CDCl3, 500 MHz): δ 8.70 (s, J=6.0 Hz, 1H), 8.69 (d, 1H), 8.16 (dm, J=7.5 Hz, 1H), 8.05 (d, J=8.0 Hz, 2H), 7.84 (dd, J=8.0, 6.0 Hz, 1H), 7.43 (td, J=8.0, 1.0 Hz, 2H), 7.37 (d, J=8.0 Hz, 2H), 7.30-7.22 (m, 5H), 7.19 (td, J=8.0, 1.0 Hz, 2H), 5.22 (s, 2H), 4.46 (t, J=8.0 Hz, 2H), 4.24 (t, J=7.5 Hz, 2H), 3.69 (s, 2H), 1.86-1.78 (m, 4H), 1.38-1.30 (m, 2H), 1.30-1.16 (m, 14H). 13C NMR (CDCl3, 125 MHz): δ 171.0, 144.0, 143.8, 143.2, 140.4, 138.2, 133.4, 129.4, 128.8, 128.3, 127.4, 125.7, 122.8 120.3, 118.8, 108.8, 62.5, 61.9, 43.1, 40.9, 31.6,29.6-28.8 (7C), 27.3, 26.0. MS (ESI): m/z = 575.3 [M+H]+. HRMS (ESI): m/z calcd for [C38H45O2N2+H]+ 561.3476, found 561.3481. HPLC: MeOH-MeCN-H2O 7-2-1 / H2O AcONH4 10 mM 9/1, flow rate: 0.7 mL/min, RT: 6.85 min. 1-(3-(9H-Carbazol-9-yl)propyl)-3-(1-(2-phenylacetoxy)ethyl)pyridinium trifluoromethanesulfonate(17a) Yellow oil (107 mg, 71 %). 1H NMR (CDCl3, 500 MHz): δ 8.30 (d, J=6.0 Hz, 1H), 8.22 (s, 1H), 7.86 (d, J=7.5 Hz, 2H), 7.71 (d, J=8.5 Hz, 1H), 7.42-7.37 (m, 4H), 7.27-7.19 (m, 3H), 7.18-7.12 (m, 5H), 5.54 (q, J=6.5 Hz, 1H), 4.62 (td, J=7.0, 2.5 Hz, 2H), 4.45 (td, J=6.5, 2.5 Hz, 2H), 3.60 (bs, 2H), 2.56 (qn, J=7.0 Hz, 2H), 1.31 (d, J=6.5 Hz, 3H). 13C NMR (CDCl3, 125 MHz): δ 170.3, 142.9, 142.6, 141.5, 140.9, 139.7, 133.4, 129.4, 128.8, 127.5, 127.4, 126.4, 122.7, 120.3, 119.7, 109.1, 68.6, 60.3, 41.2, 40.1, 29.5, 21.0. MS (ESI): m/z = 449.2 [M+H]+. HRMS (ESI): m/z calcd for [C30H29O2N2+H]+ 449.2224, found 449.2210. HPLC: MeOH-MeCN-H2O 7-2-1 / H2O AcONH4 10 mM 7/3, flow rate: 0.7 mL/min, RT: 3.36 min. 1-(6-(9H-Carbazol-9-yl)hexyl)-3-((2-phenylacetoxy)ethyl)pyridinium trifluoromethanesulfonate (17b) Yellow oil (122 mg, 76%). 1H NMR (CDCl3, 500 MHz): δ 8.60 (d, J=6.0 Hz, 1H), 8.51 (s, 1H), 8.04 (d, J=7.5 Hz, 2H), 8.01 (d, J=8.0 Hz, 1H), 7.72 (dd, J=8.5, 6.0 Hz, 1H), 7.42 (m, 2H), 7.36 (d, J=8.0 Hz, 2H), 7.26-7.15 (m, 7H), 5.84 (q, J=6.5 Hz, 1H), 4.38 (t, J=7.5 Hz, 2H), 4.24 (t, J=7 Hz, 2H), 3.63 (s, 2H), 1.81-1.67 (m, 4H), 1.52 (d, J=6.5 Hz, 3H), 1.31-1.20 (m, 4H). 13C NMR (CDCl3, 125 MHz): δ 170.5, 143.9, 143.4, 142.3, 142.1, 140.5, 133.4, 129.4, 128.8, 128.4, 127.5, 125.9, 122.8, 120.4, 119.0, 109.0, 69.0, 62.3, 42.8, 41.3, 31.4, 28.6, 26.5, 25.6, 21.4. MS (ESI): m/z = 491.2 [M+H]+. HRMS (ESI): m/z calcd for [C33H35O2N2+H]+ 491.2693, found 491.2672. HPLC: MeOH-MeCN-H2O 7-2-1 / H2O AcONH4 10 mM 7/3, flow rate: 0.7 mL/min, RT: 7.29 min.
1-(12-(9H-Carbazol-9-yl)dodecyl)-3-((2-phenylacetoxy)ethyl)pyridinium trifluoromethanesulfonate (17c) Yellow oil (125 mg, 69%). 1H NMR (CDCl3, 250 MHz): δ 8.81 (d, J=6.0 Hz, 1H), 8.19 (t, J=7.8 Hz, 1H), 8.01 (d, J=7.5 Hz, 2H), 7.81 (ddd, J=7.5, 6.2, 1.5 Hz, 1H), 7.57 (dd, J=8.0, 1.5 Hz, 1H), 7.42-7.30 (m, 4H), 7.25-7.10 (m, 7H), 5.89 (bq, J=6.8 Hz, 1H), 4.70-4.55 (m, 1H), 4.45-4.32 (m, 1H), 4.21 (t, J=7.3 Hz, 2H), 3.61 (s, 2H), 2.04-1.70 (m, 4H), 1.61 (d, J=6.5 Hz, 3H), 1.36-1.10 (m, 16H). 13C NMR (CDCl3, 63 MHz): δ 170.8,
Accepted
Manuscript
FULL PAPER
156.7, 146.6, 146.3, 140.5, 132.5, 129.4, 129.0, 127.8, 127.7, 125.7, 125.3, 122.8, 120.4, 118.8, 108.8, 67.0, 59.0, 43.2, 41.0, 30.9, 29.5* (2C), 29.3* (2C), 29.0, 27.4, 26.4, 20.7. MS (ESI): m/z = 575.3 [M+H]+ for [C39H47N2O2]+. HPLC: MeOH-MeCN-H2O 7-2-1 / H2O AcONH4 10 mM 9/1, flow rate: 0.7 mL/min, RT: 7.68 min.
1-(3-(9H-Carbazol-9-yl)propyl)-2-((2-phenylacetoxy)methyl)pyridinium trifluoromethanesulfonate (18a)
Yellow oil (124 mg, 85 %). 1H NMR (CDCl3, 500 MHz): δ 8.74 (dd, J=6.0, 1.0 Hz, 1H), 7.96 (td, J=7.5, 1.0 Hz, 1H), 7.95 (d, J=8.0 Hz, 2H), 7.55 (ddd, J=8.0, 6.2, 1.4 Hz, 1H), 7.44 (d, J=8.0 Hz, 2H), 7.42 (dd, J=8.0, 1.3 Hz, 1H), 7.39 (ddd, J=8.0, 7.0, 1.0 Hz, 2H), 7.21-7.17 (m, 3H), 7.15 (ddd, J=8.0, 7.0, 0.7 Hz, 2H), 7.02-6.99 (m, 2H), 4.81 (s, 2H), 4.50-4.40 (m, 4H), 3.36 (s, 2H), 2.43-2.36 (m, 2H). 13C NMR (CDCl3, 125 MHz): δ 170.3, 150.5, 146.1, 145.4, 140.0, 132.7, 129.3, 128.8, 128.4, 127.7, 127.6, 126.4, 122.9, 120.4, 119.7, 109.1, 60.2, 55.6, 40.3, 39.4, 29.9. MS (ESI): m/z = 435.2 [M+H]+. HRMS (ESI): m/z calcd for [C29H27O2N2+H]+ 435.2067, found 435.2048. HPLC: MeOH-MeCN-H2O 7-2-1 / H2O AcONH4 10 mM 7/3, flow rate: 0.7 mL/min, RT: 3.31 min.
1-(6-(9H-Carbazol-9-yl)hexyl)-2-((2-phenylacetoxy)methyl)pyridinium trifluoromethanesulfonate (18b) Yellow oil (109 mg, 70 %). 1H NMR (CDCl3, 500 MHz): δ 8.74 (dd, J=6.0, 1.0 Hz, 1H), 8.11 (td, J=8.0, 1.5 Hz, 1H), 8.03 (d, J=7.5 Hz, 2H), 7.74 (ddd, J=8.0, 6.0, 1.5 Hz, 1H), 7.60 (dd, J=7.5, 1.5 Hz, 1H), 7.41 (ddd, J=8.0, 7.0, 1.5 Hz, 2H), 7.36 (d, J=8 Hz, 2H), 7.28-7.23 (m, 3H), 7.19-7.16 (m, 4H), 5.26 (s, 2H), 4.34 (t, J=8.0 Hz, 2H), 4.25 (t, J=7 Hz, 2H), 3.64 (s, 2H), 1.80 (qn, J=7.5 Hz, 2H), 1.65 (qn, J=8.0 Hz, 2H), 1.32-1.25 (m, 4H). 13C NMR (CDCl3, 125 MHz): δ 170.5, 151.0, 146.5, 145.5, 140.4, 132.7, 129.4, 129.0, 128.1, 127.8, 127.7, 125.9, 122.7, 120.4, 119.0, 108.9, 60.5, 58.3, 42.8, 40.8, 30.6, 28.6, 26.6, 25.9. MS (ESI): m/z = 477.3 [M+H]+. HRMS (ESI): m/z calcd for [C32H33O2N2+H]+ 477.2537, found 477.2528. HPLC: MeOH-MeCN-H2O 7-2-1 / H2O AcONH4 10 mM 7/3, flow rate: 0.7 mL/min, RT: 5.95 min.
1-(12-(9H-Carbazol-9-yl)dodecyl)-2-((2-phenylacetoxy)methyl)pyridinium trifluoromethanesulfonate (18c) Yellow oil (132 mg, 74%). 1H NMR (CDCl3, 500 MHz): δ 8.83 (dd, J=6.0, 1.0 Hz, 1H), 8.24 (td, J=8.0, 1.5 Hz, 1H), 8.07 (d, J=7.5 Hz, 2H), 7.87 (td, J=6.0, 1.5 Hz, 1H), 7.76 (dd, J=8.0, 1.0 Hz, 1H), 7.44 (td, J=7.0, 1.0 Hz, 2H), 7.38 (d, J=8.0 Hz, 2H), 7.33-7.23 (m, 5H), 7.20 (td, J=8.0, 1.0 Hz, 2H), 5.42 (s, 2H), 4.46 (tm, J=8.0 Hz, 2H), 4.26 (t, J=7.0 Hz, 2H), 3.72 (s, 2H), 1.84 (qn, J=9.5 Hz, 4H), 1.40-1.20 (m, 16H).13C NMR (CDCl3, 125 MHz): δ 170.6, 151.1, 146.6, 145.7, 140.5, 132.7, 129.4, 129.0, 128.3, 127.9, 127.8, 125.7, 122.9, 120.4, 118.8, 108.8, 60.7, 58.6, 43.2, 40.8, 31.0, 29-5-28.9 (7C), 27.4, 26.4. MS (ESI): m/z = 561.3 [M+H]+. HRMS (ESI): m/z calcd for [C38H45O2N2+H]+ 561.3476, found 561.3454. HPLC: MeOH-MeCN-H2O 7-2-1 / H2O AcONH4 10 mM 9/1, flow rate: 0.7 mL/min, RT: 6.12 min.
1-(3-(9H-Carbazol-9-yl)propyl)-2-(1-(2-phenylacetoxy)ethyl)pyridinium trifluoromethanesulfonate (19a)
Yellow oil (149 mg, quant).1H NMR (CDCl3, 500 MHz): δ 8.87 (dd, J=7.5, 6 Hz, 1H), 8.03 (td, J=8.0, 1.5 Hz, 1H), 7.99 (d, J=7.5 Hz, 2H), 7.60 (m, 1H), 7.46 (d, J=8 Hz, 2H), 7.38-7.23 (m, 6H), 7.18-7.15 (m, 2H), 7.10-7.08 (m, 2H), 4.79-4.72 (m, 2H), 4.61-4.48 (m, 2H), 4.15-4.09 (m, 1H) 3.45 (s, 2H), 2.77-2.76 (m, 1H), 2.47-2.45 (m, 1H), 0.92 (d, J=7.0 Hz, 3H). 13C NMR (CDCl3, 125 MHz): δ 170.4, 157.2, 146.2, 140.1, 132.5, 129.4, 128.9, 128.6, 127.7, 127.4, 126.4, 124.6, 122.9, 120.4, 119.7, 109.4, 66.8, 55.7, 40.5, 39.3, 29.9, 19.5. MS (ESI): m/z = 449.2 [M+H]+. HRMS (ESI): m/z calcd for [C30H29O2N2+H]+ 449.2224, found 449.2210. HPLC: MeOH-MeCN-H2O 7-2-1 / H2O AcONH4 10 mM 7/3, flow rate: 0.7 mL/min, RT: 3.95 min. 1-(6-(9H-Carbazol-9-yl)hexyl)-2-(1-(2-phenylacetoxy)ethyl)pyridinium trifluoromethanesulfonate (19b) Yellow oil (103 mg, 64%). 1H NMR (CDCl3, 250 MHz): δ 8.74 (d, J=5.3 Hz, 1H), 8.14 (td, J=8.3, 1.3 Hz, 1H), 8.03 (d, J=7.5 Hz, 2H), 7.71 (ddd, J=7.3, 6.3, 1.3 Hz, 1H), 7.55 (dd, J=7.0, 1.3 Hz, 1H), 7.45-7.33 (m, 4H), 7.30-7.23 (m, 3H), 7.21-7.14 (m, 4H), 5.81 (q, J=6.8 Hz, 1H), 4.60-4.48 (m, 1H), 4.40-4.28 (m, 1H), 4.24 (t, J=7.0 Hz, 2H), 3.62 (s, 2H), 1.96-1.72 (m, 4H), 1.53 (d, J=6.5 Hz, 3H), 1.40-1.30 (m, 4H). 13C NMR (CDCl3, 63 MHz): δ 170.8, 156.8, 146.2, 140.4, 132.6, 129.4, 128.9, 127.8, 127.5, 125.8, 125.2, 122.8, 120.3, 118.9, 108.9, 66.9, 58.5, 42.7, 40.9, 30.5, 28.6, 26.5, 25.8, 20.5. MS (ESI): m/z = 491.2 [M+H]+. HRMS (ESI): m/z calcd for [C33H35O2N2+H]+ 491.2693, found 491.2683. HPLC: MeOH-MeCN-H2O 7-2-1 / H2O AcONH4 10 mM 7/3, flow rate: 0.7 mL/min, RT: 7.03 min.
1-(12-(9H-Carbazol-9-yl)dodecyl)-2-((2-phenylacetoxy)ethyl)pyridinium trifluoromethanesulfonate (19c)
Yellow oil (181 mg, quant.).1H NMR (CDCl3, 500 MHz): δ 8.94 (dd, J=6.0, 1.0 Hz, 1H), 8.24 (td, J=8.0, 1.0 Hz, 1H), 8.09 (d, J=7.5 Hz, 2H), 7.92 (ddd, J=6.0, 3.5, 1.5 Hz, 1H), 7.60 (dd, J=8.0, 1.5 Hz, 1H), 7.48-7.44 (m, 2H), 7.40 (d, J=8.5 Hz, 2H), 7.36-7.29 (m, 3H), 7.24-7.20 (m, 4H), 5.99 (q, J=6.5 Hz, 1H), 4.78-4.72 (m, 1H), 4.52-4.46 (m, 1H), 4.29 (t, J=7.5 Hz, 2H), 3.69 (s, 2H), 2.14-2.05 (m, 1H), 1.98-1.91 (m, 1H), 1.86 (qn, J=7.5 Hz, 2H), 1.71 (d, J=6.5 Hz, 3H), 1.44-1.22 (m, 16H). 13C NMR (CDCl3, 125 MHz): δ 170.8, 156.8, 146.9, 146.1, 140.6, 132.5, 129.4, 129.1, 128.0, 127.7, 125.7, 125.1, 122.9, 120.4, 118.8, 108.8, 67.0, 59.2, 43.2, 41.1, 30.9, 29.5-29.1 (7C), 27.4, 26.4, 20.7. MS (ESI): m/z = 575.3 [M+H]+. HRMS (ESI): m/z calcd for [C39H47O2N2+H]+ 575.3632, found 575.3608. HPLC: MeOH-MeCN-H2O 7-2-1 / H2O AcONH4 10 mM 9/1, flow rate: 0.7 mL/min, RT: 6.55 min.
Theoretical calculations
The calculations have been performed with Gaussian 0916a using Density Functional Theory (DFT) and the 6-311G(d,p) Pople basis sets and the PBE0 functional. The first low-lying electronic singlet excited states have been calculated using the time-dependent density functional theory (TD-DFT) method16b to obtain theoretical absorption spectra. The calculations (geometry optimizations, TD-DFT calculations) have been performed in acetonitrile as in the experiment and solvent have been included in the calculations by means of the polarizable continuum model by the integral equation formalism (IEFPCM).16c All the geometry optimizations were led without symmetry constraints and followed by a vibrational frequency computation to ensure that they correspond to true energetic minima.
Acknowledgements
This research was supported by grants from Région Ile-de-France – DIM Nano-K 2014 (Ile-de-France) Fellowship and a Marie Curie Intra European Fellowship within the 7th European Community Framework Program (FP7-PEOPLE-2013-IEF: 629675). Authors acknowledge also the generous financial support of the ANR-2014-BLAN-1436-01 grant.