HAL Id: insu-02403296
https://hal-insu.archives-ouvertes.fr/insu-02403296
Submitted on 10 Dec 2019HAL is a multi-disciplinary open access archive for the deposit and dissemination of sci-entific research documents, whether they are pub-lished or not. The documents may come from teaching and research institutions in France or abroad, or from public or private research centers.
L’archive ouverte pluridisciplinaire HAL, est destinée au dépôt et à la diffusion de documents scientifiques de niveau recherche, publiés ou non, émanant des établissements d’enseignement et de recherche français ou étrangers, des laboratoires publics ou privés.
Solar oblateness and its variations in phase with the 22
yr magnetic cycle
Abdanour Irbah, Luc Damé, Redouane Mecheri, Djelloul Djafer
To cite this version:
Abdanour Irbah, Luc Damé, Redouane Mecheri, Djelloul Djafer. Solar oblateness and its variations in phase with the 22 yr magnetic cycle. 2019, 4 p. �insu-02403296�
Solar oblateness and its variations in phase with the 22 yr magnetic cycle Abdanour Irbah1, Luc Damé1, Redouane Mecheri2 and Djelloul Djafer3
(1) LATMOS/IPSL, UVSQ, Université Paris-Saclay, Sorbonne Université, CNRS, 11 BD D'Alembert Guyancourt 78280 France
(2) Centre de Recherche Astronomie Astrophysique et Géophysique, CRAAG 16340, Bouzaréah, Algeria (3) Unité de Recherche Appliquée en Energies Renouvelables, URAER, Centre de Développement des Energies Renouvelables, CDER, 47133, Ghardaïa, Algeria
The internal dynamics of the Sun is manifested by disturbances on the photosphere surface, inducing directly small deviations from its sphericity. The solar shape then reflects the internal state of the Sun and processes taking place herein. Its temporal variations are useful for modelling the Sun, particularly in relation to its activity cycle. The solar oblateness i.e. Pole-Equator radius difference, is therefore a key input for models.
Oblateness measurements since the beginning of the 20th century are still very controversial. Many measurements were carried out, raising questions about its average value and its temporal variations. Gravitational models and helioseismology, giving access to radial profiles of latitudinal differential rotation and the internal magnetic field, have identified acceptable values of oblateness, mostly induced by the centrifugal force on superficial layers with a weak contribution of the gravitational quadrupole moment J2. Modern oblateness
measurements confirmed expected values. Time series recorded from the ground, balloons, and lately Space showed variations but they were inconclusive. They were in phase or in anti-phase with solar activity while others reported no obvious variations [1]. Oblateness measurements obtained from HMI are therefore a major asset for explaining those of the past and the inconsistencies reported since they now cover almost an entire cycle.
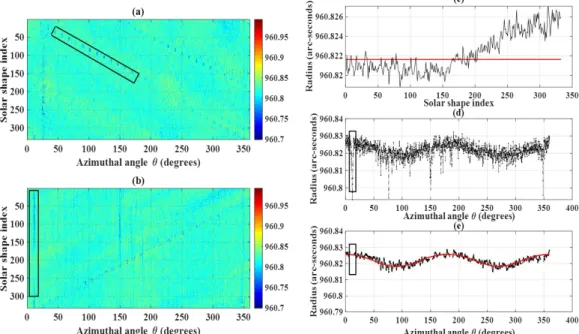
Solar oblateness is computed from images recorded during roll procedures, i.e. the calibration mode of SDO where the spacecraft is rotated around HMI line-of-sight. The roll procedure is run twice a year with solar images recorded in the continuum near the Fe I absorption line (617.3 nm) in a narrow band (70 mA). The processing method is explained with Figure 1. It allows estimating the solar shape that is fitted with Legendre polynomials up to the fourth order. The dimensionless distortion coefficients C2 (quadrupole) and C4 (hexadecapole) are
thus estimated, which makes it possible to deduce solar oblateness.
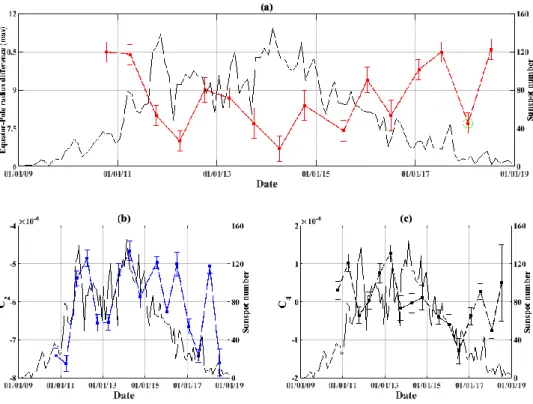
Roll sequences, ran between October 2010 and July 2018, resulted in an average solar oblateness of 8.8 ± 0.8 mas (6.4 ± 0.6 km), in good agreement with measurements of the last two decades and consistent with helioseismology-based models. Time variations were observed and appear in anti-phase with Cycle 24 sunspot number taken as proxy of solar activity (Fig. 2). C2 variations are in phase with activity while C4 presents anti-symmetric
made in Cycle 24 with HMI and other Space missions are plotted against sunspot number (Fig. 3). A linear relationship between these solar parameters is observed (R2=77%). The negative slope confirms that oblateness variations are in anti-phase with activity. A similar analysis was performed on oblateness measurements made in Cycle 23 with the Heliometer (Pic-du-midi, France) and from Space (MDI and RHESSI). The linear regression vs. sunspot number (R2=79%) shows a positive slope indicating that oblateness variations are in phase
with activity of Cycle 23 (Fig. 3). Finally, concerning the previous cycle, anti-phase variations with activity were reported from measurements made on balloons in the descent of Cycle 22 [2].
In summary, the Sun initiates a physical process that results in an oblateness pulsation with a period of twice the 11 yr solar cycle. The Sun has maximum swelling during odd cycles and vice versa for even ones, i.e. the solar shape oscillates like the magnetic field having extreme values during its polarity inversion. The measurement time relative to the oscillation period of solar oblateness explains the controversy reported in the literature for previous measurements. The magnetic field was first mentioned in 1967 to model oblateness [3]. Why it oscillates with the solar magnetic field is a new challenge.
Reference
[1] Irbah, A., Mecheri, R., Damé, L. & Djafer, D. 2019, ApJL, 875, L26 [2] Egidi, R., Caccin, B., Sofia, S., et al. 2006, SoPh, 235, 410
Fig. 1 Processing method illustrated with the roll of July 22, 2015. (a) Azimuthal variations of solar radius obtained from images (332); each line is a solar shape. Solar active regions (rectangle) affect shapes. (b) To compensate for the spacecraft rotation, they are shifted to have their western equator at a zero azimuth angle: active regions are spread out along columns and CCD defaults on oblique directions. (c) A time drift of solar radius is observed (black) and corrected (red). (d) The mean shape is computed but affected by active regions. (e) They are removed and the solar shape filtered then fitted with Legendre polynomials (red).
Fig. 2 Fit model parameters obtained from HMI during Cycle 24. (a) Temporal oblateness variations (red) are in anti-phase with sunspot number (black). (b) C2 variations (blue dots)
are in phase with activity. (c) C4 (black dots) has anti-symmetric variations relative to the time
of solar activity maximum.
Fig. 3 (a) All oblateness measurements made during Cycle 24 vs. sunspot number. A linear relationship is observed (R2=77%). The negative slope shows oblateness variations in anti-phase with activity. (b) Same plot with all measurements recorded during Cycle 23. The linear regression (R2=79%) shows a positive slope, expressing oblateness variations in phase with activity.