HAL Id: halshs-02862874
https://halshs.archives-ouvertes.fr/halshs-02862874
Preprint submitted on 9 Jun 2020HAL is a multi-disciplinary open access archive for the deposit and dissemination of sci-entific research documents, whether they are pub-lished or not. The documents may come from teaching and research institutions in France or abroad, or from public or private research centers.
L’archive ouverte pluridisciplinaire HAL, est destinée au dépôt et à la diffusion de documents scientifiques de niveau recherche, publiés ou non, émanant des établissements d’enseignement et de recherche français ou étrangers, des laboratoires publics ou privés.
Minimum wage and immigrants’ participation in the
welfare system: evidence from France
Eva Moreno-Galbis
To cite this version:
Eva Moreno-Galbis. Minimum wage and immigrants’ participation in the welfare system: evidence from France. 2020. �halshs-02862874�
Working Papers / Documents de travail
WP 2020 - Nr 20
Minimum wage and immigrants’ participation in the welfare
system: evidence from France
Minimum wage and immigrants’ participation in the
welfare system: evidence from France
Eva Moreno - Galbis∗†
Abstract
This study examines how minimum wage laws affect the share of immigrants receiving wel-fare benefits. Minimum wage increases might have larger effects among low-skilled immigrants than among low-skilled natives because, on average, immigrants are less productive. We develop an analytical framework in which a government legislated minimum wage increase promotes a decrease in labor demand and an increase in the earned wage. The net impact on the expected wage is then ambiguous and so is the impact on search effort of unemployed. However, we expect the reduction in labor demand to be more important for immigrants due to their lower productivity. Immigrants remain unemployed and eventually become welfare recipients. Using the French Labor Force Surveys 2003-2016 we exploit the 2006 and 2012 government legislated minimum wage increases and find consistent evidence that a discretionary increase in the min-imum wage induces a rise in the share of immigrants receiving welfare benefits which is more important than the rise estimated for natives. This result is driven by low-skilled immigrants and no significant effect arises for high-skilled. Endogeneity issues are addressed through an IV approach.
Keywords: minimum wage, welfare benefits, immigrants JEL: J15; J38; H53; J23;
∗Corresponding author. Aix-Marseille Univ., CNRS, EHESS, Centrale Marseille, IRD, AMSE, Marseille, France.
Email: eva.moreno-galbis@univ-amu.fr
†I would like to thank Johanne Bacheron for research assistance. I also would like to thank, without implicating,
Tanguy Van Ypersele, Yves Zenou, Sylvie Blasco, Marc Sangnier and participants of the AMSE seminar for helpful comments and suggestions. I acknowledge financial support from the Institut Universitaire de France and from the French National Research Agency Grant ANR-17-EURE-0020.
1
Introduction
Public social spending in France has increased from 28.7% of GDP in 2003 to 31.2% in 2018. France is the OECD country with the largest share in public social spending. Its public debt has also progressed from 79% of GDP in 2003 to 122% in 2018. Only Italy and Portugal in the European Union display higher public debt. The unsustainable path of higher public social spending and higher public debt has led successive governments to implement (more or less successfully) reforms aimed at reducing the generosity of the welfare system. Simultaneously, the French government has renewed the commitment to ensure the standards of living of the most vulnerable citizens by pursuing the automatic re-evaluation mechanism of the minimum wage and by implementing discretionary increases in the minimum wage in 2006 and 2012.
The idea behind this policy is that by combining the reduction in social aids with the increased minimum wage, low-skilled individuals (which are the main beneficiaries of social aids) will be incited to search for a job more intensively and will accept it more easily. This should contribute to reduce public debt while guaranteing the standards of living of most vulnerable people. This reasoning misses though one important point. By augmenting labor costs, minimum wage increases promote job destruction (i.e. some jobs are not longer profitable) and reduce job creation. To ensure the profitability of a position firms require now higher productivity, which pushes up unemployment duration of low productivity workers. Eventually, these workers end “falling” in the minimum income support program (once their unemployment rights are exhausted), which increases public social spending.
We test this idea in the paper. We focus on the most vulnerable population in France: foreign born people, i.e. immigrants. During the period 2003-2018 immigrants’ average unemployment rate was around 15% (while that of natives was systematically below 10%), more than 61% of immigrants living in France had less than secondary education (53% for natives) and, even if foreign born stand for 12% of the total population in France, they represent around 20% of recipients of the minimum income support program.1 Moreover, as remarked by Orrenius and Zavodny (2008), immigrants at the low end of the skill distribution tend to have fewer years of education, lower institutional knowledge and worse language skills than low skilled natives, implying that immigrants are often less productive than natives within the low skilled group. We analyze how government legis-lated minimum wage increases in 2006 and 2012 modified the proportion of immigrants receiving minimum income support.
The contribution of this paper to the existing literatures on the minimum wage and welfare par-ticipation is twofold. First, the paper proposes a theoretical and empirical framework for testing the impact of minimum wage changes on the share of recipients of welfare aids, i.e. minimum in-come support. Second, the paper provides consistent evidence that the minimum wage positively influences the share of immigrants being welfare recipients.
1Revenu Minimum d’Insertion, RMI, until 2009 and Revenu de Solidarite Active, RSA, afterwards. See section
We propose a one job-one firm matching model with search effort in the style of Pissarides (1990). For simplicity we consider a pool of individuals having low productivity, so that they are paid at the minimum wage. Within this pool of individuals there are natives and immigrants and their only difference is the average lower productivity of immigrants. However, we assume that once the contact between a firm and a worker takes place the match is formed as far as the associated surplus is positive (i.e. the firm does not reject a match providing a positive surplus even if potentially a larger surplus could have been obtained from an alternative match).
Firms open vacancies until the expected cost of opening a vacancy equals the expected profit of a filled vacancy. Any wage increase reduces the expected profit of a filled vacancy and thus the number of open vacancies. A job seeker provides search effort until the marginal cost of an additional unit of effort equals the expected payoff of this additional unit of effort. This implies that search effort increases with the expected gain from employment which is itself increasing in wages (and thus in the minimum wage). Higher search efforts favor unemployment outflows and decrease unemployment duration.
The model predicts that following a minimum wage increase, more matches will take place with natives and less with immigrants since they have lower productivity. The final impact on search effort will depend on the combined effect of the increased minimum wage and the decrease in the employment probability, that is, it depends on the progression of the expected wage. While the minimum wage increase pushes job seekers to search more intensively, the decrease in the employment probability induced by the rise in labor costs and thus decreased labor demand, reduces search effort. If this last effect is dominant, the likelihood to fall in the welfare system increases since unemployment duration raises.
We use data from the French Labor Force Surveys 2003-2016 to test the model’s predictions. Using a cell strategy based on departments,2 i.e. commuting zones, we propose an estimation in the style of Giulietti (2014) where we focus on the variation within departments in the share of immigrants being minimum income support recipients between the year before and after the minimum wage increase. In contrast with Giulietti (2014) who focuses on the expected wage as the explanatory variable, we decompose the impact on the share of immigrants receiving welfare aid between the effect coming from the change in the minimum wage and the effect explained by the change in the employment rate.
While the considered minimum wage is determined at the national level and it is therefore exoge-nous to the particular situation of the department, an endogeneity problem arises when considering the change in the employment rate. Changes in this variable certainly influence the share of welfare aide recipients in the department, however, we may also think that changes in the share of welfare recipients in the department can eventually influence the employment rate, particularly low paid workers’ employment rate. To deal with this endogeneity problem, we propose an instrumental 2The department is the geographical administrative unit immediately below the region in France. There are 95
variable strategy. We propose three alternative instruments. The first one instruments the change in the aggregate employment rate of department d with the change in the employment rate of workers earning more than 1,1 times the minimum wage in the same department. The implicit idea being that changes in the share of minimum income support recipients can only influence the employment rate of low-paid workers but not the employment rate of better paid workers. The second one instruments the change in the aggregate employment rate of department d with the average change in the employment rate in all departments except from d. The third instrument is the average change in the employment rate of all departments other than d one year before the minimum wage increase.
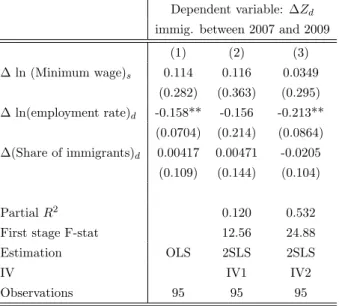
Various conclusions are drawn from the econometric analysis. First, while the 2006 minimum wage increase of 0.3 percentage points does not display a significant impact on the share of immigrants being welfare recipients, the 0.6 percentage point increase in 2012 did have a significant impact. This is probably explained by the fact that the 2006 increase followed a progressive harmonization of various minimum wage components between 2003 and 2005 which had promoted an increase of the lowest wage by 17.6% in three years. The 2006 increase was then relatively very low and all the potential impact on the share of welfare recipients had already taken place during the three previous years. Second, for the 2012 increase, changes in the employment rate influenced negatively and significantly the share of immigrants receiving minimum income support, while this share was positively and significantly influenced by the increase in the minimum wage. Third, the impact was more important on the share of immigrants receiving welfare benefits than on the share of natives. Fourth, robust tests confirm that the effect of the minimum wage on the share of immigrants receiving welfare benefits is driven by low skilled immigrants and the effect is not significant for high skilled. Moreover placebo tests over the period 2007-2009, where no government legislated minimum wage increase took place show that in the absence of a discretionary increase, the minimum wage change induced by the automatic re-evaluation mechanism, has no significant effect on the share of welfare recipients.
Our paper contributes to both minimum wage and welfare participation literatures by creating a link between both of them. Previous studies of immigrant welfare dependency find that immigrants are in average more likely to relay in unemployment insurance, welfare and other forms of welfare transfers than native-born individuals. This greater participation rates among immigrants are though largely found to be explained by differences in observable socioeconomic characteristics among both nativity groups (see Blau, 1984; Maani, 1993). Previous studies show that immigrant participation in the welfare system increases also with years of residence in the host country (see Baker and Benjamin, 1995; Borjas and Hilton, 1991; Borjas and Trejo, 1991, 1993).3 Working with Swedish and German data, respectively, Hansen and Lofstrom (2003) and Riphahn (2004) conclude
3
In contrast with Baker and Benjamin (1995) who, working with Canadian data, concluded that immigrants from recent cohorts displayed higher participation rates in welfare programs than earlier cohorts, Crossley et al. (2001); Ostrovsky (2012) conclude instead that the evidence of the rising immigrant participation entitlement programs was, at best, mixed.
that immigrant groups originating from poor countries are more likely to participate in the social assistance program even when controlling for observable characteristics. Hansen and Lofstrom (2003) also estimate that even after 20 years in the host country immigrants show significantly higher social-assistance-participation rates than statistically similar natives. Using Norwegian data Bratsberg et al. (2010) confirm that immigrants assimilate into the welfare system with years of residence. Once immigrants loose their job they do not come back to employment and remain unemployed receiving social assistance.
Most of the previous papers simply assume that immigrants prefer to assimilate into the welfare system rather than looking for a job. In this paper we propose an alternative explanation which applies for low-skilled immigrants, or at least for immigrants occupying low-skilled jobs. In the presence of a binding minimum wage, it may not longer be in the interest of firms to hire these immigrants if they have lower productivity than natives with similar skill level. After loosing their job immigrants are then simply not able to re-enter employment and they eventually fall into the welfare system.
The impact of the minimum wage on employment has been very controversial in the economic literature. The neoclassical literature predicts that higher minimum wages (above the market equi-librium wage) induce higher earnings but lower employment-to-population rates. Research in the 1990s onward challenged this conventional wisdom. The “new minimum wage research” literature exploits variation in state-specific minimum wage in the US and finds zero or slightly positive em-ployment effect of the minimum wage on emem-ployment (see Allegretto et al., 2011; Card, 1992a,b; Card and DiNardo, 2000; Card and Krueger, 1994; Dube et al., 2010, 2007; Katz and Murphy, 1992; Zavodny, 2000). Explanations for these results include decreased hours worked per worker instead of in the number of workers, imperfectly competitive labor markets, underground economy (i.e. people work for wages below the wage floor) and improved quality or productivity of workers that compensates wage increases. Many papers have criticized the approach proposed by the “new minimum wage research” (see Deere et al., 1995; Kim and Taylor, 1995; Neumark and Wascher, 2000; Welch, 1995) and other papers still find negative employment effects mainly concentrated among younger workers (see Currie and Fallick, 1996; Neumark, 2001; Neumark and Reed, 2004; Neumark and Wascher, 2002; Williams and Mills, 2001). The widely view today in economics is that relatively small increases in the minimum wage exert negligible impacts on employment (see recent works by Clemens and Strain, 2018, and Clemens and Wither, 2019).
Other than Orrenius and Zavodny (2008), there is no much research on the impact of minimum wages on immigrants’ earnings and employment. As remarked by the authors, the impact of minimum wage on immigrants is important not only because of the increasing proportion of foreign born among the low skilled workforce, but also because the impact of the minimum wage on immigrants is longer-lasting than for natives.4 A large share of immigrants with little education 4See also the paper by Neumark and Nizalova (2007) on the long term effects of exposure to high minimum wage
may be mired in low-wage jobs for their entire working life. Changes in the level of the minimum wage and its impact on employment play then a major role in both the standards of living and the labor market performance of immigrants.
Our paper complements the work by Orrenius and Zavodny (2008) which compares the effect of minimum wages on employment, hours worked, and earnings among adult immigrants and natives who did not have a high school diploma in the U.S. They study how these impacts influence the settlement patterns of low-skilled immigrants and conclude that they may actually be discouraged from settling in states where the wage floor is above the federal minimum.
We consider instead the impact of minimum wage changes on the share of immigrants receiving welfare benefits in France. France has a binding minimum wage. Over the past two decades the minimum wage in France stands for 50% of the average wage and 62% of the median wage, which are the highest values in the European Union. We argue that government legislated increases in the minimum wage may put a non-negligible share of low productive immigrants out of work, since they are not longer profitable workers for firms. These low productive immigrant job seekers do not manage to re-enter the labor market at the new minimum wage and eventually fall into the welfare system, where they are likely to remain long time given that they are not longer profitable workers.
By making the link between the welfare participation and the minimum wage literatures, our paper internalizes an additional cost associated with a minimum wage increase which has been traditionally neglected by the economic literature: an increase in public social spending coming not only from the unemployment insurance, but also from social assistance for workers who exhaust their unemployment insurance’s rights. While minimum wage increases aim at ensuring low-paid workers’ standards of living, they push also the most vulnerable workers out of the labor market and into the welfare system, where they are likely to remain long time (as remarked by Bratsberg et al., 2010 for Norway).
Section 2 presents the analytical framework and identification strategy. Data, variables and de-scriptive statistics are presented in section 3. Benchmark results and robustness tests are presented in section 4. Section 5 concludes.
2
Analytical framework and econometric strategy
We consider the one job-one firm matching model proposed in Pissarides (1990) with search effort. Time is continuous, agents are risk neutral and discount the future at a common rate r. We consider only the labor market pool composed by low productive workers, who can only find jobs at the bottom of the productivity distribution and who are then paid at a low wage. Individuals can be employed or unemployed. In case of unemployment the individual must decide the optimal amount of search effort.
2.1 Matching process
We use the subscript j = N, I when referring to a native or an immigrant (foreign-born) worker. The workforce P is such that P = PI+ PN, where PI and PN stand, respectively, for the native and immigrant workforce, and P can be normalized to unity without loss of generality. Natives and immigrants may be employed (nj) or unemployed (uj), and the number of vacancies is denoted by v. The matching function can be written as: M = m(v, (eNuN + eIuI)), where ej corresponds to the average search intensity of j and u = (eNuN + eIuI) is the effective stock of job seekers.
M = m(v, u) is strictly increasing, concave, homogeneous of degree 1, satisfies Inada conditions and M (v, 0) = M (0, u) = 0.
Labor market opportunities are described by the market tightness variable θ = v/u. The proba-bility for a firm to fill an empty vacancy equals m(θ) = M/v. The probaproba-bility of finding a job for an unemployed worker is given by p(θ) = M/u = θm(θ).5
2.2 Firm’s behaviors
When the firm posts a vacancy it bears an advertising cost h. The match takes place successfully at probability m(θ). The value of an empty vacancy equals:
rV =−h + m(θ)(ϕ(JN − V ) + (1 − ϕ)(JI− V )) (1)
where Jj stands for the value of a filled vacancy. The firm fills the vacancy with a native worker with probability m(θ)ϕ and with an immigrant worker with probability m(θ)(1− ϕ). We assume that ϕ is exogenously determined. While in the very long run this may be an unrealistic hypothesis, in our case, we will be considering a period of time going from the year before to the year after a minimum wage government legislated increase, which is sufficiently short to ensure a relatively constant nativity composition in the pool of low skilled job seekers.
We assume that due to the lack of host country language skills and other host country human capital assets immigrants have an average a lower productivity than natives. The value of a vacancy filled by a native and an immigrant worker are respectively:
rJN = yN − wN + χ(V − JN) and rJI = yI− wI+ χ(V − JI) (2) Among minimum wage earners wN = wI = wM in, implying that the value of a filled vacancy is larger for natives than for immigrants since yN > yI.
At the equilibrium firms open vacancy until no more profit can be obtained, that is, at the equi-librium, all rents from vacant jobs are exhausted and V = 0, which leads to:
h m(θ) = ϕJN+ (1− ϕ)JI= ϕ yN − wn r + χ + (1− ϕ) yI− wI r + χ (3) 5
The hypothesis of equal probability of finding a job for natives and immigrants is consistent with the estimates of Datta-Gupta and Kromann (2014) on Danish data.
Expected costs from opening a vacancy (left-hand side) should equal the expected profits from a filled vacancy (right-hand side). Given that m′(θ) < 0 it results that θ is decreasing in wj for
j = I, N . If wN = wI = wM in equation (3) determines θ.
Firms have an interest in hiring workers as long as their wage is below or equal to their productivity. In the equilibrium, search wages lie in general below productivity. It is thus possible to increase wages beyond their equilibrium value and firms will continue to make profit. This implies that even if the government sets a minimum wages wM in > w∗j where wj∗ stands for the equilibrium search wage negotiated between firms and workers, firms will still have an interest in hiring workers as far as wM in ≤ yj for j = I, N . Since the focus of the paper is on minimum wage earners the wage determination process will no play any role in this framework.6
2.3 Workers’ behaviors
The individual faces a trade-off between the expected payoff from search and the associated cost. A level of effort e induces a cost c(e), where c′(e) > 0, c′′(e) > 0 and c(e = 0) = 0. The instantaneous utility of the worker is then equal to the income received from the income support program, z, minus the cost of search effort, c(e).7 Assume that between two periods t and t + dt labor market tension equals θ(t). If the unemployed worker decides to produce an effort ej(t) the associated expected utility at t equals:
Uj(t) = 1
r + rdt{(z−c(ej(t)))dt+ej(t)θ(t)m(θ(t))dtWj(t+dt)+(1−ej(t)θ(t)m(θ(t))dt)Uj(t+dt)} (4) where Wj(t + dt) and Uj(t + dt) stand for the expected utilities of an employed and an unemployed worker at t + dt. They do not depend on the search effort ej(t) made by the individual between
t and t + dt.8 The optimal search effort is then determined by ∂Uj(t)
∂ej(t) = 0. At the stationary
equilibrium the value of the variables does not depend on the realization date so we have:
−c′(e∗j) + θm(θ)(Wj− Uj) = 0 (5)
At the stationary equilibrium, the marginal cost of an additional unit of effort equals the expected payoff of this additional unit of effort. The value of employment and unemployment at this 6For simplicity, we could have followed Pissarides and Vallanti (2007), Mortensen and Nagypal (2007) and
Nagypal (2007) and adopt the rigid wage definition proposed by Hall and Milgrom (2008). The worker receives a payoff z in case negotiations fail, but also when the agreement is delayed. For the firm, we assume that there is no cost while the bargaining continues. Firms and workers renegotiate the division of the match product yj
for j = I, N , so that the outcome of the symmetric alternating-offers game is simply wN = ηyN + (1− η)z and
wI= ηyI+ (1− η)z, where η can be interpreted as the bargaining power of each party and z represents the revenue
received by low qualified workers from the income support program. Because yN> yI we will have wN∗ > wI∗.
7Since the focus of the paper is on the minimum income support schemes we normalize to zero all other outside
employment opportunities such as the value of leisure, home production or, eventually, unemployment benefit.
8The average search effort e
jfor j = N, I is taken as constant by the individual when making her optimal choice
equilibrium equal rWj = wj + χ(Uj − Wj) and rUj = z− c(ej)− ejθm(θ)(Wj− Uj), so that we find: Wj− Uj = wj− z + c(ej) r + χ + ejθm(θ) (6)
An increase in wj rises the relative value of being employed with respect to unemployed while an improvement in labor market tension, θ, increases the probability of finding a job and thus the relative value of unemployment with respect to employment.
Since there is a unique labor market tightness, job destruction rate, discount factor and z, we conclude from equations (5) and (6) that all minimum wage earners wN = wI = wM in will choose the same optimal search effort since (WN− UN) = (WI− UI) = (W − U). Replacing (W − U) in equation (5) we obtain the equilibrium search effort as a function of labor market tightness and the minimum wage:
Φ(e∗, θ) =−c′(e∗)(r + χ + e∗θm(θ)) + θm(θ)(wM in− z + c(e∗)) = 0 (7) For a given wM in, equation (7) defines an increasing relationship between θ and e∗: an increase in the labor market tightness increases returns to search effort pushing unemployed to search more intensively.9 This should reduce unemployment and therefore the number of people that receive z.
2.4 The equilibrium and static comparative analysis
Equation (3) provides the relationship between the labor market tightness and wages. We refer to it as the labor demand curve, LD. For a given wM in equation LD provides the equilibrium labor market tightness θ∗. It will correspond to an horizontal line in the (e, θ) space (see Figure 1). Equation (7) defines a positive relationship between labor market tightness and optimal effort. It is represented by the positive sloped slot EE in Figure 1. The intersection between the LD and the EE curves, determines the optimal search effort.
An increase in the minimum wage, decreases the number of posted vacancies, inducing a downward shift in LD towards LD′ and determining a new lower labor market tightness equilibrium. The increase in the minimum wage rises returns to search effort. For identical labor market tightness workers are incited to search more intensively implying a rightward shift in the EE locus towards EE′. The combined increase in wM in and the reduction in the employment probability leads to an ambiguous effect in the expected wage and thus in the search effort. The final impact on search effort and thus on the number of people that remains unemployed and eventually receives minimum income support will depend on which effect dominates.
In our analytical framework, as far as yN − wM in > 0 and yI− wM in > 0 the firm is indifferent between hiring a native or an immigrant, since the obtained surplus is positive.10 However, since
9
Remark that Φ(e∗, θ) is decreasing in search effort due to convexity of the search effort function, implying that
it defines a unique value for the search effort.
Figure 1: The impact of an increase in the minimum wage on labor market tightness and search effort
yI < yN it may happen that, following a minimum wage increase, yI−wM in < 0 while yN−wM in > 0. In this case, the match with an immigrant never takes place. Search effort of immigrants is completely discouraged in spite of the higher earning prospects, since the probability to find a job falls to zero for them implying a zero expected wage. Immigrants remain then unemployed and eventually fall into the welfare system.
2.5 From theory to econometrics: identification strategy
When the individual is not eligible to unemployment benefits or when unemployment insurance’s rights are exhausted, the individual falls into the welfare system. The probability of receiving the minimum income depends then on how long the individual remains out of work, which depends on the search effort, z = G(e). As shown by our theoretical framework, search effort depends itself on the expected wage we and, eventually, other factors that we denote x, e = F (we, x). In our theoretical framework, we are considering minimum wage earners, implying that the expected wage equals we= wM in· n, where n stands for the employment probability among minimum wage earners.
As in Giulietti (2014), we can assume that a change in the minimum wage only modifies the expected wage and has no impact on x, so that:
∂e ∂wM in = ∂F ∂we ∂we ∂wM in (8)
From our previous framework, we easily conclude that ∂w∂Fe > 0, that is, an increase in the expected
wage increases search effort since the expected gain of finding a job raises. As shown by our theoretical framework ∂w∂wM ine may be positive or negative depending on whether the increase in
reduction in the number of posted vacancies: ∂we ∂wM in = ∂n ∂wM inw M in+∂wM in ∂wM inn (9)
This expression implies that the change in the expected wage is negative for values of the elasticity of demand larger than one: ∂w∂wM ine < 0⇔ ∂w∂nM inw
M in
n <−1. A raise in w
M in induces an increase in we if and only if the wage gains are not offset by the adverse employment effects. The term
∂n
∂wM inwM in captures the negative impact of the minimum wage increase in labor demand and thus
search effort. In contrast ∂w∂wM inM inn captures the positive effect of the minimum wage increase in
the expected wage and therefore on search effort. The higher the employment probability n, the higher the increase in the expected wage promoted by the minimum wage rise.
The relationship between the probability of receiving minimum income support and the minimum wage equals then:
∂z ∂wM in = ∂G ∂e ∂e ∂wM in (10)
where, as shown by our theoretical framework, ∂G∂e < 0 since search effort increases the probability of finding a job and decreases thus the probability of receiving the minimum income support. Combining equations (8) and (10) we find:
∂z ∂wM in = ∂G ∂e ∂F ∂we [ ∂n ∂wM inw M in+∂wM in ∂wM inn ] = ∂G ∂e ∂F ∂we ∂n ∂wM inw M in+∂G ∂e ∂F ∂wen (11) Because an increase in the expected wage increases search effort (∂w∂Fe > 0) and search effort
decreases the probability of receiving the minimum income support (∂G∂e < 0), the interacted term
∂F
∂we∂G∂e < 0 is always negative. The first term in the right hand side of equation (11) is positive.
Because labor demand is decreasing in wages ∂w∂nM in < 0, we have that ∂G∂e ∂w∂Fe∂w∂nM inwM in >
0. Intuitively, an increase in the minimum wage reduces labor demand and thus employment prospects. Search effort falls and the share of people receiving minimum income should increase. Because n > 0 the second term in the right hand side is instead negative, i.e.∂w∂Fe∂G∂en < 0.
Intuitively, the increased expected wage promoted by the rise in the minimum wage stimulates search effort, leading to a decrease in the share of participants in the welfare system. The higher the employment probability, n, the larger the increase in the expected wage and the larger the negative impact on the share of welfare recipients since search effort is stimulated.
We propose an empirical procedure in the style of Giulietti (2014) to estimate a reduced form equation from equation (11). In line with our analytical framework, at a given period t the share of immigrants receiving minimum income support in department d, denoted Zdt, depends on the one hand on the log of the expected minimum wage resulting from the interaction between the (national) minimum wage and the employment rate in the department. On the other hand, time invariant and time varying fundamentals of the department d also influence the share of welfare recipients. We can then express the share of immigrants receiving minimum income support in
department d as follows:
Zdt = βwM int + γndt+ ηxdt+ αd+ εdt (12)
where wtM in stands for the log minimum wage determined at the national level, ndtis the log of the employment rate in department d, xdt stands for time-varying fundamentals of department d and
αd for time invariant fundamentals. The error term is represented by ϵdt. In line with equation (11), we are interested in the variation in the share of minimum income recipients following a change in the minimum wage. Our baseline equation equals then:
∆Zd= β∆wM in+ γ∆nd+ η∆xd+ ∆εd (13)
In contrast with Giulietti (2014) we decompose the log of the expected wage between the log of the minimum wage and the log of the employment rate at the department level. The expected minimum wage reflects the final outcome resulting from the increase in the minimum wage and variation in the employment rate. This final outcome is not our main variable of interest here. We seek to estimate a reduced form of equation (11) where we disentangle between the positive and negative impacts on the share of welfare participants following a rise in the minimum wage. By decomposing the log of the expected wage between the log of the minimum wage and the log of the employment rate, our reduced equation setup allows to approximate the two contradictory effects on the share of welfare participants represented in equation (11). The first term on the right-hand side of the equation ∂G∂e ∂w∂Fe∂w∂nM inwM in > 0, reveals that any increase in the minimum
wage will induce a decrease in labor demand for low-skilled workers (due to higher labor costs), higher unemployment and thus a rise in the share of welfare participants. This positive effect of the minimum wage on the share of minimum income recipients is captured by β in the reduced form equation (13). We expect then β > 0.
The second term in equation (11), ∂w∂Fe∂G∂en < 0, reveals that the increase in the expected wage
fostered by the rise in the minimum wage should stimulate search effort and thus outflows from unemployment, eventually decreasing the share of welfare participants. This effect should be the more important the higher the employment probability, ndt. We expect then γ < 0 when estimating equation (13).
The regression model is estimated using first differences, by subtracting observations related to the period before the minimum wage increase from observations referred to the period after the minimum wage increase. This allows us to eliminate unobservable factors that characterize each observational unit. It also allows to partially control for the potential higher/smaller propensity of immigrants to apply for minimum income support.11 Additionally, we consider a national policy, i.e. a government legislated increase in the minimum wage, that is exogenous to the particular department conditions.
11Evidently, we cannot exclude that between two periods there could be a change in the propensity of immigrants
Finally, using OLS to estimate equation (13) may generate biased estimates because the expected minimum wage could be endogenous. Reverse causality issues may apply, since the expected min-imum wage results from the interaction of the minmin-imum wage and the employment rate at the department level. While the minimum wage is exogenously determined at the national level, the employment rate of the department may be affected by the proportion of immigrants receiving minimum income support, besides being a cause of it. More precisely, the share of immigrants receiving income support may discourage search effort of other immigrants having similar char-acteristics (i.e. network’s effects) and this may affect the employment rate in the corresponding department, i.e. commuting zone. This would particularly apply if we were considering the em-ployment rate of people earning around the minimum wage since most welfare recipients are very low qualified and can eventually expect to find a job paid at best at the minimum wage. In our case, we consider the employment rate at the department level which should be less influenced by the share of minimum income recipients (as shown in the descriptive statistics section among working-age people only 2.3% of natives and 4.3% of immigrants are minimum income recipients). To identify the causal effect of interest, we rely though on an instrumental variable approach. We must find a variable that is correlated with the employment rate change at the department level yet unaffected by the share of immigrants receiving minimum income support.
To be a recipient of the minimum income the individual must have no income or very low income. The facto, this implies that more than 76% of minimum income support recipients has less than the Baccalaureate diploma and 89% has at most the Baccalaureate diploma. These people could, at best, expect to find a job paid at the minimum wage. We then consider as an instrument the variation in the employment rate of people earning a wage above 1.1 times the minimum wage, which leads to the exclusion of people earning between the old and the new minimum wage.12 The employment rate of these workers is likely to be influenced by an exogenous increase in the minimum wage since firms’ global labor costs are affected, yet it is less likely to be influenced by the share of recipients of the minimum income support. This share is most likely to influence employment only at the very bottom of the wage distribution.13 The exclusion restriction implies that the variation in the employment rate of people earning more than 1.1 times the minimum wage is correlated with the employment variation in the department yet uncorrelated with the share of immigrants receiving minimum income support. The variation in the employment rate of workers earning more than 1.1 times the minimum wage is then exclusively attributable to the exogenous change in the minimum wage.
To test the robustness of the results I also propose two alternative instruments exploiting the 12
To analyze whether the minimum wage is a pull factor for immigrants Giulietti (2014) instruments the expected wage with the share of wageworker immigrants who earn between the new and old minimum wage. In our case this share is clearly influenced by the proportion of minimum income support recipients so we rather use the complement to this share (i.e. people earning above both the old and the new the minimum wage) as an instrument.
13Regressions considering as instrument the employment rate of people earning above 1.2 and 1.3 times the
average variation in the employment rate in all departments except from d. A first instrument considers the variation before and after the minimum wage increase and a second instrument the variation the year before the minimum wage increase (i.e. between 2004 and 2005 when considering the 2006 increase and between 2010 and 2011 when considering the 2012 increase). While the share of immigrants being recipients of the minimum income support in department d may eventually influence the employment rate variation in department d, it is less likely to influence the average variation in the employment rate of all the other departments in France. Our exclusion restriction is that the average employment variation in all departments except from d is correlated with the employment variation in department d yet unaffected by the share of immigrants recipients of income support in that department.
3
Data
3.1 Data base
The French Labor Force Survey (LFS) was established as an annual survey in 1982. Redesigned in 2003, it is now a continuous survey providing quarterly data. Participation is compulsory and it covers private households in mainland France. All individuals in the household older than 15 are surveyed. The LFS provides detailed information on individual characteristics of the respondent.14 Immigrants are defined as people born abroad.
Each individual is surveyed over 6 consecutive quarters. Questions concerning wages and social aids are only raised in the first and sixth interviews. Weights proposed by the LFS differ when considering questions raised in the 6 interviews with respect to questions raised only in the first and last interview, so as to ensure the representativeness of the sample. We systematically implement weighted regressions and adapt the weights to the considered questions. For our purpose, the main topics covered by the LFS concern employment, wage, place of residence, social benefits received by the individual, place of birth, year of arrival in France and other demographic characteristics (such as education/qualification, civil status, age, gender, etc).
Because questions on the social benefits are only raised in the first and sixth interviews, our sample size for the period 2003-2016 equals 1,041,427 native individuals and 131,658 immigrant individuals.
14The quarterly sample is divided into 13 weeks. From a theoretical point of view, the sampling method consists
of a stratification of mainland France into 189 strata (21 French regions× 9 types of urban unit) and a first stage sampling of areas in each stratum (with different probabilities, average sampling rate = 1/600). Areas contain about 20 dwellings and among them only primary residences are surveyed. Each area is surveyed over 6 consecutive quarters. Every quarter, the sample contains 6 sub-samples: 1/6 of the sample is surveyed for the first time, 1/6 is surveyed for the second time, . . . , 1/6 is surveyed for the 6th (and last) time. When it was run as an annual survey, every year a third of the sample was renewed meaning that each individual was interviewed only 3 times. The collection method has always been a face-to-face interview. However, since 2003, a telephone interview has been employed for intermediate surveys (2nd to 5th).
3.2 Variables
The French minimum income support program is intended to guarantee unemployed people, or workers who have a very low income, a minimum level of income, which is variable, according to the number of people in the household. Until 2009, the minimum income support program was referred as Revenu Minimum d’Insertion (RMI). From 2009 summer, it was replaced by the Revenu de Solidarite Active (RSA) a more ambitious instrument that concerned not only all former beneficiaries of the RMI but also the holders of the API15(beneficiaries are single women in state of pregnancy or singles having a child with less than three years old) and working poor earning less than 880 euros per month (see Appendix A for details).
The LFS provides data on whether the individual benefits or not from the minimum income support program. To have time consistent series we consider that before 2009 the individual is a recipient of income support if she receives RMI or API while after 2009 the individual will be considered as a beneficiary of minimum income support if she receives the RSA (note that the API disappears after 2009 since it is included in the RSA). When collapsing by department-nativity-year cells we obtain the proportion of beneficiaries of the minimum income support program by department and nativity group (i.e. immigrants vs. natives).
France has a government-mandated minimum wage, the Salaire Minimum Interprofessionnel de Croissance (SMIC). No worker in France should be paid less than this minimum pay rate. Em-ployers in France who do not pay the legal minimum wage may be subject to punishment. The legal minimum is automatically revaluated every year. Furthermore, this revaluation may be accompa-nied by the well known “coups de pouce”, which stands for a discretionary increase government legislated.16
For 35 weekly hours and 151,67 monthly hours minimum gross wage equals 1521,22 euros. Since 2003 there have been two discretionary government legislated increases, i.e. “coup de pouce”, in the minimum wage:
• The minimum wage increased in July 2006 by 3.05%, including 0.3 points of “coup de pouce”. Unfortunately, the effect of this discretionary increase is very difficult to capture since it followed a progressive harmonization of various minimum wage components between 2003 and 2005. The harmonization led to an increase of 17.6% in the lowest hourly wage in three years. This progressive harmonization does not correspond to a discretionary increase in the minimum wage but to a progressive inclusion into the minimum wage of monthly guarantees 15Allocation Parent Isol´e.
16The revaluation stands for an increase corresponding at least to the minimum inflation observed the previous
year on the basis of the evolution of the consumer price index (excluding tobacco) for households whose head is a manual worker or employee plus 50% of the increase in the purchasing power of the reference hourly wage of workers. The government also has the possibility to give “coups de pouces”. The growth rate of the SMIC equals then:
∆wmin wmin =∆PC PC +1 2 ∆(wRHW/PC) wRHW/PC + coup de pouce
associated with the adoption of the 35 weekly hours in France. However, it induced much more important increases in the minimum wage than the actual 0.3 point of “coup de pouce” in July 2006.
• In July 2012, the newly elected president, Francois Hollande, decided a 2% increase in the minimum wage, including 0.6 points for the “coup the pouce”.
For the July 2006 increase we define 2005 as the year before and 2007 as the year after. For the July 2012 increase we define 2011 and 2013 as the years before and after.
For every individual interviewed by the LFS we have information on her employment status (em-ployed, unem(em-ployed, inactive). We can then compute the employment rate by department. The log of the expected real minimum wage in department d is defined as the log of the national real minimum wage plus the log of the employment rate in department d, where the employment rate equals the percentage of working-age population who is employed. For our first instrument we keep the same definition of the employment rate but we consider only employed people earning more than 1.1 times the minimum wage.
Because we are considering the variation in the proportion of immigrants being minimum income support recipients by department, we introduce as a control variable the variation in the share of immigrants living in the department. As robustness test we eventually distinguish between immigrants having less than the Baccalaureate (i.e. low skilled immigrants) vs. those having at least the Baccalaureate (i.e. high skilled immigrants). We also implement a placebo test over a period where there was no minimum wage discretionary increase.
Finally, to control for composition effects, equation (13) is estimated using weighted least squares with weights equal to the population in each department in 2003, that is, before the increase in the minimum wage. Robust standard errors are clustered at the department level.
3.3 Descriptive analysis
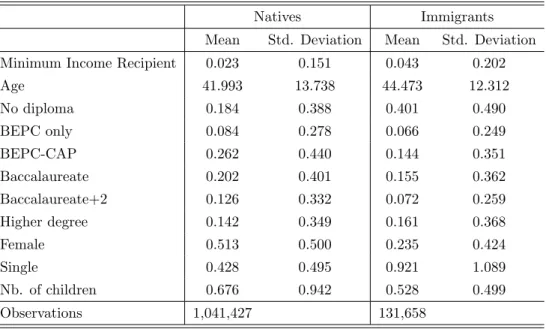
Table B.1 in Appendix summarizes the main characteristics of our sample which covers the period 2003-2016. It includes 1,041,427 natives and 131,658 immigrants aged between 18 and 65 years old (see also Table B.2 in Appendix B). In average immigrants appear slightly older, they are less often single (only 23.5% of immigrants are single against 42.8% of natives) and have more children than natives. The proportion of immigrants without any diploma is twice the proportion of natives, and they are in average less educated for all diploma levels lower than tertiary education. More importantly, over the considered period an average of 4.3% of the immigrant sample received minimum income support while this share is reduced to 2.3% when considering natives.
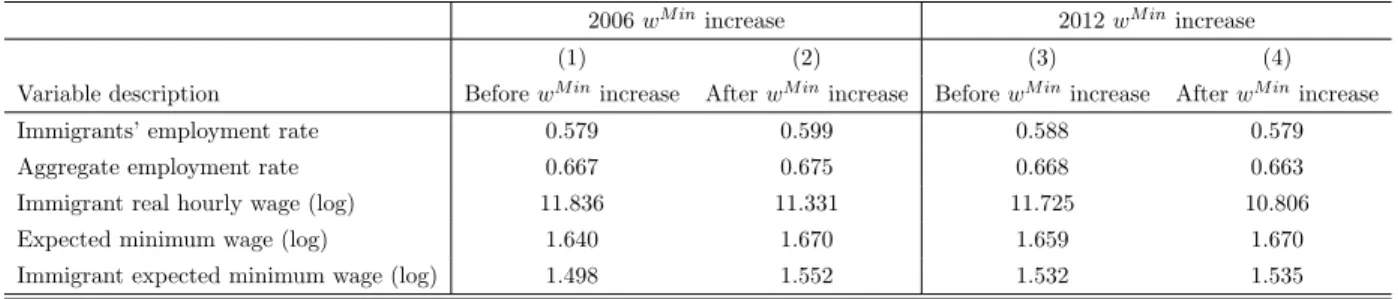
Table 1 describes the labor market situation of immigrants before and after the minimum wage increase. Columns (1)-(2) present the labor market situation in 2005 and 2007, respectively, that is a year before and after the 2006 minimum wage increase. Columns (3)-(4) correspond respectively to years 2011 and 2013, since the second minimum wage increase took place in 2012. As observed
from the first row, the share of employed immigrants over the working-age immigrant population increased by 0.02 percentage points after the 2006 minimum wage increase, while it decreased by almost 0.01 p.p. following the 2012 increase. These are though raw statistics, and changes in the immigrant employment rate may simply reflect general macroeconomic conditions rather than the impact of the minimum wage increase. Actually, as shown by the second raw in the table the aggregate employment rate in France also increased between 2005-2007 and decreased between 2011-2013.
The third row in Table 1 displays immigrants’ log real hourly wage. During the 2005-2007 period there was a decrease by 4.3% in the real hourly wages of immigrants. This decreasing trend persisted during 2011-2013 where the real hourly wages of immigrants decreased by 7.8%. In both cases, the relative increase in the share of employed immigrants in low paid jobs is likely to be an explanatory factor of these changes in the average wage received by foreign born workers.
Table 1: Labor market characteristics of immigrants, LFS 2003-2016.
2006 wM inincrease 2012 wM inincrease
(1) (2) (3) (4)
Variable description Before wM inincrease After wM inincrease Before wM inincrease After wM inincrease
Immigrants’ employment rate 0.579 0.599 0.588 0.579 Aggregate employment rate 0.667 0.675 0.668 0.663 Immigrant real hourly wage (log) 11.836 11.331 11.725 10.806 Expected minimum wage (log) 1.640 1.670 1.659 1.670 Immigrant expected minimum wage (log) 1.498 1.552 1.532 1.535
According to our theoretical framework, the expected minimum wage stands for the main explana-tory variable of search effort and thus of the share of minimum income recipients. The two last rows in Table 1 provide different definitions of the expected minimum wage. Our benchmark def-inition of the expected minimum wage corresponds to the interaction between the real minimum wage and the probability of being employed (i.e. aggregate employment rate) and it is reported in the fourth row of the table. We reasonably assume that this is the reference expected wage used by a job seeker who must decide on the search effort she devotes to find a job in the labor market anticipating that the job will be paid at the minimum wage.17
The expected minimum wage increased by 1.8% in 2005-2007 and by 0.7% in 2011-2013. While both, the progression in the aggregate employment rate and the increase in the minimum wage can explain the increase in 2005-2007, for the period 2011-2013 the rise is driven by the minimum wage, since the employment rate actually decreased during this period.
To test the robustness of our results, in the econometric estimations we propose an alternative 17We can easily argue that most people will be aware about the aggregate statistics of the labor market provided
by medias (such as the unemployment and employment rate, the minimum wage, etc) but not of the decomposition of these statistics by socio-demographic groups (such as the employment rate of immigrants, of low paid workers or of low skilled workers).
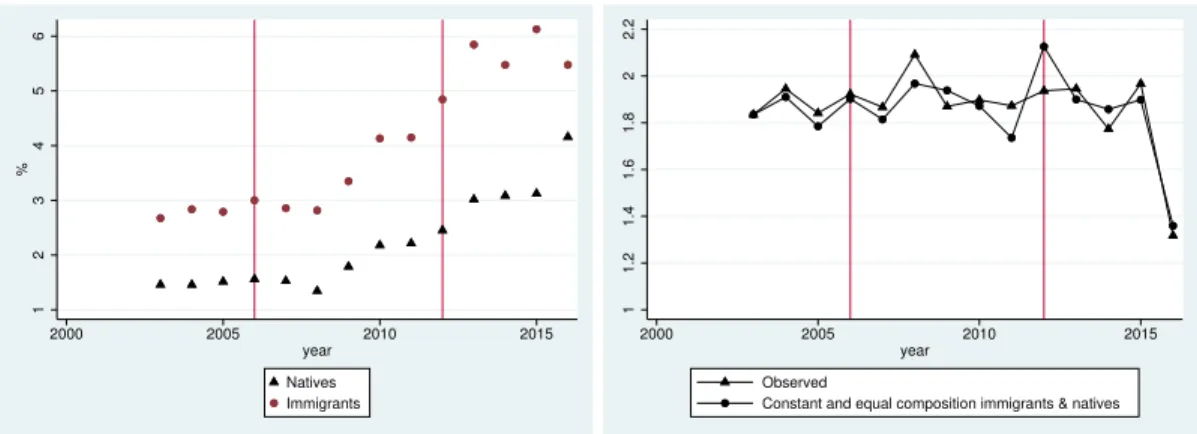
measure of the expected minimum wage. The immigrant expected minimum wage results from interacting the minimum wage and the employment rate of immigrants. It increased by 3.6% in 2005-2007 and by 0.2% in 2011-2013. Again the increase in the first period is driven by both the discretionary rise of the minimum wage and the increased employment rate of immigrants, while in the second period, the rise comes from the discretionary increase in the minimum wage. The extent to which changes in each component of the expected minimum wage influence the share of immigrants receiving minimum income support is studied in next section. Figure 2 displays though an overview of the evolution in the share of welfare beneficiaries. On the left hand side panel we find the yearly share of immigrants and natives receiving minimum income support. The right hand side panel displays the evolution in the ratio between the share of immigrants being welfare recipients and the share of natives. It displays both, the observed ratio and the counterfactual ratio that would have been observed if the demographic composition (i.e. age, education, gender, marriage, number of children) of natives and immigrants was equal and had remained constant to its 2003 level.
From the left hand side panel we observe first that, as anticipated, the replacement of the minimum income scheme RMI (and API) by the more ambitious RSA program promoted an increase in the share of beneficiaries. Second, the share of immigrants being minimum income recipients is systematically larger than that of natives, furthermore the gap seems to increase from 2012. Finally, the share of minimum income recipients does not seem to vary between the year before and after the first minimum wage increase in 2006. In contrast, the second government legislated increase in the minimum wage in 2012 is associated with a significant rise in the share of beneficiaries for both, immigrants and natives.
Figure 2: Income support programs by nativity: participation rates and ratios. France 2003-2015.
1 2 3 4 5 6 % 2000 2005 2010 2015 year Natives Immigrants 1 1.2 1.4 1.6 1.8 2 2.2 2000 2005 2010 2015 year Observed
Constant and equal composition immigrants & natives
Source: Labor Force Survey (2003-2016). 2006 and 2012 stand for the two years were there was a government legislated discretionary increase in the minimum wage.
Three major conclusions can be drawn from the right hand side panel of Figure 2. First, the ratio is systematically between 1.8 and 1.9 (except for year 2016 where it decreases to 1.36), implying that the share of immigrants receiving the minimum income support almost doubles the share of natives
along the considered period until 2016. Second, while in years 2006 and 2012, corresponding to a discretionary increase in the minimum wage, we observe a slight increase in the ratio, there does not seem to be a major break at these dates. Finally, from 2006 differences arise between the observed ratio and the counterfactual ratio, suggesting the importance of controlling for composition effects in our regressions.
Again, Figure 2 provides only raw statistics. Table 2 provides the marginal effects of a probit esti-mation over our sample of individuals, where the dependent variable equals unity if the individual receives the minimum income support. The explanatory variable of interest is being an immigrant, i.e. foreign born. We control by gender, age, age squared, civil status, number of children, having an unemployed partner, diploma level, residence duration in the host country and arrival cohort for immigrants. We also control for aggregate shocks and by systematic differences across departments of residence of the individuals (i.e. commuting zones).
Columns (1)-(2) focus on Immigrant as a single explanatory variable. Column (1) applies standard weights provided by the LFS while column (2) considers counterfactual weights imposing an equal and constant composition of natives and immigrants in terms of education, age, gender, civil status and children. Columns (3)-(4) introduce additionally the interaction between immigrant and a dummy equal to unity the year after a minimum wage increase. Again they propose estimations with standard and counterfactual weights respectively.
From Table 2 we conclude that, in average, being an immigrant increases the probability of being a minimum income support recipient between 0.57 and 0.61 percentage points, depending on the included control variables. Moreover, composition effects tend to decrease the probability of being a social aid recipient. More precisely, coefficients associated with the variable Immigrant are systematically larger in columns (2) and (4), where we use counterfactual weights so as to impose equal and constant demographic composition between immigrants and natives, with respect to columns (1) and (3), where we use standard weights. This reveals that the relative demographic composition of immigrants with respect to natives has evolved between 2003 and 2016 in such a way that has tended to decrease the probability of participation of immigrants in the welfare system. Columns (3)-(4) reveal that immigrants are in average 0.57-0.6 percentage points more likely than natives to be recipients of minimum income support. Furthermore, the year after the 2012 increase, the probability of being a welfare benefit recipient increased by 0.30-0.27 additional percentage points for immigrants.
Table 2: Probability of being a minimum income support recipient. Marginal effects (probit model). LFS 2003-2016.
Dependent variable: being a minimum income support recipient
(1) (2) (3) (4) Immigrant 0.00583*** 0.00610*** 0.00574*** 0.00604*** (0.000767) (0.000962) (0.000750) (0.000940) Immigrant·2007 -0.000417 -0.000652 (0.00148) (0.00159) Immigrant·2013 0.00306** 0.00275* (0.00127) (0.00145)
Control Yes Yes Yes Yes
Year FE Yes Yes Yes Yes
Department FE Yes Yes Yes Yes
Weights Standard Counterfactual Standard Counterfactual
Observations 1,164,557 1,156,664 1,164,557 1,156,664
Source: Labor Force surveys 2003-2016. Note: weighted probit estimation with robust standard errors clustered at the department level and weights provided by the LFS. Columns (1) and (3) apply stan-dard weights provided by the LFS, while columns (2) and (4) apply counterfactual weights to ensure that immigrants and natives have an identical and constant composition (equal to the 2003 immigrant composition) in terms of education, age, gender, civil status and children. Control variables include: gender, age, age squared, civil status, number of children, having an unemployed partner, diploma level (i.e. no diploma, BEPC only, BEPC-CAP and Baccalaureate, the reference category being more than Baccalaureate), residence duration in the host country for immigrants (<10 years and 10-25 years, more than 25 years being the excluded category), arrival cohort for immigrants (1970-1975, 1975-1980, 1980-1985, 1985-1990, 1990-1995, 1995-2000, 2000-2005, 2005-2017, where the excluded category is the cohort arriving before 1970). Significance levels are∗ ∗ ∗(p < 0.01), ∗ ∗ (p < 0.05) and ∗(p < 0.1).
All in all results from Figure 2 and Table 2 confirm that immigrants are more likely to be minimum income recipients than natives. This holds even when we control for both composition effects and returns to identical demographical characteristics. Furthermore, Table 2 reveals that after the discretionary increase in the minimum wage in 2012 the probability of being a minimum income recipient increased relatively more for immigrants. This did not happen after the discretionary increase in 2006. Finally, results from Figure 2 and Table 2 underline also the importance of controlling for demographical composition effects between 2003-2016 in order to correctly isolate the effect of minimum wage discretionary increases on the share of minimum income recipients.
4
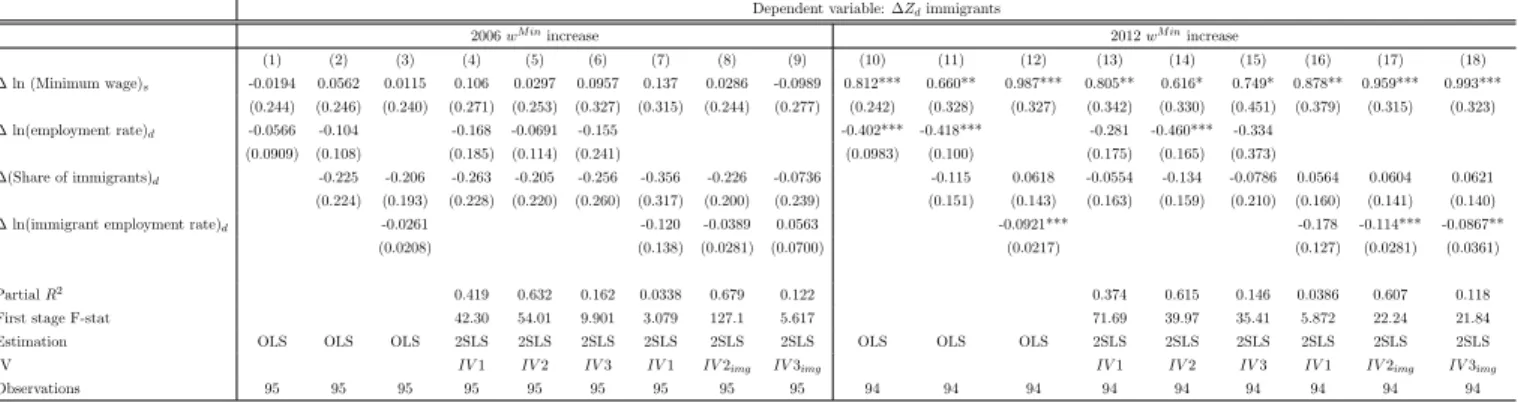
Results
Table 3 provides baseline estimations for equation (13). The first nine columns consider the vari-ation between one year before and one year after the 2006 increase in the minimum wage while columns (10)-(18) consider the variation between the year before and after the 2012 increase.18 Columns (1)-(3) and (10)-(12) present OLS estimates, while the other columns report 2SLS
esti-18
From 2012 there are no observations of minimum income recipients for department 48 in the LFS, which explains why the number of cells is reduced to 94.
mates. In all cases robust standard errors are clustered at the department level. In our benchmark estimation we define the log of the expected real minimum wage as the log of the interaction between the real minimum wage and the employment rate in the department (columns (1)-(2), (4)-(6), (10)-(11) and (13)-(15)). We alternatively consider the log of the expected immigrants’ real minimum wage resulting from the log of the interaction between the minimum wage and the department’s employment rate of immigrants (columns (3), (7)-(9), (12) and (16)-(18)). In every department we control by the change in the share of immigrants before and after the minimum wage increase.
We denote IV 1 the instrument defined as the variation in the log employment rate of workers earning above 1.1 times the minimum wage in department d. IV 2 stands for the variation in the log employment rate of all departments other than d. When considering the log employment rate of immigrants we will write IV 2img. IV 3 stands for the variation in the log employment rate of all departments other than d between 2004 and 2005 when considering the 2006 increase in the minimum wage and between 2010 and 2011 for the 2012 increase. When considering the employment rate of immigrants we denote it IV 3img.
As already remarked above, the discretionary 0.3 percentage points increase in the minimum wage in 2006 followed the progressive inclusion into the minimum wage of monthly guarantees associated with the adoption of the 35 weekly hours in France. This had induced a rise of 17.6% in the lowest hourly wage between 2003 and 2005. We believe this explains why there is no significant effect of either component of the expected wage (i.e. minimum wage and employment rate) on the proportion of immigrants receiving the minimum income support between the years before and after the 2006 increase (see columns (1)-(9)).19
19
If data on welfare recipients had been available before 2003 we could have computed the variation in the share of immigrant recipients between 2002 and 2007 so as to include the 2003-2005 period during which took place the progressive harmonization of various minimum wage components.
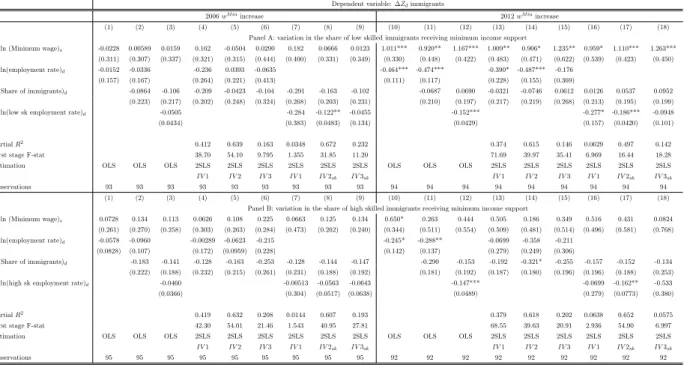
Table 3: Regression estimates: variation in the share of immigrants receiving minimum income support. LFS 2003-2016.
Dependent variable: ∆Zdimmigrants
2006 wM inincrease 2012 wM inincrease (1) (2) (3) (4) (5) (6) (7) (8) (9) (10) (11) (12) (13) (14) (15) (16) (17) (18) ∆ ln (Minimum wage)s -0.0194 0.0562 0.0115 0.106 0.0297 0.0957 0.137 0.0286 -0.0989 0.812*** 0.660** 0.987*** 0.805** 0.616* 0.749* 0.878** 0.959*** 0.993*** (0.244) (0.246) (0.240) (0.271) (0.253) (0.327) (0.315) (0.244) (0.277) (0.242) (0.328) (0.327) (0.342) (0.330) (0.451) (0.379) (0.315) (0.323) ∆ ln(employment rate)d -0.0566 -0.104 -0.168 -0.0691 -0.155 -0.402*** -0.418*** -0.281 -0.460*** -0.334 (0.0909) (0.108) (0.185) (0.114) (0.241) (0.0983) (0.100) (0.175) (0.165) (0.373) ∆(Share of immigrants)d -0.225 -0.206 -0.263 -0.205 -0.256 -0.356 -0.226 -0.0736 -0.115 0.0618 -0.0554 -0.134 -0.0786 0.0564 0.0604 0.0621 (0.224) (0.193) (0.228) (0.220) (0.260) (0.317) (0.200) (0.239) (0.151) (0.143) (0.163) (0.159) (0.210) (0.160) (0.141) (0.140)
∆ ln(immigrant employment rate)d -0.0261 -0.120 -0.0389 0.0563 -0.0921*** -0.178 -0.114*** -0.0867**
(0.0208) (0.138) (0.0281) (0.0700) (0.0217) (0.127) (0.0281) (0.0361)
Partial R2 0.419 0.632 0.162 0.0338 0.679 0.122 0.374 0.615 0.146 0.0386 0.607 0.118
First stage F-stat 42.30 54.01 9.901 3.079 127.1 5.617 71.69 39.97 35.41 5.872 22.24 21.84
Estimation OLS OLS OLS 2SLS 2SLS 2SLS 2SLS 2SLS 2SLS OLS OLS OLS 2SLS 2SLS 2SLS 2SLS 2SLS 2SLS
IV IV 1 IV 2 IV 3 IV 1 IV 2img IV 3img IV 1 IV 2 IV 3 IV 1 IV 2img IV 3img
Observations 95 95 95 95 95 95 95 95 95 94 94 94 94 94 94 94 94 94
Sources: French Labor Force Surveys (2003-2016). Notes: Dependent variable: change in share of immigrants in the department receiving minimum income support between the year before and after the minimum wage increase. The real minimum wage is determined at the national level. The employment rate of the department equals employment over working-age population. The immigrant employment rate is similarly defined but considering only immigrants. The share of immigrants stands for the proportion of immigrants over total population in the department. IV 1 is the variation in the log employment rate of workers earning above 1.1 times the minimum wage. IV 2 stands for the variation in the log employment rate of all departments other than d. When considering the log employment rate of immigrants we denote it IV 2img. IV 3 stands for the variation in the log employment rate of all departments other than d between 2004 and 2005 when considering the 2006 minimum wage increase and between 2010 and 2011 for the 2012 increase. When considering the employment rate of immigrants we denote it IV 3img. The partial R2refers to that developed in Shea (1997) and the first-stage F-statistics corresponds to the robust rank Wald F-statistics proposed by Kleibergen and Paap (2006). Robust standard errors clustered at the department
level in parentheses. Statistical significance:∗ ∗ ∗p < 0.01, ∗ ∗ p < 0.05, ∗p < 0.1.
We then focus on the 2012 increase. Column (10) presents the OLS estimation without any additional control variable. Column (11) includes the change in the share of immigrants living in the department as a control. Because the model is estimated in first differences all time-invariant department characteristics are already accounted for, implying that controlling for the change in the share of immigrants within the department allows us to control for the potential impact of time varying factors (i.e. unobservable events) that could have occurred between the year before and after the minimum wage increase and that affect work location choices of immigrants. Column (11) reveals that while the increase in the minimum wage induces a positive variation in the share of immigrants receiving minimum income support, a rise in the department employment rate significantly reduces it. In line with equation (11), the former effect captures the consequences of the decrease in labor demand following the increase in the minimum wage, i.e.∂G∂e ∂w∂Ge∂w∂nM inwM in >
0. The second captures rather the impact of the increased search effort induced by the improved earning prospects following the minimum wage increase, i.e.∂G∂e ∂w∂Gen < 0. This last impact is
stimulated by higher employment probabilities.
Instrumental variable estimations displayed in columns (13)-(15) tend to confirm this finding. Whatever the instrument we consider, the rise in the minimum wage continues to promote a significant increase in the share of welfare recipients (due to decreased employment prospects). The employment rate in the department keeps its negative impact, but is only significant when considering IV 2. Overall, the positive impact on the share of immigrants receiving welfare benefits induced by the decreased labor demand following a minimum wage increase overcomes the negative impact driven by the increased search effort promoted by the improvement in earning prospects, i.e.|∂G∂e ∂w∂Ge∂w∂nM inwM in| > |
∂G ∂e
∂G
instrument is relevant and the values of the robust first stage F-statistics reveal that the three instruments are strong and have a highly significant relation with the department’s employment rate.
In a second stage we consider the expected real minimum wage of immigrants, which results from the interaction between the real minimum wage and the immigrant employment rate in the department. As revealed by column (12), the change in the log minimum wage continues to induce a rise in the share of welfare beneficiaries among immigrants. In contrast, the variation in the immigrant employment rate negatively impacts this share. These results remain robust when considering the 2SLS estimation. When using the employment rate of workers earning more than 1.1 times the minimum wage as an instrument, we find a very low value for partial R2 and for robust first stage F-statistics pointing to the weakness of the instrument. In contrast, IV 2imgand
IV 3img arise as good instruments, with high partial R2 and robust first stage F-statistics above 20. For both cases, we still find that minimum wage increases foster a rise in the share of welfare benefit recipients among immigrants while increase in the immigrant’s employment rate reduce this share. The fact that coefficients from the OLS and 2SLS estimations remain fairly close, suggest that OLS results are not driven by endogeneity issues.
Table C.1 in Appendix C proposes an approach in the style of Giulietti (2014), where the explana-tory variable becomes the change in the log of the expected minimum wage. According to equation (9) a raise in wM in induces an increase in the expected wage if and only if the wage gains are not offset by the adverse employment effects. If the expected wage increases, search effort increases reducing unemployment and thus the share of minimum income support recipients. A negative correlation should then arise between the expected minimum wage and the share of welfare recip-ients. This prediction is confirmed by estimations in Table C.1. While between the period before and after the 2006 no significant impact of the expected wage arises, the situation is modified when considering the 2012 increase in the minimum wage. During this period, the increase in the expected wage induces a decrease in the share of immigrants receiving welfare benefits.
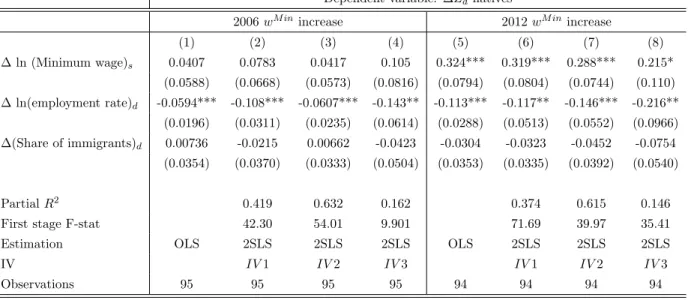
For comparison purposes Table 4 replicates baseline estimations of equation (13) but considers as a dependent variable the share of natives being minimum income support recipients. During the period before and after the 2006 minimum wage increase (columns (1)-(4)), the increase in the aggregate employment rate induced a significant decrease in the share of natives being welfare beneficiaries, suggesting that, in contrast with immigrants, the 2006 increase improved expected wages of natives, their search effort and promoted then a decrease in the share of welfare recipients reinforced by the higher employment probability of natives. This result is confirmed when using 2SLS estimations.
Columns (5)-(8) consider the 2012 increase. Results are in line with those obtained for immigrants, but coefficients are smaller. This is consistent with findings from our theoretical framework which predicts that for an identical increase in wM in the impact on immigrant employment will be more negative since immigrants have in average lower productivity than natives, yN > yI. 2 SLS