HAL Id: hal-02407512
https://hal.inria.fr/hal-02407512
Submitted on 15 Apr 2021HAL is a multi-disciplinary open access archive for the deposit and dissemination of sci-entific research documents, whether they are pub-lished or not. The documents may come from teaching and research institutions in France or abroad, or from public or private research centers.
L’archive ouverte pluridisciplinaire HAL, est destinée au dépôt et à la diffusion de documents scientifiques de niveau recherche, publiés ou non, émanant des établissements d’enseignement et de recherche français ou étrangers, des laboratoires publics ou privés.
Distributed under a Creative Commons Attribution| 4.0 International License
contribute to cell-size determination: evidence from a
computational model of tomato fruit
Valentina Baldazzi, Pierre Valsesia, Michel Génard, Nadia Bertin
To cite this version:
Valentina Baldazzi, Pierre Valsesia, Michel Génard, Nadia Bertin. Organ-wide and ploidy-dependent regulation both contribute to cell-size determination: evidence from a computational model of tomato fruit. Journal of Experimental Botany, Oxford University Press (OUP), 2019, 70 (21), pp.6215-6228. �10.1101/450916�. �hal-02407512�
Journal of Experimental Botany, Vol. 70, No. 21 pp. 6215–6228, 2019
doi:10.1093/jxb/erz398 Advance Access Publication August 31, 2019
This paper is available online free of all access charges (see https://academic.oup.com/jxb/pages/openaccess for further details)
© Society for Experimental Biology 2019.
This is an Open Access article distributed under the terms of the Creative Commons Attribution Non-Commercial License (http://creativecommons.org/licenses/ by-nc/4.0/), which permits non-commercial re-use, distribution, and reproduction in any medium, provided the original work is properly cited. For commercial re-use, please contact journals.permissions@oup.com
RESEARCH PAPER
Organ-wide and ploidy-dependent regulation both contribute
to cell-size determination: evidence from a computational
model of tomato fruit
Valentina Baldazzi1,2,3,*, , Pierre Valsesia1, Michel Génard1 and Nadia Bertin1
1 INRA, PSH, 228 route de l'Aerodrome, 84914 Avignon, France
2 Université Côte d'Azur, INRA, CNRS, ISA, 400 route des Chappes, 06903 Sophia-Antipolis, France
3 Université Côte d'Azur, Inria, INRA, CNRS, Sorbonne Université, BIOCORE, 2004 route des Lucioles, 06902 Sophia-Antipolis, France
* Correspondence: valentina.baldazzi@inra.fr
Received 15 January 2019; Editorial decision 30 July 2019; Accepted 1 August 2019 Editor: Christine Raines, University of Essex, UK
Abstract
The development of a new organ is the result of coordinated events of cell division and expansion, in strong inter-action with each other. This study presents a dynamic model of tomato fruit development that includes cell div-ision, endoreduplication, and expansion processes. The model is used to investigate the potential interactions among these developmental processes within the context of the neo-cellular theory. In particular, different control schemes (either cell-autonomous or organ-controlled) are tested and compared to experimental data from two contrasting genotypes. The model shows that a pure cell-autonomous control fails to reproduce the observed cell-size distribu-tion, and that an organ-wide control is required in order to get realistic cell-size variations. The model also supports the role of endoreduplication as an important determinant of the final cell size and suggests that a direct effect of endoreduplication on cell expansion is needed in order to obtain a significant correlation between size and ploidy, as observed in real data.
Keywords: Cell division, computational model, expansion, endoreduplication, development, tomato fruit.
Introduction
Understanding the mechanisms that underpin fruit develop-ment from its early stages is of primary importance for biology and agronomy. In particular, the early stages are highly sensitive to biotic and abiotic stresses, with important consequences on fruit set and yield. The development of a new organ is the re-sult of coordinated events of cell division and expansion. Fruit growth starts immediately after pollination with intensive cell division. As development proceeds, the proliferative activity of cells progressively slows down, giving way to a phase of pure cell enlargement during fruit growth and ripening. In many species, including tomato, the transition from cell division to
expansion phases is accompanied by repeated DNA duplica-tions without mitosis, a process called endoreduplication. The exact role of endoreduplication is still unclear. A significant correlation between cell ploidy (i.e. number of DNA copies) and cell size has been observed in different species, including tomato fruit, suggesting a possible role of endoreduplication in the control of organ growth Cheniclet et al., 2005; Breuer
et al., 2010; Chevalier et al., 2011). However, several studies have shown that under specific conditions the two processes can be uncoupled to some extent, so that ploidy is not the only determinant of cell size (Bertin, 2005; Cookson et al., 2006).
Understanding the way that the cell division, endoreduplication, and expansion processes interact is crucial for predicting the emergence of important morphological traits (fruit size, mass, shape, and texture) and their dependence on environmental and genetic factors. Historically, there has been a debate between two contrasting views, the cellular versus the organismal theory, that set the control of organ growth at the level of the individual cell or the whole tissue, respectively (reviewed in Beemster et al., 2003; Fleming, 2006; John and Qi, 2008). In recent years, a con-sensus view has emerged, namely the neo-cellular theory, which considers that although cells are the units of plant morphology, their behavior (division, expansion) is not autonomous, but is coordinated at the organ level by cell-to-cell communication mechanisms (Beemster et al., 2003; Tsukaya, 2003; Sablowski and Carnier Dornelas, 2014). The existence of non-autonomous cell control of organ development has been demonstrated in Arabidopsis leaves (Kawade et al., 2010) but the underlying modes of action remain unclear and are often species- or organ-specific (Ferjani et al., 2007; Horiguchi and Tsukaya, 2011; Norman et al., 2011; Han et al., 2014; Okello et al., 2015).
Computational models offer a unique tool to express and test biological hypotheses in a well-defined and controlled manner, and perhaps not surprisingly they have been used ex-tensively to investigate the relationships between organ devel-opment and the underlying cellular processes. Many studies have addressed the question of organogenesis, relating local morphogenetic rules and cell mechanical properties with the emerging patterns near the meristem (Dupuy et al., 2010; Robinson et al., 2011; Kuchen et al., 2012; Lucas et al., 2013; Boudon et al., 2015; Löfke et al., 2015; von Wangenheim et al., 2016). At the tissue scale, a few models have addressed the issue of cell size variance based on observed kinematic patterns of cell division or growth rates, with particular attention being paid to the intrinsic stochasticity of processes related to the cell cycle (Roeder et al., 2010; Asl et al., 2011; Kawade and Tsukaya, 2017). In most of these models, cell expansion is simply de-scribed via an average growth rate, possibly modulated by the ploidy level of the cell, without any reference to the underlying molecular mechanisms or to the environmental conditions.
To our knowledge, very few attempts have been made to explicitly model the interactions among cell division, ex-pansion, and endoreduplication at the scale of organ devel-opment. Fanwoua et al. (2013) proposed a model of tomato fruit development that integrates cell division, expansion, and endoreduplication processes based on a set of biologically in-spired rules. The fruit is described by a set of q classes of cells with the same age, ploidy, and mass. Within each class, cell div-ision and endoreduplication are described as discrete events that take place within a well-defined window of time when-ever a specific mass-to-ploidy threshold is reached. Cell growth in dry mass is modeled following a source–sink approach as a function of thermal time, cell ploidy, and external resources. The model is able to qualitatively capture the effect of envir-onmental conditions (temperature, fruit load) on the final fruit dry mass, but hypotheses and parameters are hard to validate as comparisons to experimental data are lacking. Moreover, the water content of the cell is not considered, preventing the ana-lysis of cell volumes.
Baldazzi et al. (2012, 2013) have developed an integrated model of tomato fruit development that explicitly accounts for the dynamics of cell proliferation as well as for the mech-anisms of cell expansion, in both dry and fresh mass, based on biophysical and thermodynamical principles. In this present study, a new version of this model is proposed that includes cell endoreduplication. The model is used to investigate different hypotheses concerning the regulation and the interaction among cellular processes, with special attention being paid to the importance of an organ-wide regulation on cell growth and on the potential effect of endoreduplication on cell expansion. We focus on wild-type organ development and we examine the effects of organ-wide or cell ploidy-dependent regula-tion on the dynamics of cell expansion. To this end, different control schemes (either cell-autonomous or organ-controlled, with or without a ploidy effect on cell expansion) are tested
in silico by means of specific model variants. Simulation results
are analysed and compared to cell-size distributions observed in the fruit pericarp of two contrasting genotypes, a cherry to-mato and a large-fruited variety.
The model shows that a pure cell-autonomous control cannot reproduce the experimental cell-size distribution, and organ-wide and ploidy-dependent controls are required in order to obtain realistic cell sizes. In particular, a direct effect of endoreduplication on cell expansion is needed in order to obtain a significant correlation between size and ploidy, as ob-served in real data.
Materials and methods
Experimental dataTwo datasets were collected from two glasshouse experiments per-formed at INRA Avignon (southern France) in 2004 and 2007 on large-fruited (cv Levovil) and cherry (cv. Cervil) tomato genotypes of Solanum
lycospersicum L.
In the 2004 experiment fruit were collected from April to May (plan-ting in February) whereas in 2007 the fruit were sampled from October to December (planting in August). Plants were grown according to standard cultural practices. Trusses were pruned in order to homogenize truss size along the stem within each genotype. The maximum number of flowers left on each inflorescence was 12 for Cervil and six for Levovil. Flowers were pollinated by bumblebees. Air temperature and humidity were recorded hourly in each experiment and input in the model as external signals.
In both experiments, flower buds and fruit were sampled at different time-points relative to the time of flower anthesis (full-flower opening). Fruit fresh and dry mass and pericarp fresh mass were systematically measured at all time-points. Pericarp dry mass was estimated by assuming a dry mass content equivalent to that of the whole fruit.
In 2004, half of the fruit pericarps were then analysed by flow cytometry and the other half were used for the determination of cell number. The number of pericarp cells was measured after tissue dissociation according
to a method adapted from that of Bünger-Kibler and Bangerth (1982)
and detailed in Bertin et al. (2003). Cells were counted in aliquots of
a cell suspension under an optical microscope using Fuchs–Rosenthal chambers and Bürker chambers for the large and small fruit, respectively. Six to eight aliquots per fruit were observed and the cell number for the whole pericarp was calculated according to the dilution and obser-vation volumes. Ploidy was measured in the pericarp tissue as described in Bertin et al. (2007). The mean value of up to three measurements per fruit (sometimes restricted by the fruit size) was included in the analysis.
In the 2007 experiment, the dynamics of cell number (but not endoreduplication) were measured following the same method as in the 2004 experiment. In addition, cell-size distributions (smallest and largest
radii and 2D-surface) in the cell suspension aliquots were measured using
the ImageJ software (https://imagej.nih.gov/ij/). Samples of ~20–25
cells per fruit pericarp were measured randomly for several different fruit. Cell-size distributions were measured on ripe fruit at ~43 d after anthesis (DAA) for Cervil and 60 DAA for Levovil.
Model description
The model is composed of two interacting modules, both originating
from previously published models (Fishman and Génard, 1998; Bertin
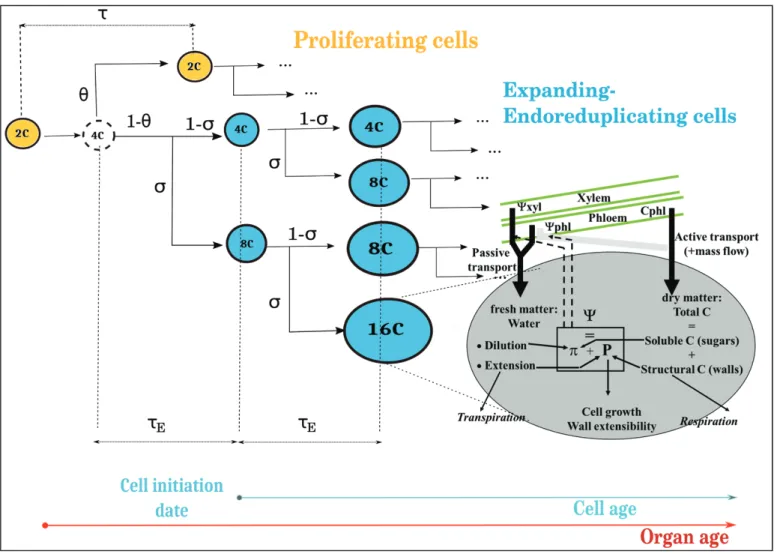
et al., 2007; Liu et al., 2007). The fruit is described as a collection of cell populations, each one having a specific age, ploidy, and volume, which evolve and grow over time during fruit development. Two cell classes are defined: the proliferating cells and the expanding-endoreduplicating cells (Fig. 1). The division–endoreduplication module governs the evolution of the number of cells in each of the classes, their age (initiation date), and
ploidy level based on genotype-specific parameters (Bertin et al., 2007).
At each mitotic cycle, a fraction of proliferating cells proceeds through division whilst the remaining ones enter the expansion phase: a new group of expanding cells is created, together with an array of sub-classes of possible ploidy levels p. At initialization of the group, all expanding cells are put into the 4C level.
It is assumed that the onset of endoreduplication coincides with the beginning of the expansion phase. As the endocycles proceed, in each group of expanding cells a fraction σ of the cells increases its ploidy level
p by a factor 2 and the distribution of cells across the different ploidy
levels is updated.
At any time, the mass (both fresh and dry components) of expanding cells is computed by a biophysical expansion module according to charac-teristics of the cell (age, ploidy) and depending on available resources and
environmental conditions (Fishman and Génard, 1998; Liu et al., 2007).
Briefly, cell expansion is described by iteratively solving the Lockhart equation that relates the rate of volume increase to the internal pressure
and mechanical properties of the cell (Lockhart, 1965). Flows of water
and solutes across the membrane are described by thermodynamic equa-tions and depend on environmental condiequa-tions. The relative importance of each transport process may vary according to the fruit developmental stage, depending on specific developmental control. A full description of
the model equations can be found in Supplementary Protocol S2 at JXB
online.
The model assumes that all cells have equal access to external resources, independently from the number of cells (i.e. no competition). All the parameters of the division-endoreduplication module are considered to be independent from environmental conditions for the time being.
Fig. 1. Scheme of the integrated model. The fruit is described as a collection of cell populations, each one having a specific age, ploidy, and volume. Cells can be either proliferating or expanding-endoreduplicating. The number of cells in each class is predicted by the division-endoreduplication module, assuming a progressive decline of the proliferating activity of the cells. Expanding cells grow according to the expansion module, which provides a biophysical description of the main processes involved in carbon and water accumulation. It is assumed that the onset of endoreduplication coincides with the beginning of the expansion phase. Two timescales are recognizable in the model: the organ age, i.e. the time since the beginning of the simulation; and the cell age, i.e. the time since the cell left the mitotic cycle and entered the expansion-endoreduplication phase. Depending on the model variant, cell expansion may be modulated by organ age (organ-wide control) and/or by cell ploidy. (This figure is available in colour at JXB online.)
Model initialization and input
The model starts at the end of the pure division phase, when the proliferative
activity of the cells declines and the expansion phase begins (Baldazzi et al.,
2013). For the Cervil (cherry) genotype this corresponds to ~8 d before
anthesis and to 3 d before anthesis for the Levovil (large-fruited) genotype (Bertin et al., 2007). The initial number of cells for the 2007 experiment,
n0, was estimated as 3.3×10³ for Cervil and as 4.6×10⁴ for Levovil, based
on a few measurements. At the beginning of the simulation, all cells are presumed to be proliferating with a ploidy level of 2C (a transient ploidy of 4C during the cell cycle is not considered here). Proliferating cells are
presumed to have a constant cell mass equal to the initial value, m0, as often
observed in meristematic cells (homogeneity in cell size) (Sablowski and
Carnier Dornelas, 2014; Serrano-Mislata et al., 2015).
The initial mass of the fruit is therefore Mfruit(0) = n0m0 = n0(w0+s0),
where w0 and s0 are initial cell water and dry mass, respectively. At any
time, cells leaving the proliferative phase start to grow, from an initial mass
2m0 and a ploidy level of 4C, according to the expansion model.
Cell expansion depends on environmental conditions and on re-sources provided by the mother plant. The phloem sugar concentration is assumed to vary daily between 0.15 M and 0.35 M whilst the stem water potential oscillates between –0.05 MPa and –0.6 MPa, i.e. typical pre-dawn and minimal stem water potentials as measured for the two genotypes. Temperature and humidity are provided directly by real-time recording of greenhouse climatic conditions.
Choice of the model variants: control of cell expansion capabilities
In the integrated model, a number of time-dependent functions account for the developmental regulation of cell metabolism and physical
prop-erties during the expansion phase (Liu et al., 2007; Baldazzi et al. 2013).
Two characteristic time-scales are recognizable in the model: the cell age, i.e. the time spent since an individual cell has left the proliferative phase; and organ age, i.e. the time spent since the beginning of the simulation (Fig. 1). Depending on the settings of the corresponding time-dependent functions, different cellular processes may be put under cell-autonomous or non- autonomous control (hereafter termed as organ-wide control), allowing for an in silico exploration of alternative control hypotheses in the context of the cellular and organismal theories. Moreover, a direct effect of cell DNA content on cell expansion capabilities may be tested
according to biological evidence (Sugimoto-Shirasu and Roberts, 2003;
Chevalier et al., 2011; Edgar et al., 2014).
As a default, all cellular processes are presumed to depend on cell age (cell-autonomous control) with the only exception of cell transpiration, which is computed at the organ scale on the basis of fruit external surface and skin conductance, and then distributed back to individual cells
pro-portionally to their relative water content (see Supplementary Protocol
S2 for a full description of the integrated model).
Based on literature information and on preliminary tests (Baldazzi
et al., 2013, 2017), the switch between symplastic and apoplastic transport,
λp, has been selected as the candidate process for an organ-wide control.
Indeed, intercellular movement of macromolecules across plasmodesmata
has been shown to be restricted by organ age in tobacco leaves (Crawford
and Zambryski, 2001; Zambryski, 2004) and it is known to be important
for cell-to-cell communication (Han et al., 2014).
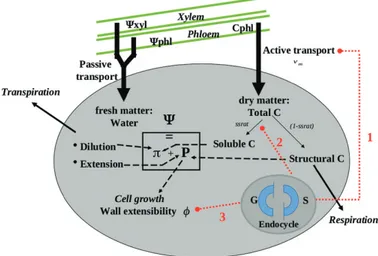
The exact mechanisms by which cell DNA content may affect cell ex-pansion currently remain unknown. Based on literature information and common sense, three distinct mechanisms of action of endoreduplication on
cell expansion were hypothesized and tested by means of the model (Fig. 2).
(1) Endoreduplication has been often associated with elevated protein
synthesis and transcriptional activity (Chevalier et al., 2014), suggesting a
general activation of the nuclear and metabolic machinery of the cell to
sustain cell growth (Sugimoto-Shirasu and Roberts, 2003). Given these
facts, a first hypothesis assumes an effect of endoreduplication on cell
ex-pansion as a ploidy-dependent maximal import rate for carbon uptake (νm).
For the sake of simplicity, and in the absence of any information, the rela-tionship was presumed to be linear across the number of endocycles. The
corresponding equation, as a function of the cell DNA content (DNAc; 2
for dividing cells, 4 to 512 for endoreduplicating cells), was as follows:
νm= v0log2(DNAc)
where ν0 is the mean carbon uptake activity per unit mass.
(2) Assuming that cell shape remains the same with increasing ploidy, endoreduplicating cells are characterized by a reduced surface-to-volume
ratio with respect to 2C cells (Schoenfelder and Fox, 2015). As a
conse-quence, it is tempting to suppose that one possible advantage of a high ploidy level may reside in a reduction of carbon demand for cell wall
and structural units (Barow, 2006; Pirrello et al., 2018). We speculated
that such an economy may affect cell expansion capabilities in two ways. First, the metabolic machinery could be redirected towards the synthesis of soluble components, thus contributing to the increase of cell internal pressure and consequent volume expansion.
In the original expansion model, the ssrat fraction of soluble com-pound within the cell is developmentally regulated by the age, t, of
the cell (Baldazzi et al. 2013): at early stages a large fraction of carbon
is devoted to the synthesis of structural components (proteins, lipids, and wall components), reducing the quantity of carbon available
for osmotic regulation (Carrari et al., 2006, Colombié et al., 2014).
Accordingly, the ssrat fraction is an increasing function of time, up to
a maximal value (bssrat).
ssrat = bssrat 1 − e−assratt + ssrat0
In the presence of a ploidy effect, the final bssrat value was further
increased as:
bssrat= b0ssratlog2(DNAc)
(3) Second, ‘exceeding' carbon may be used to increase the rate of cell wall synthesis or that of related proteins, possibly resulting in an increase
of cell wall extensibility as it has been shown in other systems (Proseus
and Boyer, 2006, Jégu et al., 2013).
In the original expansion model of tomato (Liu et al., 2007), cell wall
extensibility, ϕ, declines during cell maturation (Proseus et al., 1999)
as the result of changes in the expression of cell wall-related enzymes (Thompson et al., 1998; Cosgrove, 2016):
φ = φmin+(φ1 + emax− φmink(t−t0))
where ϕmin and ϕmax are the minimal and the maximal cell wall
extensi-bility, respectively, and k is the time-constant of ϕ relaxation above time t0.
In the presence of a ploidy effect, the maximal cell wall extensibility was increased as:
Fig. 2. Schematic representation of the three hypothetical mechanisms of interaction between cell ploidy and cell expansion. (1) Cell ploidy may affect the carbon uptake rate. (2) Ploidy may increase the fraction of soluble components in the cell, thus increasing the osmotic potential. (3) Ploidy may affect cell wall extensibility. (This figure is available in colour at JXB online.)
φmax= φ0maxlog2(DNAc)
The individual and combined effects of organ-wide and ploidy-dependent control of cell expansion were investigated and compared to a full cell-autonomous model. A total of 10 model variants were tested
for each genotype, following the experimental design shown in Table 1.
Model calibration
Calibration was performed using a genetic algorithm in the R software
(library ‘genalg'; https://CRAN.R-project.org/package=genalg). Due
to data limitations, a three-step procedure was used for each tomato genotype.
First, the division-endoreduplication module (seven parameters) was calibrated with data from the 2004 experiment by comparing measured and simulated values of the total pericarp cell number and the propor-tion of cells in different ploidy classes throughout fruit development. In particular, this allowed the estimation of the mean duration of the
endocycle (τE) and the proportion (σ) of the cells performing a new
endoreduplication round within every period τE.
The best-fitting values of σ and τE were selected and kept fixed for
the second phase of the calibration, assuming that they have little
de-pendence on environmental conditions (Bertin, 2005). The dynamics of
cell division (five parameters) were then re-estimated using cell num-bers measured in the 2007 experiment, in order to account for
environ-mental regulation of the mitotic cell cycle (see Supplementary Protocol
S3). The best-fitting parameters were selected and used for the third and
final calibration step.
The expansion module was calibrated using the evolution of pericarp fresh and dry mass from the 2007 experiment, for which cell size distri-butions were available. However, it should be noted that data for meas-ured cell sizes were not used for the fitting process.
Six parameters were selected for calibration based on a previous
sensi-tivity analysis (Constantinescu et al., 2016), whilst the others were fixed to
the original values (Fishman and Génard, 1998; Liu et al., 2007; Baldazzi
et al., 2013). An additional parameter was estimated for model variants
M3–M24 (Table 1) in order to correctly evaluate the strength of the
ploidy-dependent control (see Supplementary Protocol S3 for more
information).
Due to their different structures, the expansion module was calibrated independently for each model variant. The quality of model adjustment was evaluated using a normalized root mean-square error (NRMSE):
NRMSE (x) = 100 » 1 n [Oi− Si(x)] 2 1 n Oi
where Oi and Si are, respectively, the observed and simulated values
of pericarp fresh or dry mass, and n is the number of observations.
x = {x1,x2…xp} is the parameter set of the evaluated solution. The smaller
the NRMSE the better the goodness-of-fit. Generally, NRMSE<20% is considered good, 20%<NRMSE<30% is considered fair, and values over 30% are considered poor.
Between three and five estimations were performed for each model variant and genotype.
Solution selection and model comparisons
For each calibration solution, the corresponding cell-size distribution at fruit maturity (i.e. 43 DAA for Cervil, 60 DAA for Levovil) was predicted by the model and compared to the measured data.
A semi-quantitative comparison approach was used due to the limited experimental information available: the general distribution character-istics (shape, positioning, and dispersion) were characterized rather than having a ‘perfect fit'. To this end, eight descriptive statistical indicators,
m(i), were computed for each solution and compared to those derived
from real-data distribution, namely: skewness and kurtosis (shape of dis-tribution); mean and median cell size (positioning); standard deviation (SD) and median absolute deviation (MAD) (data dispersion); and max-imal and minmax-imal cell size (data dispersion). Confidence intervals (CI, 95%) for the experimental distribution indicators were estimated using a Bootstrap approach on 10 000 samples.
Based on the scores for these indicators, the distance, D, between the predicted and the observed distribution was quantified as the Euclidean distance between each indicator m(i) and its corresponding measured value, weighted by the amplitude of the confidence interval (DeltaCI) of the indicator itself:
D =
8
i=1[mmodel(i)− mdata(i)]2 DeltaCI (i)
For each model variant, the selection of the best calibration solution was performed based on a compromise between quality of the fit at the whole-fruit scale (as measured by the total NRMSE) and quality of the
cor-responding cell-size distribution (as measured by D; see Supplementary
Protocol S3). Estimated parameters for the retained solution are given in
Tables S3 and S4 of Supplementary Protocol S3.
In order to compare the distributions issued from the different models, a principal component analysis (PCA) was performed on the eight de-scriptors of cell distribution arising from each model estimation. The
‘ade4' library of the R software was used for this purpose (https://
CRAN.R-project.org/package=ade4).
Results
A characteristic right-tailed distribution of cell areas
The distribution of cell sizes at a given stage of fruit devel-opment directly depends on the particular cell division and expansion patterns followed by the organ up to the time in question. Any change in the cell division or expansion rate will have a consequence on the shape and position of the resulting distribution.
For both the tomato genotypes considered in this study, the distribution of pericarp cell areas at the mature stage showed a typical right-tailed shape (Fig. 3), compatible with a Weibull or a Gamma distribution (Supplementary Protocol S1). The observed cell sizes spanned up to two orders of magnitude, with cell areas (cross-section) ranging from 0.004 mm to 0.08 mm2 for the cherry Cervil genotype and from 0.005 mm
to 0.28 mm2 for the large-fruited Levovil (Tables 2, 3). The
mean cell area was calculated to be 0.026 mm2 for the cherry
genotype and 0.074 mm2 for the large-fruited genotype, and
these values are in agreement with data from other tomato Table 1. Experimental design showing the characteristics of the
10 model variants tested in the study Model
variant
Organ control Endoreduplication effect Symplastic transport Active C uptake C allocation Wall plasticity M0 M1 ✓ M2 ✓ ✓ M3 ✓ ✓ M4 ✓ ✓ M5 ✓ M6 ✓ M7 ✓ M23 ✓ ✓ ✓ M24 ✓ ✓ ✓
varieties (Bertin, 2005; Renaudin et al., 2017). Data dispersion was higher for the large-fruited genotype, but the shape of the distribution, as measured by its skewness and kurtosis values, was pretty similar for both varieties.
In the following sections, the effects of specific control mech-anisms on the predicted cell area distribution are analysed in detail, based on the results obtained for the selected calibration solu-tion (see ‘Solusolu-tion selecsolu-tion' in the Methods). The corresponding Fig. 3. (A) Schematic representation of the experimental procedure for estimation of cell size. About half of the fruit pericarp was subjected to tissue dissociation. Cells were divided into different aliquots and spotted onto clean glass slides before examination under a microscope. Images were captured with a digital camera and analysed using the ImageJ software. (B, C) Measured cell-size distributions at fruit maturity, for (B) the Cervil cherry tomato genotype, and (C) the Levovil large-fruited genotype. (This figure is available in colour at JXB online.)
Table 2. Statistical descriptors for the measured and predicted cell area distributions for the cherry tomato Cervil genotype
Model Fruit mass Cell distribution
Fit quality Shape Positioning Dispersion
NRMSE FM NRMSE DM Skewness Kurtosis Mean Median Min. Max. SD MAD
Experimental data (CI 95%) 0.97 (0.63–1.34) 3.13 (2.3–4.4) 0.026 (0.023–0.030) 0.019 (0.016-0.025) 0.0039 (–) 0.08 (> 0.069–0.08) 0.019 (0.017–0.022) 0.016 (0.013–0.023) M0 29.46 25.06 0.05 1.9 0.025 0.025 0.024 0.026 0.0003 0.0003 M1 28.53 24.40 1.21 4.2 0.025 0.024 0.023 0.027 0.0008 0.0005 M2 29.44 25.65 1.66 11.4 0.023 0.023 0.016 0.13 0.005 0.004 M3 22.45 22.36 3.5 18 0.022 0.020 0.017 0.059 0.006 0.002 M4 24.86 24.29 0.59 3.8 0.022 0.022 0.019 0.031 0.0015 0.0014 M5 31.13 26.36 1.48 9.2 0.024 0.022 0.017 0.11 0.004 0.004 M6 25.57 24.66 –0.46 5.4 0.023 0.023 0.017 0.027 0.0006 0.0006 M7 27.0 25.07 0.42 3.16 0.023 0.023 0.019 0.038 0.0019 0.0019 M23 22.93 22.50 2.48 13.8 0.022 0.021 0.012 0.12 0.007 0.004 M24 25.72 24.90 1.44 7.3 0.022 0.022 0.012 0.14 0.006 0.005
NRMSE, normalized root mean-square; FM of pericarp, fresh mass; DM, dry mass of pericarp; MAD, median absolute deviation; CI, confidence interval. Dark shading indicates satisfactory agreement with the experimental data (i.e. NRMSE<25 and moment values within the CI of the experimental measurements) and light shading indicates partial agreement (NRMSE between 25–30, moment values near the limit of the CI).
statistical descriptors are given in Tables 2 and 3 for the Cervil and Levovil genotypes, respectively. Note that the predicted minimal cell sizes for Levovil were systematically lower than experimental measurements and corresponded to the size of proliferating cells (assumed to be constant in the present version of the model).
A simple cell-autonomous control scheme leads to unrealistic cell-size distribution
As a benchmark model, we first considered the case of a simple cell-autonomous control without a ploidy-dependent effect (variant M0 of the model; Table 1). Accordingly, two cells with the same age, even if initiated at different fruit developmental stages, behave identically in respect to carbon metabolism, transport, and wall mechanical properties. In this scheme, therefore, cell-size variations are derived exclusively from the dynamics of cell division, which cause a shift in the initiation date for different cohorts of cells. When applied to our geno-types, the cell-autonomous model was able to reproduce the observed pericarp mass dynamics but the corresponding cell-size distribution was extremely narrow (Tables 2, 3).
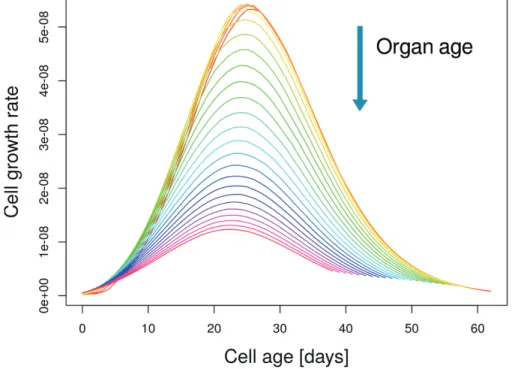
Including an organ-wide mechanism that controls cell size (model M1) introduced a source of variance among cells. In this case, two cells of the same age that were initiated at different fruit stages do not behave identically, resulting in different expansion capabilities and growth patterns (Fig. 4; Baldazzi et al., 2013). As a result, standard deviation doubled and skewness increased to-wards small positive values, indicating a slightly right-tailed cell-size distribution, both for the cherry and large-fruited genotypes (Tables 2, 3). However, the maximum cell size predicted by the model remained much smaller than expected, suggesting that a mechanism controlling cell expansion was lacking in the model.
Endoreduplication and cell growth: possible action and genotypic effects
The suggestion that nuclear ploidy level may be important for control of cell size has often been reported in the literature.
However, the molecular mechanism by which ploidy could modulate the expansion capacity of the cell remains elusive. In our study, three cell properties were selected as possible targets of ploidy-dependent modulation: the maximum carbon up-take rate; carbon allocation between soluble and non-soluble compounds; and cell wall plasticity (see Methods). These three hypotheses were tested on both genotypes, in combination or not with an organ-wide control.
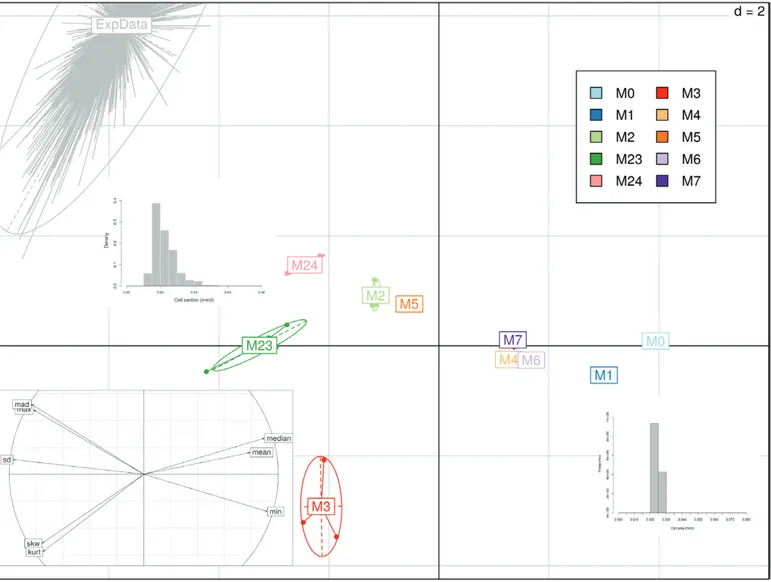
A principal component analysis was performed on eight statis-tical descriptors of cell-size distribution in order to compare the predictions of the different models (see Methods and Tables 2, 3). For both genotypes, the first two principal components explained ~90% of the observed variance (Figs 5, 6). Separation was mainly performed by the first principal component on the basis of the width of the distribution (SD, MAD, and maximal cell size) in one direction, and its mean and median values in the other direction.
As already noted, the model with simple cell-autonomous control was characterized by narrow distributions that were centered around a larger mean (and median) value. The add-ition of an organ or ploidy effect on cell expansion resulted in an increase in cell-size variance and skewness, shifting the distribution towards the right-tailed shape of the observed data (Tables 2, 3). Models combining an organ-wide and a ploidy-dependent control were closer to the experimental data, al-though they could not fully match the observed distribution in the case of the cherry tomato genotype.
When analysed in detail, the results showed that the rela-tive importance of the organ-wide and the ploidy-dependent control of cell expansion was genotype-dependent. In the case of Levovil, organ-wide control turned out to be the major regulatory mode. With the exception of M7, all the models without organ-control (M0, M5, M6) completely failed to re-produce the observations, resulting in very narrow and left-tailed cell-size distributions. Organ-wide coordination of cell expansion appeared to be the main factor responsible for posi-tive skewness of cell-size distribution whilst the addition of an endoreduplication-mediated modulation of cell expansion Table 3. Statistical descriptors for the measured and predicted cell area distribution for the large-fruited tomato Levovil genotype
Model Fruit mass Cell distribution
Fit quality Shape Positioning Dispersion
NRMSE FM NRMSE DM Skewness Kurtosis Mean Median Min Max Sd MAD
Experimental data (CI 95%) (red only) 0.97 (0.60–1.42) 3.15 (2.25–4.8) 0.094 (0.079–0.11) 0.082 (0.059–0.092) 0.008 (–) 0.29 (0.23–0.29) 0.072 (0.061–0.085) 0.058 (0.041–0.092) M0 30.04 34.38 –2.47 9.14 0.075 0.082 0.00049 0.085 0.016 0.005 M1 25.07 28.59 0.76 3.37 0.065 0.058 0.00049 0.15 0.032 0.022 M2 24.02 30.21 1.02 4.19 0.062 0.055 0.00049 0.31 0.040 0.021 M3 23.65 24.75 1.8 7.05 0.059 0.050 0.00049 0.21 0.033 0.018 M4 25.35 29.67 0.78 3.9 0.066 0.062 0.00049 0.19 0.032 0.027 M5 31.06 35.58 2.4 8.58 0.072 0.078 0.00049 0.090 0.016 0.006 M6 30.39 33.64 –2.48 9.14 0.071 0.078 0.00049 0.081 0.016 0.005 M7 31.40 35.80 0.61 3.38 0.068 0.062 0.00049 0.17 0.032 0.026 M23 24.51 27.48 0.99 4.47 0.062 0.056 0.00049 0.22 0.033 0.030 M24 24.83 30.93 6.65 77.54 0.056 0.038 0.00049 1.1 0.064 0.022
NRMSE, normalized root mean-square; FM of pericarp, fresh mass; DM, dry mass of pericarp; MAD, median absolute deviation; CI, confidence interval. Dark shading indicates satisfactory agreement with the experimental data (i.e. NRMSE<25 and statistical indicators within the CI of the experimental measurements) and light shading indicates partial agreement (NRMSE between 25–30, moment values near the limit of the CI).
capabilities on its own resulted only in a marginal improve-ment of the performance of the models.
The relative roles of ploidy-dependent and organ-wide control of cell growth appeared more balanced in the cherry tomato Cervil. Models including an organ-wide (M1) or a ploidy-mediated control of cell expansion (M5–M7) both re-sulted in very narrow and quite symmetric distributions. The concomitant action of both control mechanisms was needed in order to get the expected right-tailed distribution and realistic cell size variations (models M2–M4, M23, and M24). The two mechanisms thus seemed to act in synergy to increase cell ex-pansion and final cell size.
A direct influence of endoreduplication on cell
expansion is needed to produce a correlation between cell size and ploidy
A strong correlation has been often reported between cell size and ploidy level. This may be partly innate to the temporal evolution of endoreduplication, as cells with a high ploidy have necessarily had more time to growth without being halved by cell division. On this basis, some authors have claimed that the observed correlation between size and ploidy is just a matter of time and that there is no need to invoke any direct effect of endoreduplication on cell growth to explain the data (Roeder
et al., 2010; Robinson et al., 2018).
We checked this intuitive view with the help of our mod-elling framework. A linear regression analysis between cell size and DNA content at fruit maturity was performed for all our models and the results are shown in Table S5 in Supplementary Protocol S4).
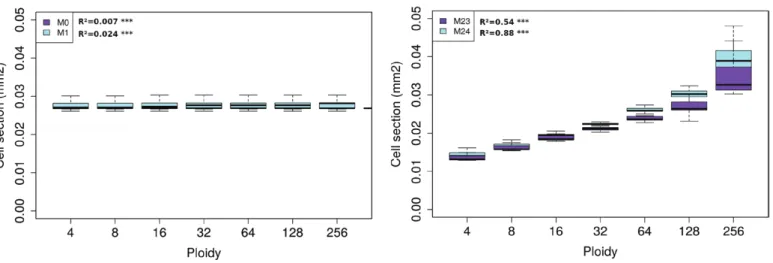
For both genotypes, no correlations were found for models M0 and M1 (Figs 7, 8) due to the asynchrony in the cell
division and endoreduplication patterns. Indeed, cells can attain the same ploidy level following different temporal sequences of expansion and endocycle events, leading to a large variability of possible cell sizes and ages within the same ploidy class. As long as ploidy level and growth rate are independent (as in models M0 and M1), the specific endoreduplication pattern has no consequence on the final cell size: variations in cell sizes simply reflect variations in cell ages and no correlation is found, on average, between the ploidy and size.
A direct effect of ploidy on cell expansion rate was needed in order to get a non-zero correlation between ploidy and size in our model (Figs 7, 8, right panels). In particular, models in which the ploidy level affected the carbon import rate (M2, M5, M23, M24) led to a significant positive correlation be-tween ploidy and size (P<0.001) for both genotypes (Table S5, Supplementary Protocol S4). In these models, the observed increase in cell size with increasing ploidy level was directly linked to enhanced cell expansion capabilities, and significant correlations were found between ploidy and maximal cell growth rate (Table S6, Supplementary Protocol S4).
Interestingly, the heterogeneity in cell sizes increased with increasing ploidy (Levene test on size variance, P <0.001), which was in agreement with previous observations in another tomato variety (Bourdon et al., 2011). Cell size variations were larger for Levovil than for Cervil due to its extended division phase, which increased the variability in the timing of exit from the mitotic phase (Fig.7, right panel).
Discussion
We have described an integrated cell division–expansion model that explicitly accounts for DNA endoreduplication, Fig. 4. Effect of an organ-wide control on the cell growth rate. Cells that enter the expansion phase late during organ development (i.e. greater organ age) have a lower growth rate due to the progressive reduction of the symplastic carbon transport. The simulations were obtained with model M1 (Table 1) applied to the large-fruited Levovil genotype. (This figure is available in colour at JXB online.)
an important mechanism in tomato fruit development. The model is used to investigate the interactions among cell div-ision, endoreduplication, and expansion processes within the framework of the neo-cellular theory (Beemster et al., 2003).
To this end, 10 model variants with or without a ploidy-dependent and an organ-wide control of cell development (Table 1) were tested and compared to data from two con-trasting tomato genotypes. Specific cellular processes were hy-pothesized as possible targets of both modes of control, based on information from the literature (Fig. 2). It is important to stress that the molecular basis of the presumed forms of regu-lation are not described in the model and they could involve many molecular players, such as hormones and mechanical sig-nals. Moreover, the existence of other targets for organ-wide or ploidy-dependent regulation cannot be excluded, and nei-ther can the contribution of onei-ther mechanisms to the con-trol of cell growth. The objective of the study was thus not to identify the exact mechanism of the interaction between endoreduplication and expansion, but rather to test if a direct influence of ploidy on cell expansion, either in combination or
not with an organ-wide control, was likely to be involved in the control of fruit growth.
Our model simulations showed that a pure cell-autonomous control was unable to reproduce the observed cell-size distri-bution (Fig. 3), and instead resulted in very narrow distridistri-butions that were considerably different from the expected skewed, right-tailed shape (Tables 2, 3). In agreement with the neo-cellular theory, the models supported the need for an organ-wide control of cell growth as a key mechanism to increase cell size variance, and pointed to a direct effect of ploidy on cell expansion potential.
Measurement of cell size distribution: a promising approach to understand the control of fruit growth
Our study was based on the analysis of cell-size distribution as a footprint of different control schemes. The NRMSE values of our results with respect to the pericarp fresh and dry mass data were always between 20% and 30% and this was independent of the model variant and the tomato genotype (Tables 2, 3), indicating a satisfactory agreement with the observed data. This highlights the Fig. 5. Principal component analysis (PCA) of cell-size distributions obtained for the cherry tomato genotype Cervil using the model variants M0–M24 (Table 1). The main plot shows the projection of individual distributions on the PC1–PC2 plane (72% and 16% of variance explained, respectively); d is the grid unit. Bootstrap results for measured cell size data are also projected (ExpData) as supplementary observations. Typical cell-size distribution shapes are illustrated for the main subgroups. Correlations of the variables with the first two principal components are shown at bottom left.
Fig. 7. Simulated relationships between ploidy and cell size at fruit maturity for the large-fruited tomato Levovil genotype. Left, models M0 and M1; and right, model M23 (Table 1). The adjusted R2 values corresponding to a linear regression model are shown. (This figure is available in colour at JXB online.)
Fig. 6. Principal component analysis (PCA) of cell-size distributions obtained for the large-fruited tomato genotype Levovil using the model variants M0– M24 (Table 1). The main plot shows the projection of individual distributions on the PC1–PC2 plane (75% and 17% of variance explained, respectively); d is the grid unit. Bootstrap results for measured cell size data are also projected (ExpData) as supplementary observations. Typical cell-size distribution shapes are illustrated for the main subgroups. Correlations of the variables with the first two principal components are shown in the inset at the top.
fact that the dynamics of fruit growth alone are not enough to discriminate between several biologically plausible models. In this sense, cell-size distribution represents a much more informative dataset as it uniquely results from the specific cell division and expansion patterns of the organ (Halter et al., 2009).
The assessment of cell sizes in an organ is not an easy task, however, and the measurement technique that is chosen may have important consequences on the resulting cell-size dis-tribution that is obtained (Legland et al., 2012). Mechanical constraints acting on tissues as well as vascularization can sig-nificantly modify cell shape, resulting in elongated or multi-lobed cells (Ivakov and Persson, 2013). Thus, in situations where the orientation of 2D slices can potentially affect the resulting estimation of cell area, possible differences between
in vivo tissues and dissociated cells should be systematically
checked (McAtee et al., 2009). The size of the dataset is also important with regards to correctly characterizing the ex-pected shape of the distribution. Indeed, outliers can signifi-cantly affect the estimation of high-order moments, especially in long-tailed distributions such as those usually observed in plant organs. It is for these reasons that we decided to focus on a qualitative comparison of simulated and experimental cell size distribution rather than on a ‘perfect fit'. Uncertainty in our dataset was accounted for via the estimation of confidence intervals for the experimental distribution moments.
In terms of future developments, the use of mutant or modi-fied varieties (Musseau et al., 2017) in combination with recent advancements in microscopy and tomography may permit the acquisition of more reliable datasets, thus opening the way to an in-depth investigation of cell-size distribution in relation to fruit tissues and hence to the underlying molecular processes (Mebatsion et al., 2009; Wuyts et al., 2010).
The relative importance of organ-wide and ploidy-dependent controls may be genotype-ploidy-dependent
According to our models, organ-wide control was responsible for cell-to-cell variations but a ploidy-mediated effect on cell
expansion was needed in order to obtain a significant cor-relation between size and ploidy (Figs 7, 8), as is observed in experimental data for fruit pericarps (Bourdon et al., 2011). However, the relative importance of the two modes of control may be genotype-dependent.
For the large-fruited variety, Levovil, organ-wide control was the dominant mechanism (Fig. 6). This was probably due to its long division phase, which causes the appearance of new, ex-panding cells late in the development of the fruit, once closure of the plasmodesmata is already completed. Independently of the targeted process, the addition of a ploidy-dependent effect did not significantly modify the predicted cell-size distribu-tion. The models supported the idea that cell ploidy may fix a maximum potential growth rate. Given the large fruit mass in the Levovil genotype, it is possible that such a potential may not have been fully reached in our experimental conditions, due to limited plant resources.
In the case of the cherry tomato variety, Cervil, the effect of a ploidy-dependent mechanism was more pronounced, especially when affecting cell carbon metabolism. Models combining both an organ- and a ploidy-dependent control performed better than the others (Fig. 5), although they failed to fully account for the experimental cell-size distribution. There may be a number of reasons for this discrepancy. First, due to a lack of data, the endoreduplication dynamics were calibrated according to the 2004 experiment whereas the division and the expan-sion modules were estimated using the 2007 data, where the cell-size distribution was available. Little is known about the possible dependence of endoreduplication on environmental variables (Engelen-Eigles et al., 2000; Setter and Flannigan, 2001; Cookson et al., 2006). In tomato fruit, changes in ploidy levels are mainly linked to changes in the duration of the mitotic phase (Bertin, 2005) but a direct effect of environmental fluctuations on endoreduplication-related parameters cannot be excluded. This may be particularly true for the cherry tomato genotype, for which the dynamics of cell division differed significantly between the two years (Supplementary Protocol S3). It could therefore be expected that the progression of the endocycle Fig. 8. Simulated relationships between ploidy and cell size at fruit maturity for the cherry tomato Cervil genotype. Left, models M0 and M1; and right, models M23 and M24 (Table 1). The adjusted R2 values corresponding to a linear regression model are shown. (This figure is available in colour at JXB online.)
may also have been different, with possible consequences on the shape of the resulting cell-size distribution. Preliminary simu-lations showed that an acceleration of the endocycle or an in-crease of the proportion of cells that entered a new round of endoreduplication could spread the resulting distribution to-wards large cell sizes, increasing the overall variance in models that included a ploidy-dependent effect.
In addition to mechanisms related to the cell cycle, environ-ment and cultural practices can also affect the resource avail-ability at the cell scale. In many fruit species including tomato, a negative correlation between mean cell size and cell number has been observed, suggesting the existence of competition for resources (Prudent et al., 2014). This kind of mechanism may widen the range of attainable cell sizes, and increase size vari-ations between early- and late-initiated cells. The importance of such an effect may vary with genotype and environmental conditions (Bertin, 2005; Quilot and Génard, 2008).
Stochasticity in cellular processes may be important for explaining cell-size variance in fruit
Our model is an example of a population model: the fruit is described as a collection of cell groups, each having specific characteristics in terms of number, mass, age, and ploidy level that dynamically evolve over time. Although asynchrony in the emergence of cell groups allowed us to capture a reasonable part of cell-to-cell heterogeneity (Tables 2, 3, Dispersion), the in-trinsic stochasticity of cellular processes (Robinson et al., 2011; De Smet and Beeckman, 2011; Meyer and Roeder, 2014) was not accounted for. Variations in the threshold size for division (often associated with a change in the cell cycle duration) as well as asymmetric cell divisions are considered as important determinants of the final cell size (Dupuy et al., 2010; Roeder
et al., 2010; Stukalin et al., 2013; Osella et al., 2014), and they may contribute to significantly spreading the size distribution of both the proliferating and expanding cell groups from early stages. Moreover, the degree of additional dispersion introduced by cell expansion is likely to depend on the specificity of the underlying mechanisms, with possible interactions with ploidy-dependent and organ-wide controls.
In terms of future developments, the addition of stochastic effects could help to fill the missing variance for both cherry and large-fruited genotypes. To achieve this, a novel model-ling scheme is needed in which the mean cell size of a group is replaced by a distribution of cell sizes, the parameters of which can evolve with time under the effect of cell expansion processes.
Correlation between size and ploidy: a clue for a direct influence of endoreduplication on cell expansion in tomato fruit?
Our results showed that asynchrony in cell division and endoreduplication events prevented the emergence of a cor-relation between size and ploidy based only on time course. According to our present model, a direct effect of nuclear ploidy on the attainable cell growth rate is needed in order to obtain the observed correlation in tomato fruit. This is in
line with data in the literature that points to the ploidy level setting the maximum cell growth rate that can be attained, with the actual rate depending on internal (hormones) and external (environmental) factors (Breuer et al., 2010; Chevalier
et al., 2011; De Veylder et al., 2011). Of course, this may be less striking in systems where the progression of endocycles is more sequential. An example may be the sepals of Arabidopsis, where data are consistent with a model in which expanding cells undergo a new round of endoreduplication at each time-step (Roeder et al., 2010). In this system, variability among cell size arises from asymmetry in cell division and variations in the exit time from mitotic cycle, whilst no differences in the growth rate are observed among cells with different ploidy levels (Tauriello et al., 2015; Robinson et al., 2018).
Overall, these results confirm that the relationship between endoreduplication and expansion may not be universal but can differ depending on the organ being considered. Moreover, at-tention should also be payed to cell identity. Thus, quantitative differences in the strength of the ploidy-dependent effect have been demonstrated between pavement and mesophyll cells in Arabidopsis leaves (Katagiri et al., 2016; Kawade and Tsukaya, 2017), whilst cell layer-specific developmental patterns have been observed in tomato fruit (Renaudin et al. 2017). In the model that we have developed, the spatial distribution of expanding-endoreduplicating cells is not accounted for. In terms of future developments, a model that includes distinct cell-layer populations with specific expansion programs may help to refine the relationship between ploidy and size.
Ultimately, improvements in the ability of computation models to integrate the multiple facets of organ development in a mechanistic way can help to evaluate and quantify the contribution of the different processes to the control of cell growth.
Supplementary data
Supplementary data are available at JXB online. Protocol S1. Cell distribution fit.
Protocol S2. Model equations and implementation.
Protocol S3. Model calibration and estimated parameter values.
Protocol S4. Correlation between ploidy and size.
Acknowledgements
The authors warmly thank B. Brunel for help with cell measurements. The authors are grateful to Inria Sophia Antipolis – Méditerranée ‘NEF' com-putation cluster for providing resources and support. This work was par-tially funded by the Agence Nationale de la Recherche, Project ‘Frimouss' (grant no. ANR–15–CE20–0009) and by the Agropolis Foundation under the reference ID 1403-032 through the « Investissements d'avenir » programme (Labex Agro:ANR-10-LABX-0001-01).
References
Asl LK, Dhondt S, Boudolf V, Beemster GT, Beeckman T, Inzé D, Govaerts W, De Veylder L. 2011. Model-based analysis of Arabidopsis
leaf epidermal cells reveals distinct division and expansion patterns for pavement and guard cells. Plant Physiology 156, 2172–2183.
Baldazzi V, Bertin N, Genard M, Génard M. 2012. A model of fruit growth integrating cell division and expansion processes. Acta Horticulturae 957, 191–196.
Baldazzi V, Génard M, Bertin N. 2017. Cell division, endoreduplication and expansion processes: setting the cell and organ control into an integrated model of tomato fruit development. Acta Horticulturae 1182, 257–264 Baldazzi V, Pinet A, Vercambre G, Bénard C, Biais B, Génard M. 2013. In-silico analysis of water and carbon relations under stress condi-tions. A multi-scale perspective centered on fruit. Frontiers in Plant Science 4, 495.
Barow M. 2006. Endopolyploidy in seed plants. BioEssays 28, 271–281. Beemster GT, Fiorani F, Inzé D. 2003. Cell cycle: the key to plant growth control? Trends in Plant Science 8, 154–158.
Bertin N. 2005. Analysis of the tomato fruit growth response to tempera-ture and plant fruit load in relation to cell division, cell expansion and DNA endoreduplication. Annals of Botany 95, 439–447.
Bertin N, Genard M, Fishman S. 2003. A model for an early stage of tomato fruit development: cell multiplication and cessation of the cell prolif-erative activity. Annals of Botany 92, 65–72.
Bertin N, Lecomte A, Brunel B, Fishman S, Génard M. 2007. A model describing cell polyploidization in tissues of growing fruit as related to ces-sation of cell proliferation. Journal of Experimental Botany 58, 1903–1913. Boudon F, Chopard J, Ali O, Gilles B, Hamant O, Boudaoud A, Traas J, Godin C. 2015. A computational framework for 3D mechanical modeling of plant morphogenesis with cellular resolution. PLoS Computational Biology 11, e1003950.
Bourdon M, Coriton O, Pirrello J, Cheniclet C, Brown SC, Poujol C, Chevalier C, Renaudin JP, Frangne N. 2011. In planta quantification of endoreduplication using fluorescent in situ hybridization (FISH). The Plant Journal 66, 1089–1099.
Breuer C, Ishida T, Sugimoto K. 2010. Developmental control of endocycles and cell growth in plants. Current Opinion in Plant Biology 13, 654–660.
Bünger-Kibler S, Bangerth F. 1982. Relationship between cell number, cell size and fruit size of seeded fruits of tomato (Lycopersicon esculentum Mill.), and those induced parthenocarpically by the application of plant growth regulators. Plant Growth Regulation 1, 143–154.
Carrari F, Baxter C, Usadel B, et al. 2006. Integrated analysis of metab-olite and transcript levels reveals the metabolic shifts that underlie tomato fruit development and highlight regulatory aspects of metabolic network be-havior. Plant Physiology 142, 1380–1396.
Cheniclet C, Rong WY, Causse M, Frangne N, Bolling L, Carde JP, Renaudin JP. 2005. Cell expansion and endoreduplication show a large genetic variability in pericarp and contribute strongly to tomato fruit growth. Plant Physiology 139, 1984–1994.
Chevalier C, Bourdon M, Pirrello J, Cheniclet C, Gévaudant F, Frangne N. 2014. Endoreduplication and fruit growth in tomato: evidence in favour of the karyoplasmic ratio theory. Journal of Experimental Botany 65, 2731–2746.
Chevalier C, Nafati M, Mathieu-Rivet E, Bourdon M, Frangne N, Cheniclet C, Renaudin JP, Gévaudant F, Hernould M. 2011. Elucidating the functional role of endoreduplication in tomato fruit development. Annals of Botany 107, 1159–1169.
Colombié S, Nazaret C, Bénard C, et al. 2014. Modelling central metabolic fluxes by constraint-based optimization reveals metabolic reprogramming of developing Solanum lycopersicum (tomato) fruit. The Plant Journal 81, 24–39. Constantinescu D, Memmah MM, Vercambre G, Génard M, Baldazzi V, Causse M, Albert E, Brunel B, Valsesia P, Bertin N. 2016. Model-assisted estimation of the genetic variability in physiological param-eters related to tomato fruit growth under contrasted water conditions. Frontiers in Plant Science 7, 1841.
Cookson SJ, Radziejwoski A, Granier C. 2006. Cell and leaf size plas-ticity in Arabidopsis: what is the role of endoreduplication? Plant, Cell & Environment 29, 1273–1283.
Cosgrove DJ. 2016. Plant cell wall extensibility: connecting plant cell growth with cell wall structure, mechanics, and the action of wall-modifying enzymes. Journal of Experimental Botany 67, 463–476.
Crawford KM, Zambryski PC. 2001. Non-targeted and targeted protein movement through plasmodesmata in leaves in different developmental and physiological states. Plant Physiology 125, 1802–1812.
De Smet I, Beeckman T. 2011. Asymmetric cell division in land plants and algae: the driving force for differentiation. Nature Reviews Molecular Cell Biology 12, 177–188.
De Veylder L, Larkin JC, Schnittger A. 2011. Molecular control and function of endoreplication in development and physiology. Trends in Plant Science 16, 624–634.
Dupuy L, Mackenzie J, Haseloff J. 2010. Coordination of plant cell div-ision and expansion in a simple morphogenetic system. Proceedings of the National Academy of Sciences, USA 107, 2711–2716.
Edgar BA, Zielke N, Gutierrez C. 2014. Endocycles: a recurrent evolu-tionary innovation for post-mitotic cell growth. Nature Reviews Molecular Cell Biology 15, 197–210.
Engelen-Eigles G, Jones RJ, Phillips RL. 2000. DNA endoreduplication in maize endosperm cells: the effect of exposure to short-term high tem-perature. Plant, Cell and Environment 23, 657–663.
Fanwoua J, de Visser P, Heuvelink E, Yin X, Struik PC, Marcelis LFM. 2013. A dynamic model of tomato fruit growth integrating cell division, cell growth and endoreduplication. Functional Plant Biology 40, 1098.
Ferjani A, Horiguchi G, Yano S, Tsukaya H. 2007. Analysis of leaf develop-ment in fugu mutants of Arabidopsis reveals three compensation modes that modulate cell expansion in determinate organs. Plant Physiology 144, 988–999. Fishman S, Génard M. 1998. A biophysical model of fruit growth: simula-tion of seasonal and diurnal dynamics of mass. Plant, Cell and Environment 21, 739–752.
Fleming AJ. 2006. The integration of cell proliferation and growth in leaf morphogenesis. Journal of Plant Research 119, 31–36.
Halter M, Elliott JT, Hubbard JB, Tona A, Plant AL. 2009. Cell volume distributions reveal cell growth rates and division times. Journal of Theoretical Biology 257, 124–130.
Han X, Kumar D, Chen H, Wu S, Kim JY. 2014. Transcription factor-mediated cell-to-cell signalling in plants. Journal of Experimental Botany 65, 1737–1749.
Horiguchi G, Tsukaya H. 2011. Organ size regulation in plants: insights from compensation. Frontiers in Plant Science 2, 24.
Ivakov A, Persson S. 2013. Plant cell shape: modulators and measure-ments. Frontiers in Plant Science 4, 439.
Jégu T, Latrasse D, Delarue M, et al. 2013. Multiple functions of Kip-related protein5 connect endoreduplication and cell elongation. Plant Physiology 161, 1694–1705.
John PCL, Qi R. 2008. Cell division and endoreduplication: doubtful en-gines of vegetative growth. Trends in Plant Science 13, 121–127.
Katagiri Y, Hasegawa J, Fujikura U, Hoshino R, Matsunaga S, Tsukaya H. 2016. The coordination of ploidy and cell size differs between cell layers in leaves. Development 143, 1120–1125.
Kawade K, Horiguchi G, Tsukaya H. 2010. Non-cell-autonomously co-ordinated organ size regulation in leaf development. Development 137, 4221–4227.
Kawade K, Tsukaya H. 2017. Probing the stochastic property of endoreduplication in cell size determination of Arabidopsis thaliana leaf epi-dermal tissue. PLoS ONE 12, e0185050.
Kuchen EE, Fox S, de Reuille PB, et al. 2012. Generation of leaf shape through early patterns of growth and tissue polarity. Science 335, 1092–1096.
Legland D, Devaux MF, Bouchet B, Guillon F, Lahaye M. 2012. Cartography of cell morphology in tomato pericarp at the fruit scale. Journal of Microscopy 247, 78–93.
Liu HF, Génard M, Guichard S, Bertin N. 2007. Model-assisted analysis of tomato fruit growth in relation to carbon and water fluxes. Journal of Experimental Botany 58, 3567–3580.
Lockhart JA. 1965. An analysis of irreversible plant cell elongation. Journal of Theoretical Biology 8, 264–275.
Löfke C, Dünser K, Scheuring D, et al. 2015. Auxin regulates SNARE-dependent vacuolar morphology restricting cell size. eLIFE 4, 119–122. Lucas M, Kenobi K, von Wangenheim D, et al. 2013. Lateral root mor-phogenesis is dependent on the mechanical properties of the overlaying
tissues. Proceedings of the National Academy of Sciences, USA 110, 5229–5234.
McAtee PA, Hallett IC, Johnston JW, Schaffer RJ. 2009. A rapid method of fruit cell isolation for cell size and shape measurements. Plant Methods 5, 5.
Mebatsion HK, Verboven P, Melese Endalew A, Billen J, Ho QT, Nicolaï BM. 2009. A novel method for 3-D microstructure modeling of pome fruit tissue using synchrotron radiation tomography images. Journal of Food Engineering 93, 141–148.
Meyer HM, Roeder AHK. 2014. Stochasticity in plant cellular growth and patterning. Frontiers in Plant Science 5, 420.
Musseau C, Just D, Jorly J, Gvaudant F, Moing A, Chevalier C, Lemaire-Chamley M, Rothan C, Fernandez L. 2017. Identification of two new mechanisms that regulate fruit growth by cell expansion in tomato. Frontiers in Plant Science 8, 988.
Norman JM. Van, Breakfield NW, Benfey PN, Carolina N, Van Norman JM, Breakfield NW, Benfey PN. 2011. Intercellular com-munication during plant development. The Plant Cell 23, 855–864. Okello RCO, Heuvelink E, de Visser P, Struik PC, Marcelis LFM. 2015. What drives fruit growth? Functional Plant Biology 42, 817.
Osella M, Nugent E, Cosentino Lagomarsino M. 2014. Concerted con-trol of Escherichia coli cell division. Proceedings of the National Academy of Sciences, USA 111, 4–8.
Pirrello J, Deluche C, Frangne N, et al. 2018. Transcriptome profiling of sorted endoreduplicated nuclei from tomato fruits: how the global shift in expression ascribed to DNA ploidy influences RNA-Seq data normalization and interpretation. The Plant Journal 93, 387–398.
Proseus TE, Boyer JS. 2006. Identifying cytoplasmic input to the cell wall of growing Chara corallina. Journal of Experimental Botany 57, 3231–3242. Proseus TE, Ortega JK, Boyer JS. 1999. Separating growth from elastic deformation during cell enlargement. Plant Physiology 119, 775–784. Prudent M, Dai ZW, Génard M, Bertin N, Causse M, Vivin P. 2014. Resource competition modulates the seed number–fruit size relationship in a genotype-dependent manner: a modeling approach in grape and tomato. Ecological Modelling 290, 54–64
Quilot B, Génard M. 2008. Is competition between mesocarp cells of peach fruits affected by the percentage of wild species genome? Journal of Plant Research 121, 55–63.
Renaudin JP, Deluche C, Cheniclet C, Chevalier C, Frangne N. 2017. Cell layer-specific patterns of cell division and cell expansion during fruit set and fruit growth in tomato pericarp. Journal of Experimental Botany 68, 1613–1623.
Robinson DO, Coate JE, Singh A, Hong L, Bush M, Doyle JJ, Roeder AHK, Jeff J. 2018. Ploidy and size at multiple scales in the Arabidopsis sepal. The Plant Cell 30, 2308–2329.
Robinson S, Barbier de Reuille P, Chan J, Bergmann D, Prusinkiewicz P, Coen E. 2011. Generation of spatial patterns through cell polarity switching. Science 333, 1436–1440.
Roeder AHK, Chickarmane V, Cunha A, Obara B, Manjunath BS, Meyerowitz EM. 2010. Variability in the control of cell division underlies sepal epidermal patterning in Arabidopsis thaliana. PLoS Biology 8, e1000367. Sablowski R, Carnier Dornelas M. 2014. Interplay between cell growth and cell cycle in plants. Journal of Experimental Botany 65, 2703–2714. Schoenfelder KP, Fox DT. 2015. The expanding implications of polyploidy. The Journal of Cell Biology 209, 485–91.
Serrano-Mislata A, Schiessl K, Sablowski R. 2015. Active control of cell size generates spatial detail during plant organogenesis. Current Biology 25, 2991–2996.
Setter TL, Flannigan BA. 2001. Water deficit inhibits cell division and ex-pression of transcripts involved in cell proliferation and endoreduplication in maize endosperm. Journal of Experimental Botany 52, 1401–1408. Stukalin EB, Aifuwa I, Kim JS, Wirtz D, Sun SX. 2013. Age-dependent stochastic models for understanding population fluctuations in continuously cultured cells. Journal of the Royal Society Interface 10, 20130325. Sugimoto-Shirasu K, Roberts K. 2003. “Big it up”: endoreduplication and cell-size control in plants. Current Opinion in Plant Biology 6, 544–553. Tauriello G, Meyer HM, Smith RS, Koumoutsakos P, Roeder AH. 2015. Variability and constancy in cellular growth of Arabidopsis sepals. Plant Physiology 169, 2342–2358.
Thompson DS, Davies WJ, Ho LC. 1998. Regulation of tomato fruit growth by epidermal cell wall enzymes. Plant, Cell and Environment 21, 589–599.
Tsukaya H. 2003. Organ shape and size: a lesson from studies of leaf mor-phogenesis. Current Opinion in Plant Biology 6, 57–62.
von Wangenheim D, Fangerau J, Schmitz A, Smith RS, Leitte H, Stelzer EH, Maizel A. 2016. Rules and self-organizing properties of post-embryonic plant organ cell division patterns. Current Biology 26, 439–449. Wuyts N, Palauqui JC, Conejero G, Verdeil JL, Granier C, Massonnet C. 2010. High-contrast three-dimensional imaging of the Arabidopsis leaf enables the analysis of cell dimensions in the epidermis and mesophyll. Plant Methods 6, 17.
Zambryski PC. 2004. Cell-to-cell transport of proteins and fluorescent tracers via plasmodesmata during plant development. Journal of Cell Biology 164, 165–168.