HAL Id: hal-01582170
https://hal.archives-ouvertes.fr/hal-01582170
Submitted on 5 Sep 2017
HAL is a multi-disciplinary open access
archive for the deposit and dissemination of
sci-entific research documents, whether they are
pub-lished or not. The documents may come from
teaching and research institutions in France or
abroad, or from public or private research centers.
L’archive ouverte pluridisciplinaire HAL, est
destinée au dépôt et à la diffusion de documents
scientifiques de niveau recherche, publiés ou non,
émanant des établissements d’enseignement et de
recherche français ou étrangers, des laboratoires
publics ou privés.
Evolutionary Tuned Latent Semantic Analysis
Denis Pallez, Julien Gardès, Claude Pasquier
To cite this version:
Denis Pallez, Julien Gardès, Claude Pasquier. Prediction of miRNA-disease Associations using an
Evolutionary Tuned Latent Semantic Analysis. Scientific Reports, Nature Publishing Group, 2017, 7,
pp.10548. �10.1038/s41598-017-10065-y�. �hal-01582170�
Prediction of miRNA-disease
Associations using an Evolutionary
Tuned Latent Semantic Analysis
Denis Pallez
1, Julien Gardès
2& Claude Pasquier
1MicroRNAs, small non-coding elements implied in gene regulation, are very interesting biomarkers for various diseases such as cancers. They represent potential prodigious biotechnologies for early diagnosis and gene therapies. However, experimental verification of microRNA-disease associations are time-consuming and costly, so that computational modeling is a proper solution. Previously, we designed MiRAI, a predictive method based on distributional semantics, to identify new associations between microRNA molecules and human diseases. Our preliminary results showed very good prediction scores compared to other available methods. However, MiRAI performances depend on numerous parameters that cannot be tuned manually. In this study, a parallel evolutionary algorithm is proposed for finding an optimal configuration of our predictive method. The automatically parametrized version of MiRAI achieved excellent performance. It highlighted new miRNA-disease associations, especially the potential implication of mir-188 and mir-795 in various diseases. In addition, our method allowed to detect several putative false associations contained in the reference database.
MicroRNAs (miRNAs) are a class of 19–24 nucleotides single-stranded non-coding RNAs that can regulate gene expression at the post-transcriptional level by binding with 3′ untranslated regions (UTRs) of the target mRNAs through base pairing. Every miRNA might regulate from a dozen to thousands of genes and one target gene could also be regulated by hundreds of miRNAs. These miRNA-mRNA interactions play critical roles in many physi-ological processes, such as development, apoptosis, differentiation and metabolism. miRNA dysregulations are also closely related to the development and progression of various human diseases, including cancer. Therefore, identifying new microRNAs associated with diseases contributes to a better understanding of pathogenicity mechanisms.
The state of knowledge in this field is still relatively limited at the current time. In addition, the cost of Research and Development (R&D) in “wet” laboratories to reach a new level of understanding can be a brake in scientific progression. To increase the chance of success and to focus biologists on promising ways, computational mode-ling is still a proper solution.
Because miRNAs act mainly by targeting mRNAs for cleavage or translational repression1, the first proposed methods inferred miRNA-disease associations from the known associations between targeted mRNAs and dis-eases. Subsequently, a significant number of methods were presented that took into account various data sources (disease phenotypic similarity, miRNA functional similarity, miRNA family). Surveys of the existing computa-tional approaches, their performance and their limitations can be found in Zou et al.2 and Zeng et al.3.
Several recent works combined multiple sources of information to build integrated methods capable of achiev-ing an excellent accuracy.
Liu et al.4 proposed a method that combines a disease similarity network and a miRNA similarity network to build an heterogeneous network explored by a random walk. The authors built those networks by integrat-ing multiple data sources. The disease similarity is composed of disease semantic similarity and disease func-tional similarity, and the miRNA similarity is calculated using the miRNA-target gene and miRNA-lncRNA (long non-coding RNA) associations.
On a similar network, built by integrating different sources, Yu et al.5 used a combinatorial prioritization algorithm6 to prioritize disease-microRNA associations. This is achieved by computing, for each combination of disease-microRNA, an association score that is obtained by maximizing network information flow. This method
1Université Côte d’Azur, CNRS, I3S, Sophia Antipolis, France. 2BIOMANDA, 2720 Chemin St Bernard, Les Moulins
I Batiment 4, 06220, Vallauris, France. Denis Pallez, Julien Gardès and Claude Pasquier contributed equally to this work. Correspondence and requests for materials should be addressed to C.P. (email: claude.pasquier@unice.fr) Received: 21 April 2017
Accepted: 26 July 2017 Published: xx xx xxxx
makes it possible to infer new associations for a disease or a miRNA, even in the absence of known associations. Yu et al.5 also investigated an ensemble-based method that obtains very high performance.
Gu et al.7 combined miRNA functional similarities, miRNA family information and miRNA-disease associ-ations to build a miRNA-miRNA similarity network (the miRNA space). Similarly, they used disease semantic similarity and miRNA-disease associations to build a disease-disease similarity network (the disease space). The score of an association between miRNA m and disease d depends on the spatial similarity between the miRNAs associated to d and the connexions of m in the miRNA space and, conversely, the score depends also on the spatial similarity between the diseases associated to m and the connexions of d in the disease space.
You et al.8 proposed a prediction model that integrates known human miRNA-disease associations, miRNA functional similarity and disease semantic similarity. Based on the assumption that miRNAs with more functional similarity tend to be associated with similar diseases, the authors use Gaussian interaction profile kernel9 for calculating the similarities network between diseases. The method constructs a heterogeneous graph consist-ing of three interlinked sub-graphs (i.e., miRNA-miRNA similarity network, disease-disease similarity network and miRNA-disease association network) and further adopts depth-first search algorithm to infer potential new miRNA-disease associations. In addition to achieving excellent performance, this method allows to predict new associations for diseases with no known associated miRNAs (or for miRNAs with no known associated diseases). Pasquier et al.10 made the assumption that information attached to miRNAs and diseases can be revealed by distributional semantics. The approach represented distributional information on miRNAs and diseases in a high-dimensional vector space and defined associations between miRNAs and diseases in terms of vector simi-larity. Cross validations performed on a dataset of known miRNA-disease associations demonstrated the excellent performance of the method and its ability to discover new disease-miRNA associations as well as to identify putative false associations reported in databases.
The problem with this approach is the need to define the set of control parameter values whose evaluation of each combination is impossible. In the work of Pasquier et al.10, parameter values were found manually by the authors from many trial-error iterations. In this paper, we focus on the use of Evolutionary Algorithms (EA) to determine, in a reasonable time, a satisfactory tuning without having to evaluate all the possible configurations. In order to reduce computational time, configurations are evaluated in parallel on a computation-grid. To determine which configuration is needed for a real evaluation on the grid, a surrogate model is employed during the EA process. This strategy allowed us to significantly increase the performance of the predictions.
Methods
microRNA-disease association prediction method (MiRAI).
In a previous work, we developed a method, called MiRAI, that uses distributional semantics to reveal new information attached to miRNAs and diseases10. Our basic approach represents distributional information on miRNAs in a high-dimensional vector space11 and defines the associations between miRNAs and diseases in terms of vector similarities. The vector space model is an algebraic model for representing objects as vectors. Our vector space model represents miRNAs as vectors in a d-dimensional space, where d is the number of unique attributes that characterize a miRNA. Thed components of each miRNA vector are assigned with a number (a weight) that quantifies the importance of an
attribute in the modelized miRNA.
We used Latent Semantic Analysis (LSA)12 to process vectors from the vector space model we created. Singular Value Decomposition (SVD) is used for reducing the dimension of the original matrix while preserving the similarity structure. In SVD, a rectangular matrix is decomposed into the product of three other matrices. One of the resulting matrices describes the original row entities as vectors of arbitrary size, another matrix describes the original column entities as vectors of the same size. Rows and columns are thus the components of a same dimensional space. They can be compared by taking the cosine of the angle between their corresponding vectors. Values close to 1 represent very similar data while values close to 0 represent very dissimilar data.
Each miRNA can be characterized by several kinds of data: known associated diseases, target mRNAs, family, proximity to neighbor miRNAs, abstracts of associated papers and other descriptions in plain text format. For textual data, there exists many ways to calculate weights and numerous studies were dedicated to the finding of an efficient weighting scheme13. For numerical or categorical data, nothing like this exists. One needs to try different weighting schemes for each kind of data to evaluate their pertinence in the frame of LSA. However, the evaluation of the weighting schemes cannot be performed one after the other. All combinations of different possible strate-gies for calculating the weight of each piece of data should be considered.
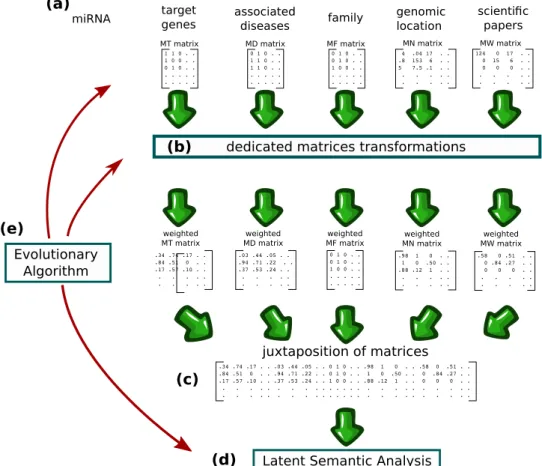
Roughly speaking, as depicted in Fig. 1, we have four different sources of data that we can choose to use or not (associated diseases being a mandatory source). In fact, using the maximum amount of data is not necessarily the best option, as we shall see later. For miRNA-target data, we have the choice of whether to use the raw values or to transform these values by using, for instance, a recommendation algorithm. For miRNA-disease associations, we have several ways to compute the similarities between diseases. For genomic location, we can imagine several strategies to weight the likelihood of a coexpression pattern. For plain text data, we can use the raw counts of words or use the popular Term Frequency–Inverse Document Frequency weighting scheme (TF-IDF)11.
We can also choose between several dimensions from the reduced space. In total, we enumerated 35 different alternatives that influence the behavior of the algorithm. For each parameter, we have the choice between two values for a total of 235, or 5 × 10¹⁶ different configurations. Depending on the data used, the resulting matrix can
have tens of thousands of columns and the training of the model can last up to four hours. Even by automating the process with brute force search, the combinatorial explosion makes this impractical. For this kind of problems, where the enumeration of all the solutions is not possible, some meta-heuristics algorithms, such as evolutionary computation, can be applied.
Determination of parameters.
As described previously, each miRNA is associated with several kinds of data that are stored in distinct matrices (Fig. 1a). In all matrices, rows represent miRNAs and columns represent distinct characteristics. In miRNA-target associations matrix (MT matrix), columns represent genes and the entry in the i-th row and j-th column mtij is equal to 1 if miRNA at position i targets the gene at position j, 0 otherwise. In miRNA-disease associations matrix (MD matrix), columns represent diseases and mdij is equal to 1 if the asso-ciation between miRNA at position i and disease at position j has been reported, 0 otherwise. In miRNA-family associations matrix (MF matrix), columns represent miRNA families and MFij is equal to 1 if the miRNA at position i belongs to family at position j, 0 otherwise. In miRNA-neighbor associations matrix (MN matrix), columns represent miRNAs and mnij is equal to the genomic distance between the miRNA at row position i and the miRNA at column position j. In miRNA-word associations matrix (MW matrix), columns represent words and mwij is equal to the number of times the word at position j is used in plain text descriptions of the miRNA at position i. Concerning the sources of the plain text descriptions, we can opt to use the abstract of articles associ-ated with miRNAs in PubMed (by performing searches with the name of the miRNAs), the abstracts referenced in MiRBase, the miRNA description fields in MiRBase or any combination of these sources.Using information related to disease associations is mandatory but other data may or may not be used. So we have a total of 6 individual choices, depending on whether the corresponding data are used or not (Table 1a). If we elect to use the association between miRNAs and their targets, we can choose whether to use the raw associa-tions stored in databases or to apply a method modulating the weight of the associaassocia-tions such as, for example the network based inference method described by Zhou et al.14 (Table 1b).
Concerning miRNA-disease associations, we can decide whether to use or not similarities between diseases as explained in Pasquier et al.10. However, instead of using an unique measure m ∈ [0, 1] reflecting the weight of the association between a miRNA and a disease, we decided to discretize this measure to obtain several indicators, each of them indicating whether the weight of the association is above a given cutoff or not. For example, by using 1/3 and 2/3 as cutoffs, one obtains three overlapping bins that associate m ∈ [0, 1/3] with the indicator no_assoc,
m ∈ [1/3, 1] with the indicator significant_assoc and m ∈ [2/3, 1] with the indicator high_assoc. With this
map-ping, a similarity measure of 0.8 will be associated with the annotations moderate_assoc and high_assoc. The setting consists in choosing the number of cutoffs to use and selecting their values (Table 1b).
Figure 1. Illustration of the method. (a) miRNAs are characterized by several kinds of data that are stored in
distinct matrices. (b) Each matrix is processed by a dedicated method for transforming it into a weighted matrix where the strength of an association between a miRNA and a characteristic is represented by a float number. (c) Concatenation of matrices (d) similarities and dissimilarities between miRNAs and diseases are highlighted by LSA. (e) Evolutionary computation is used for selecting the data sources to use, for tuning the matrices transformations, for determining the size of the latent space and for choosing to whether expand or not the terms used for LSA queries.
We also have to decide if we want to infer diseases. Inferring diseases means that if a miRNAs is associated with a term, then it is also associated with all the subsumed terms. For example, from the association of a miRNA with “Colonic Neoplasms”, we can infer that the miRNA is also associated with “Colorectal Neoplasms” because in the MeSH hierarchy, the term “Colonic Neoplasms” is subsumed by “Colorectal Neoplasms”. The inference of the diseases can take place in the matrix, before computing the disease similarities (Table 1b) or during the query (Table 1d). For the latter, the query is expanded with all the terms that are subsumed.
The proximity with other miRNAs is an important factor, as noted by several authors15, 16. If such information is taken into account, a weighting scheme is considered allowing each entry in the matrix to correspond to a value indicating the likelihood of a coexpression pattern10. If plain text data are used, we can decide whether to use or not a weighting scheme. Among the numerous existing weighting schemes, we stick to the popular TF-IDF weighting scheme11, which involves multiplying the Inverse Document Frequency measure by a Term Frequency measure (Table 1b). If we elect to use the associations between miRNAs and families, we do not apply any weight-ing scheme as every miRNA is associated with only one family.
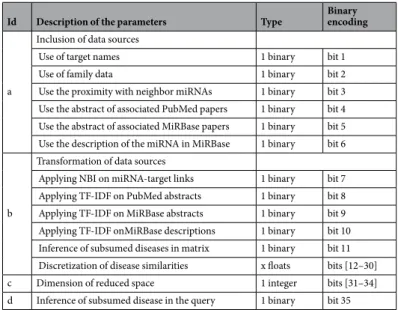
The last parameter that has influence on the MiRAI method is the dimension of the reduced space. As sum-marized in Table 1, the MiRAI method is controlled by 12 binary parameters, a mix of real numbers (the discre-tization cutoffs) and 1 integer (the dimension of the reduced space). In the present work, the goal is to find the best combination parameter values for prediction. So, all previous parameters are gathered in an unique vector. In order to avoid dealing with different parameter types (binary, real or integer) and to simplify the optimization technique adaptation, we decided to convert all of them in the binary space. Indeed, only integer and real param-eters are converted using respectively Gray coding and cutoffs.
Concerning the cutoffs, we decided to allow a maximum of 19 cutoffs and to pre-determine their value from 0.05 to 0.95 using a step of 0.05. This is represented by 19 binary values, each one corresponding to a cutoff value. The binary value is 1 when the cutoff is used, 0 otherwise (Table 1c). We encoded the dimension of the latent space on four bits to encompass all dimensions between 50 and 800 with a step of 50. The number d stored in the vector is encoded with reflected binary code (RBC). The dimension is obtained with dim = 50(d + 1) (Table 1c). Ultimately, each control parameter set of MiRAI is encoded by a binary vector of 35 bits as detailed in Table 1.
Tuning MiRAI with Surrogate model Assisted EA.
The accuracy of the method is measured by comput-ing the Area Under the ROC Curve (AUC) (an AUC of 1 reflects perfect classification and an AUC of 0.5 indicates random classification)17. This section describes the parametrization of MiRAI using a surrogate model assisted evolutionary algorithm for maximizing the AUC.Evolutionary Algorithms. EAs are nature inspired and stochastic algorithms that mimic Darwin theory for
prob-lem optimization18. Given a problem P to be maximized (resp. minimized), the goal is to find a solution x* such as
f(x*) = max (resp. min) {f(y)/y ∈ S} with S the set of all the possible solutions of P, f S: → is called objective
function or fitness function and indicates the quality of the solution y for the problem P.
Many variants of EA are proposed in the literature (Genetic Algorithm, Evolution Strategies, Genetic Programming, Differential Evolution …) but they all share a common structure: a set of candidate solutions {xi ∈ S}0<i≤n for the problem P, called population, is created and most often initialized randomly. Then, each
solu-tion of the populasolu-tion, called individual, is evaluated using the fitness funcsolu-tion f. Based on the fitness value of each individual, a selection operator is applied for choosing individuals that are allowed to create offspring. The latter are generated using genetic operators like crossover or mutation, each applied with a given probability. Such operators introduce variability in the solution space allowing to escape from local optima. Offspring is
Id Description of the parameters Type Binary encoding
a
Inclusion of data sources
Use of target names 1 binary bit 1 Use of family data 1 binary bit 2 Use the proximity with neighbor miRNAs 1 binary bit 3 Use the abstract of associated PubMed papers 1 binary bit 4 Use the abstract of associated MiRBase papers 1 binary bit 5 Use the description of the miRNA in MiRBase 1 binary bit 6
b
Transformation of data sources
Applying NBI on miRNA-target links 1 binary bit 7 Applying TF-IDF on PubMed abstracts 1 binary bit 8 Applying TF-IDF on MiRBase abstracts 1 binary bit 9 Applying TF-IDF onMiRBase descriptions 1 binary bit 10 Inference of subsumed diseases in matrix 1 binary bit 11 Discretization of disease similarities x floats bits [12–30] c Dimension of reduced space 1 integer bits [31–34] d Inference of subsumed disease in the query 1 binary bit 35
in turn evaluated using f. As the population size is considered constant, a replacement operator is applied for choosing which individual among parents plus offspring are kept for the next iteration. A single iteration is called a generation and is repeated until a given criterion is met. This criterion can be a constraint on the elapsed time, the number of function evaluations, the maximum number of generations without improvement, etc. A very good overview of EA has been proposed by Bartz-Beielstein et al.19 where they introduced many fundamental sub-domains such as multiple objectives, dynamic, noisy or expensive optimization problems such as the one we are facing in this article.
EAs are preferred to deterministic optimizations when |S| is huge to the extent that they allow to find promising solutions within a reasonable timeframe. They can also be used when f is non-differentiable or non-continuous. As EAs deal with a set of individuals, they can naturally be parallelized as discussed in a next section.
Discrete Differential Evolution. In a serie of experiments, Differential Evolution (DE), initially proposed by Storn
and Price20, has proven to be more effective than some other EAs (The reader can refer to
http://www1.icsi.berke-ley.edu/~storn/code.html for source code on DE). It works as follows: for each individual in the population called
target vector and formalized as xit, a mutant vector μit associated to xit is first generated by adding the weighted
difference between two randomly chosen vectors (parameter vectors xit2 and xi
t
3) to a third chosen vector (base vector xit1) using Eq. 1:
μ =ijt x + ⋅F x
(
−x)
(1)i jt1 i jt2 i jt3
where i ≠ i1 ≠ i2 ≠ i3; i1, i2 and i3 are randomly and uniformly chosen between 1 and the population size λ; F ∈ +
is a scaling factor, controlling the amplification of the differential variation and xijt represents the j–th gene of the
i–th individual in the population at generation t. Secondly, one child, called the trial vector x +
it 1, is obtained by
crossing the mutant vector μit and the target vector x
it using Eq. 2: x rand CR j rand i x if ( ) or ( ) otherwise (2) ijt ij t ijt 1=μ ≤ = +
where CR is the crossover probability ranged in (0, 1). rand is a random value uniformly distributed within [0, 1);
rand(i) is a random integer ranging between 1 and N where N is the number of individuals. Finally, the target
vector is replaced with the best of either the trial or the target vector. As the initial DE operates in a continuous space, which means that xit are float-valued vectors, Wang et al.21 proposed a modified binary version of DE, called MBDE for tackling binary-coded optimization problems. MBDE keeps same strategy as initial DE but introduces a probability estimation operator P x( )ijt defined in Eq. 3 for defining a probability of vector x
ijt: = + − ⋅ ⋅ + ⋅ − − . + ⋅
(
)
P x e ( ) 1 1 (3) ijt b xi jt F xi jt xi jt F 2 1 2 3 0 5 1 2where ∈b + (b = 6 is suggested by the authors). Then, this probability is used for defining the mutant vector in the binary space according to Eq. 4 in place of Eq. 1.
μ = ≤ rand P x 1 if ( ) 0 otherwise (4) ijt ij t
This new adaptation of DE in the binary space is well suited for our problem but does not take into account a cost evaluation of MiRAI configurations.
Surrogate model Assisted Evolutionary Algorithm. As mentioned earlier, evaluating one configuration of MiRAI
framework may take up to four hours of computation on a single core, resulting to a time-consuming or
expen-sive fitness function. Using only a parallelization strategy alone would not be sufficient in this case as EA needs
many function evaluations to reach an acceptable solution. Various approaches22–25 are proposed to reduce the computational cost by exploiting knowledge of past evaluations and are mainly based on meta-modeling. The idea is to learn a new model, called surrogate in the sequel, that approximates the expensive real fitness func-tion. Therefore, the EA is hybridized with a learned model and is called Surrogate model Assisted Evolutionary Algorithm (SAEA)24. There exists two main ways for hybridization. The first one is evolution control where a
controlled number of individuals are evaluated with the real fitness function while others are evaluated with the
model. In individual-based evolution control, as indicated by its name, only a certain rate of individuals in each population is evaluated using the real fitness function. In generation-based evolution control, all individuals of the population are evaluated using either the real fitness function or the surrogate function. The second way of hybridization is to use EA for optimizing the model. The resulting optima are then re-evaluated on the real fitness function, in turn used for updating the surrogate model.
Gaussian Process surrogate model. Buche et al.24 suggest using Gaussian Process (GP or Krigging26) as a surrogate model because it has the following properties: (1) it can approximate any function as Artificial Neural Network
(ANN) does even with discontinuities or multi-modality, (2) it can predict the mean and the standard deviation of the fitness value of any new individual, (3) it has a very small number of hyper-parameters compared with ANN which can be set either by the user or by an optimizer. A drawback of such model is its computational cost which is in ( )n3 for the learning of thereof, in ( )n2 for predicting the standard deviation and in ( )n for pre-dicting the mean of the fitness value of a new individual. However, the time required for learning the surrogate model can be considered insignificant compared with the time required for evaluating MiRAI configurations.
Given m expensive and potentially noisy evaluations of a computational experiment Y={yi∈}0≤ ≤i m and their m corresponding input configurations =X {xi∈d}0≤ ≤i m, we want to estimate value of y = f(x) at a new
untested configuration, xk∉X. Rather than claiming f(x) relates to some specific models (linear, cubic,
quad-ratic…) and in order to create a meta-model of the unknown f function, GP makes no assumption on the smooth-ness of f but assumes that f(x) is a Gaussian function represented by N(μ, σ2) at any point x where the mean and
the standard deviation are two constants independent of x. For any x, f(x) is a sample of μ + ε(x), where
ε( )x ∼N(0, )σ2. Compared to other modeling techniques, a spatial correlation sc between the output values is assumed to be stationary and depends on input values. It is expressed in Eq. 5 as:
∑
θ ∀ ′ ∈ ′ ≡ ′ ≡ − ′ = − − ′ = x x, , ( ( ), ( ))sc f x f x sc x x( , ) sc x( x) exp x x (5) d i m i i ip 1 i where unknown parameters θi > 0 indicate the importance of xi on f(x) and 1 ≤ pi ≤ 2 the smoothness of f(x). As mentioned by Buche et al.24, {θ
i, pi}0≤i≤m are GP hyperparameters and they can either be set by the user or
opti-mized by a maximum likelihood approach22, 26. The interest of using GP lies in its ability to predict a function value with its corresponding confidence interval ξ and without much additional computational cost. As explained by Emmerich et al.22 and Buche et al.24, Lewis et al.27 introduced a merit function f
m (Eq. 6) in place of the predic-tive function f of the GP surrogate model in order to balance exploration of unexplored area of search space and exploitation of optimal solutions of f:
x d, f x( ) f x( ) ( ),x [0, 3] (6)
m ωξ ω
∀ ∈ = − ∈
where a common suggested choice is ω = 2 for a minimization problem. Since we are dealing with a maximization problem, ω must be negative.
Distribution of real MiRAI configurations evaluation on a grid. As seen in the previous section, surrogate model
is used for identifying promising areas of the search space and for largely minimizing computational costs. However, surrogate models must be learned or updated from real evaluations which can be done in parallel.
surrogate model exploration/
exploitation ω = −2 population size λ = 50 number of cores c = 48
max. real evaluations t = 50, Nf = t × λ
max. surrogate evaluations μ = 100, Nf =μ×λ
scaling factor F = 0.8
crossover rate CR = 0.8
individual length’s N = 35
probability estimation operator b = 6 Table 2. Parameter values of algorithm 1.
So, in this paper, we want to leverage the advantages of GP surrogate model combined with the advantages of evaluating expensive real fitness function in parallel. A generation-based evolution control (SAEA) is then used for its simplicity. When using the real and expensive fitness function, each evaluation is performed in parallel over a distributed cluster. In theory, this means that the number of cores should be equal to the population size. But it is not mandatory: since in our case the time required for evaluating one configuration varies between two configura-tions, we decided to have fewer cores than the population size. On the opposite, surrogate model learning, fitness evaluations and other steps of the EA are applied sequentially on the same processor as the computational time is negligible compared with population evaluation. As in classical EA, number of generations to be evolved should be specified, parameter μ is introduced for representing number of generations using the surrogate model. Once the EA has identified optimum in the surrogate model, each individual of the population is evaluated using the real fitness function and the surrogate model is updated from previous real evaluations. In this way, the proposed algorithm is adopting a classical generational master-slave EA where each job is sent over the network using Scoop framework28. According to all previous discussions and adaptations, the algorithm used in this paper for tuning MiRAI framework is described in Algorithm 1 and is called Parallel GP model Assisted Binary Differential Evolution (PGPABDE).
In order to see the interest of surrogate model assisted EA, we compare the results of our algorithm (PGPABDE)
with a modified version of thereof where no surrogate model is used (only real and expensive evaluations are used), called Parallel Binary Differential Evolution (PBDE). In that case, the number of surrogate generations μ is set to 0. Both algorithms were executed 9 times so as to obtain a fair comparison. The experimentations took place on the Interactive Computation Center of Nice Sophia-Antipolis University (Cluster for Education and Research of University Nice Sophia-Antipolis). Each of them were deployed on 3 nodes (48 cores) dealing with 50 individuals in the EA population over t = 50 generations. For accelerating the computation time, the 9 runs were divided into 3 parallel tasks. Finally, the experimentations used 18 nodes (288 cores) during approximately 11 days.
Results and Discussion
MiRAI configured with the evolutionary algorithm.
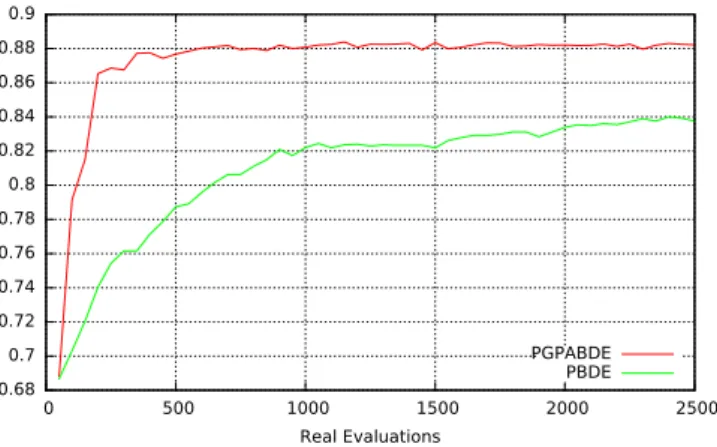
MiRAI configuration has been optimized using algorithm 1 with parameter values described in Table 2. Results from experiments are averaged from all the inde-pendent runs and are depicted on the Supplementary Figs S1 and S2 which present the best, average and worst population fitness evolution for each experiment using PGPABDE and PBDE respectively. EA generation is tradi-tionally considered as the time line for showing EA’s behavior. But, when considering expensive fitness function, the number of evaluations is preferred. It is also preferred for comparing both experiments. We can see that initial EA population is correctly balanced between good (around 0.87 in average) and bad (around 0.49) configurations. It is also worth noting that EA initialization was pretty good since best individuals in earlier steps are close to the optima found in average. It can be observed that the whole population of PBDE algorithm is converging more slowly than the PGPABDE algorithm but towards a similar optima (around 0.9 in average). When considering computa-tional time (not depicted on figures), the average time used for training and evaluating 50 MiRAI configurations over one generation is about 110 minutes. In average, the 100 surrogate generations made after each real evaluation took 7 minutes (including the time for outputting logs). Figure 2 shows the average fitness of EA population during real evaluations. PGPABDE rapidly converges towards a score of 0.88 in average and stagnates around this optima after only 500 real evaluations while PBDE painfully reached 0.84 in average with 2500 real evaluations. We can see that using a surrogate model allows to reach better configurations with less real evaluations. When considering the best individual of EA population represented in Fig. 3, a score of 0.895 is reached with 1000 real evaluations using PGPABDE whereas it is necessary to wait for almost 2000 real evaluations using PBDE. Among all 9 runs, the best MiRAI configuration reaches the score of 0.903651231 after 1750 real evaluations using PGPABDE. On the opposite, the best configuration using PBDE was 0.899642612 after 2000 real evaluations.An analysis of the best individual, i.e. the best MiRAI parametrization, found by PGPABDE algorithm reveals that, in addition to disease associations, only data relative to family, neighbor miRNAs and target genes are used (bits 1, 2, 3 of the encoding vector described in Table 1). Interestingly, none of the plain text sources of data were used. The encoding vector indicates that data relative to the associations with target genes have to be weighted with the Network Based Inference method (bit 7 described in Table 1). Diseases associated with miRNAs are first inferred from the data (bit 11 described in Table 1). Then, a similarity measure is performed between diseases and 3 cutoffs are used to discretize the value obtained. The optimal cutoffs encoded into the best individual are the fol-lowing: 0.05, 0.25 and 0.65. Concerning the dimension of the reduced space, the EA confirmed the optimal value of 400 that was previously used with MiRAI. Eventually, the searched disease is extended with all the subsumed diseases before querying the latent space (bit 35 described in Table 1).
Evaluation of prediction performance.
To evaluate the ability of our method to predict disease-miRNA associations, a five-fold cross-validation is performed. For a specific disease d, the dataset is randomly partitioned into five equal-sized subsets. Four of five subsets are used to create the latent space, while the omitted subset is retained for querying and testing the model. During the latter test, all associations between miRNAs and d are removed before the update of the MD matrix with similarity data. The cross-validation process is then repeated five times, with each of the five subsets used exactly once as the validation data.The latent space is then queried for the disease d to obtain a ranked list of miRNAs. The higher the miRNAs associated with d are ranked, the better the performance is.
The MiRAI software tuned with PGPABDE was tested on the 83 human diseases stored in the human miRNA-disease database (HMDD)29, that are associated with at least 20 miRNAs. The average AUC value obtained is 0.897 with a minimum of 0.713 for Lupus Vulgaris and a maximum of 0.986 for Hypertrophy.
The precisions obtained at several levels of recall for the set of 83 diseases are given in Fig. 4 (red bars). The precision decreases for higher level of recall. It is just below 0.8 (0.7802) for a recall rate of 30%. The R-precision measure is a way to obtain comparable results when the number of true associations is very different (as this is
Figure 3. Best population fitness during MiRAI optimization (average on 9 independent runs).
the case in this work). It is defined as the precision obtained for the top R results, with R equals to the number of microRNAs associated with the disease30. For the 83 diseases, the R-precision of our method is equals to 0.625.
Comparison with other methods.
A majority of diseases are associated with few miRNAs. In the litera-ture, the performances of miRNA-disease association methods were often based on a set of 15 diseases that are associated with the largest number of miRNAs.We compared our method with our previous manually configured version of MiRAI10 and 6 other methods applied on the same set of 15 human diseases associated with numerous miRNAs (Table 3). The AUC obtained by our tool range from 0.825 to 0.926 with an average AUC value of 0.880. The performance is slightly better than other methods and our previous manually configured version of MiRAI (AUC scores ranging from 0.796 to 0.928 with an average of 0.867).
The improvement brought by the tuning of MiRAI using an EA is more significative if we compare the results obtained for all 83 diseases, since the average AUC jumps from 0.867 to 0.897 (Supplementary Table S1). This result is not surprising because the EA has been designed with the goal of maximizing this value.
The precisions obtained at several levels of recall for the set of 15 diseases are given in Fig. 4 (green bars). At 10% recall, the precision is 0.903. It is still above 0.8 (0.805) at 40% recall meaning that the method retrieves a sig-nificant proportion of associations with a good precision. The R-precision measured for the 15 diseases associated with numerous miRNAs is 0.691.
The performance of our method cannot be easily compared with methods that are able to perform predictions with few or even no annotation. However, we can state that MiRAI, even optimized with EA, is outclassed by recent methods such as NCPMDA7 that exhibits an AUC score of 0.9173 (althought calculated with leave-one-out cross validation and not a 5-fold validation), or PBMDA8 with an AUC score of 0.9172. Our method is also clearly far behind ensemble-based method combining the predictions of multiple algorithms that reach an impressive AUC score of 0.9226.
Our method nevertheless obtains good results. It is not capable of performing predictions with few existing annotations but it allows to highlight potential false associations contained in the miRNA-disease association databases.
Detection and correction of mis-annotations.
Identifying miRNAs and diseases whose associations are reported in HMDD and that are represented by very distant vectors in the vector space (indicating dissimilarities) allows to highlight putative false associations. With our method, we identified 86 associations with a significant score of invalidation (Supplementary Table S2). A manual step of confirmation was undergone by checking the associated publications of each association. The associations miRNA/disease used from the reference database must correspond to the comparison of miRNA expression between healthy and sick cases in Human. Among associations highlighted by the invalidation process of MiRAI, more than half (57%) comes from works that study the effect of molecules or treatments on cancer cells31–33 or the evolution of miRNA expression in the cancer progression34, 35. 19% of infirmed associations are linked with research based on circulating miRNAs. Although miRNAs contained in serum or blood represent tremendous potential biomarkers, they are currently contested by a part of the scientific community36. Pending further results, we have preferred to omit the data from works on circulating miRNAs. The rest of invalidations corresponds to control problems (like the use of control cells from a sick patient)37, 38, the automated retrieval of data from tables without taking account of statistical scores39Disease name RWRMDA
74 2012 Chen et al. 75 2013 HDMP 76 2013 RLSMDA 77 2014 MIDP 78 2015 Liu et al. 4 2016 MiRAI 10 2016 MiRAI + EA 2017
Acute myeloid leukemia 0.839 0.716 0.858 0.853 0.913 0.871 0.895 0.906 Breast neoplasms 0.785 0.653 0.801 0.832 0.838 0.826 0.864 0.858 Colorectal neoplasms 0.793 0.662 0.802 0.831 0.845 0.833 0.864 0.868 Glioblastoma 0.68 0.607 0.7 0.714 0.786 0.839 0.898 0.872 Heart failure 0.722 0.761 0.77 0.738 0.821 0.812 0.796 0.847 Liver carcinoma 0.749 0.613 0.759 0.794 0.807 0.802 0.808 0.825 Lung neoplasms 0.827 0.606 0.835 0.855 0.876 0.925 0.904 0.926 Melanoma 0.784 0.642 0.79 0.807 0.837 0.834 0.849 0.875 Ovarian neoplasms 0.882 0.644 0.884 0.909 0.923 0.896 0.874 0.906 Pancreatic neoplasms 0.871 0.684 0.895 0.887 0.945 0.901 0.928 0.925 Prostatic neoplasms 0.823 0.629 0.854 0.841 0.882 0.842 0.871 0.872 Renal cell carcinoma 0.815 0.627 0.833 0.839 0.862 0.815 0.869 0.882 Squamous carcinoma 0.819 0.676 0.82 0.849 0.87 0.872 0.883 0.888 Stomach neoplasms 0.779 0.628 0.787 0.797 0.821 0.798 0.815 0.848 Bladder neoplasms 0.821 0.632 0.85 0.845 0.897 0.851 0.884 0.900
AVERAGE AUC 0.800 0.652 0.816 0.826 0.862 0.848 0.867 0.880
Table 3. Prediction results for diseases associated with the largest number of miRNAs. The AUC scores of
MiRAI configured with an evolutionary algorithm (MiRAI + EA) are compared with the scores of manually configured MiRAI and 6 other methods.
and bioinformatics predictions40. Only 8 infirmed associations could not be explained by the reading of publica-tions41–47. One association could not be checked because the originated publication is entirely in Chinese48.
After the manual-checking step, confirmed invalidations were removed from the reference database to increase the prediction success.
Evaluation of predictions quality.
We executed a version of MiRAI tuned with the parameters given by the evolutionary algorithm on the updated list of miRNA-disease associations.For the 15 important diseases listed in Table 3, we obtained an average AUC value of 0.889, which is a sig-nificative improvement compared to the scores obtained with HMDD (Supplementary Table S3). The improve-ment was, however, less by considering all diseases. Now, the average score is 0.898, compared to 0.897 previously obtained (Supplementary Table S4). These are nevertheless excellent scores that characterize a very good classifier.
mir-188 and mir-765 are predicted to play a role in several diseases.
From the revised reference database, MiRAI found 126 potential new associations between miRNAs and diseases (Supplementary Table S5). Since HMDD is upgraded manually, we performed a manual-checking step of these associations in order to control if a recent publication was already released and explains the results. 54 of our predictions were indeed discovered in the last two years (confirmed associations are highlighted in green in Supplementary Table S5).Among the 72 remaining putative associations, most of them imply mir-188 and mir-765 with several diseases (32 and 21 respectively) (Supplementary Table S6).
Mir-188 is a 21-nucleotide element located in the human genome on the X chromosome (50003503–50003588 +). It was first isolated in 2003 from kidney of mice by Tuschl’s team in Germany49. Mir-188 dysregulation is reported in various diseases such as Alzheimer’s disease50, 51, azoospermia52, breast cancer53, some carcinoma54–56, leukemia57, 58, infarction59, myeloma60, pre-eclampsia61 and prostate cancer62. Mir-188 takes part in the cell cycle maintenance (cell proliferation, G1/S cell cycle transition, tumor colony formation) by targeting genes implied in the cell cycle checkpoints (CCND1, CCND3, CCNE1, CCNA2, CDK4 and CDK2)63. Its role was also shown in cellular epigenetic processes52 (histone code) and in protein synthesis activation63. Our analysis reveals its poten-tial implications in at least 32 other diseases, including cardiovascular diseases, neural disorders and autoimmune diseases. Its action on key fundamental cell functions may explain its potential implication in such a large range of diseases (Fig. 5).
Mir-765 is a 21-nucleotide element located in the human genome on the first chromosome (156936131– 156936244 −). It was first isolated in 2006 from human embryonic and primary cells by Cuppen’s team in The Netherlands64. mir-765 is reported inhibiting the phosphorylation of eNOS65 and ERK/Akt/AMPK signalling by targeting the apelin66, an endogenous ligand of G-protein. Mir-765 also interferes with the MAPK pathway by repressing the neurotrophic receptor tyrosine kinase67. These pathways are involved in the regulation of cell cycle induced by an external stimulus (blocking of cell-cycle progression at the G2/M transition, cell migration and invasion). Mir-765 decreases the level of HMGA168, a non-histone chromatin protein involved in the regulation of DNA-dependent 3R processes (replication, recombination and repair). It is implied in many diseases: oligoas-thenozoospermia69, hepatocellular carcinoma70, failing heart71 and breast72, prostate68 and rectal cancers73. Our predictions report a potential link of mir-765 with 21 diseases, including neural disorders, cardiovascular dis-eases, rheumatoid, various lymphoma and carcinoma, leukaemia, liver cirrhosis and female reproductive system cancers (Fig. 5).
Conclusion and Perspectives
The cancer is a multi-step disease. The accumulation of mutational events on DNA during a life may conduct to the emergence of a cancer. These events are sorted in two categories according to their origins: environmental (e.g. cigarette smoke, radioactivity, alcohol, etc.) and intrinsic (e.g. DNA replication error, genetic heritage, reac-tive oxygen species, etc.). Statistically, we will develop at least 3 polyps (benign gut cancers) in our human life.
In the 1990s, scientists discovered the presence of small genetic elements in DNA samples of worms and called them micro-RNA. For many years, these elements have ended up in the bottom of electrophoresis tanks without
ever being analyzed and yet researchers showed their implication in various metabolic pathways (gene regulation, epigenetics, mitosis, etc.) as well as in diseases (cancers, Alzheimer’s syndrome, heart failure, etc.).
We designed MiRAI, a method based on distributional semantics to predict associations between miRNAs and diseases. Parameters of MiRAI were tuned using an evolutionary algorithm and the performances of the method were increased by 32%. Application of MiRAI on HMDD data highlighted potential new associations between miRNAs and diseases. Among them, mir-188 and mir-765 present the most of new predictions with diseases, and could be ubiquitous biomarkers of some diseases. These two miRNA are known to be linked with several main biological processes and pathways such as cell cycle or epigenetics. More investigations in laborato-ries are needed to confirm these hypotheses. MiRAI has also been used to highlight potential false associations contained in the miRNA-disease association databases.
The increase of works on miRNAs leads to the development of microRNA-based biotechnology mainly for human health purposes. Two major axes are currently conducted: one on the early diagnosis and the other on the gene therapy.
Most of publications referring to miRNA present observations of miRNA expression between healthy and sick cases. miRNA deregulations are shown in various diseases such as cancers or neural disorders. miRNA patterns appears to be interesting biomarkers of syndromes or their evolution/aggravation. The holy grail of this develop-ment is to use signatures of circulating miRNAs from blood or lymph samples, which are less invasive than tissue biopsies.
Several miRNAs were identified as tumor suppressor or playing key roles in sickness. Among them, some have an expression level reduced or lost in virtually. A supply with miRNA mimics in cells could prevent or cure these diseases. Moreover, unlike current cancer treatments that focus on one or two oncogenes, miRNAs generally target several genes and could be a generic solution to handle several public health problems. A huge R&D effort on drug delivery methods is, however, yet to achieve.
MiRAI fits perfectly into this dynamic of innovation by carrying concrete solutions to R&D purposes of this domain:
1. Increase the chances to discover new associations;
2. Help scientists to focus on targets with strong potentials for success; 3. And quantify the coherence of a discovery according all available data.
Moreover, with the rise of data on miRNA and dedicated databases, the efficiency and the accuracy of predic-tion solupredic-tions like MiRAI will continue to improve year after year.
References
1. Bartel, D. P. Micrornas: Genomics, biogenesis, mechanism, and function. Cell 116, 281–297 (2004).
2. Zou, Q., Li, J., Song, L., Zeng, X. & Wang, G. Similarity computation strategies in the microRNA-disease network: A survey. Briefings
in Functional Genomics 15, 55–64 (2016).
3. Zeng, X., Zhang, X. & Zou, Q. Integrative approaches for predicting microRNA function and prioritizing disease-related microRNA using biological interaction networks. Briefings in Bioinformatics 17, 193–203 (2016).
4. Liu, Y., Zeng, X., He, Z. & Zou, Q. Inferring microRNA-disease associations by random walk on a heterogeneous network with multiple data sources. IEEE/ACM Transactions on Computational Biology and Bioinformatics 5963, 1–1 (2016).
5. Yu, H., Chen, X. & Lu, L. Large-scale prediction of microRNA-disease associations by combinatorial prioritization algorithm.
Scientific reports 43792 (2017).
6. Missiuro, P. V. et al. Information Flow Analysis of Interactome Networks. PLoS Computational Biology 5 (2009).
7. Gu, C., Liao, B., Li, X. & Li, K. Network Consistency Projection for Human miRNA-Disease Associations Inference. Scientific
Reports 6, 36054 (2016).
8. You, Z. H. et al. PBMDA: A novel and effective path-based computational model for miRNA-disease association prediction. PLoS
Computational Biology 13 (2017).
9. van Laarhoven, T., Nabuurs, S. B. & Marchiori, E. Gaussian interaction profile kernels for predicting drug-target interaction.
Bioinformatics 27, 3036–3043 (2011).
10. Pasquier, C. & Gardès, J. Prediction of miRNA-disease associations with a vector space model. Scientific Reports 6, 27036 (2016). 11. Turney, P. D. & Pantel, P. From Frequency to Meaning: Vector Space Models of Semantics. Journal of Artificial Intelligence Research
37, 141–188 (2010).
12. Deerwester, S., Dumais, S. T., Furnas, G. W., Landauer, T. K. & Harshman, R. Indexing by Latent Semantic Analysis. Journal of the
American Society for Information Science 41, 391–407 (1990).
13. Salton, G., Yang, C. S. & Yu, C. T. A theory of term importance in automatic text analysis. Journal of the American Society for
Information Science 26, 33–44 (1975).
14. Zhou, T., Ren, J., Medo, M. & Zhang, Y. C. Bipartite network projection and personal recommendation. Physical Review E -
Statistical, Nonlinear, and Soft Matter Physics 76, 1–7 (2007).
15. Bandyopadhyay, S., Mitra, R., Maulik, U. & Zhang, M. Development of the human cancer microrna network. Silence 1, 6 (2010). 16. Baskerville, S. & Bartel, D. P. Microarray profiling of microRNAs reveals frequent coexpression with neighboring miRNAs and host
genes. RNA (New York, NY) 11, 241–247 (2005).
17. Lasko, T. A., Bhagwat, J. G., Zou, K. H. & Ohno-Machado, L. The use of receiver operating characteristic curves in biomedical informatics. Journal of Biomedical Informatics 38, 404–415 (2005).
18. Siddique, N. & Adeli, H. Nature inspired computing: An overview and some future directions. Cognitive Computation 7, 706–714 (2015).
19. Bartz-Beielstein, T., Branke, J., Mehnen, J. & Mersmann, O. Evolutionary algorithms. Wiley Interdisciplinary Reviews: Data Mining
and Knowledge Discovery 4, 178–195 (2014).
20. Storn, R. & Price, K. Differential evolution: A simple and efficient heuristic for global optimization over continuous spaces. Journal
of Global Optimization 11, 341–359 (1997).
21. Wang, L., Fu, X., Menhas, M. I. & Fei, M. A Modified Binary Differential Evolution Algorithm, 49–57 (Springer Berlin Heidelberg, Berlin, Heidelberg, 2010).
22. Emmerich, M., Giannakoglou, K. & Naujoks, B. Single- and multiobjective evolutionary optimization assisted by gaussian random field metamodels. IEEE Transactions on Evolutionary Computation 10, 421–439 (2006).
23. Jin, Y. A comprehensive survey of fitness approximation in evolutionary computation. Soft Computing 9, 3–12 (2005).
24. Buche, D., Schraudolph, N. N. & Koumoutsakos, P. Accelerating evolutionary algorithms with gaussian process fitness function models. Trans. Sys. Man Cyber Part C 35, 183–194 (2005).
25. Fonseca, L. G., Barbosa, H. J. C. & Lemonge, A. C. C. On Similarity-Based Surrogate Models for Expensive Single- and Multi-objective
Evolutionary Optimization, 219–248 (Springer Berlin Heidelberg, Berlin, Heidelberg, 2010).
26. Rasmussen, C. E. Gaussian Processes in Machine Learning, 63–71 (Springer Berlin Heidelberg, Berlin, Heidelberg, 2004). 27. Lewis, R. M., Torczon, V. & Trosset, M. W. Direct search methods: then and now. Journal of Computational and Applied Mathematics
124, 191–207, Numerical Analysis 2000. Vol. IV: Optimization and Nonlinear Equations (2000).
28. Hold-Geoffroy, Y., Gagnon, O. & Parizeau, M. Once you scoop, no need to fork. In Proceedings of the 2014 Annual Conference on
Extreme Science and Engineering Discovery Environment, 60 (ACM, 2014).
29. Li, Y. et al. HMDD v2.0: A database for experimentally supported human microRNA and disease associations. Nucleic Acids Research
42, 1070–1074 (2014).
30. Manning, C. D., Raghavan, P. & Schütze, H. Introduction to Information Retrieval (Cambridge University Press, New York, NY, USA, 2008).
31. Findlay, V. J., Turner, D. P., Moussa, O. & Watson, D. K. MicroRNA-mediated inhibition of prostate-derived Ets factor messenger RNA translation affects prostate-derived Ets factor regulatory networks in human breast cancer. Cancer research 68, 8499–506 (2008).
32. Tang, D. et al. The expression and clinical significance of microRNA-1258 and heparanase in human breast cancer. Clinical
biochemistry 46, 926–32 (2013).
33. Yamamoto, Y. et al. An integrative genomic analysis revealed the relevance of microRNA and gene expression for drug-resistance in human breast cancer cells. Molecular cancer 10, 135 (2011).
34. Kumar, S. et al. MicroRNA signature of cis-platin resistant vs. cis-platin sensitive ovarian cancer cell lines. Journal of ovarian research
4, 17 (2011).
35. Pizzimenti, S. et al. MicroRNA expression changes during human leukemic HL-60 cell differentiation induced by 4-hydroxynonenal, a product of lipid peroxidation. Free radical biology & medicine 46, 282–8 (2009).
36. Jarry, J., Schadendorf, D., Greenwood, C., Spatz, A. & van Kempen, L. C. The validity of circulating microRNAs in oncology: five years of challenges and contradictions. Molecular oncology 8, 819–29 (2014).
37. Sato, F. et al. MicroRNA profile predicts recurrence after resection in patients with hepatocellular carcinoma within the Milan Criteria. PloS one 6, e16435 (2011).
38. Sun, Y. et al. Expression of miR-150 and miR-3940-5p is reduced in non-small cell lung carcinoma and correlates with clinicopathological features. Oncology reports 29, 704–12 (2013).
39. Thum, T. et al. MicroRNAs in the human heart: a clue to fetal gene reprogramming in heart failure. Circulation 116, 258–67 (2007). 40. Zhou, C. et al. A miR-1231 binding site polymorphism in the 3′UTR of IFNAR1 is associated with hepatocellular carcinoma
susceptibility. Gene 507, 95–8 (2012).
41. Eisenberg, I. et al. Distinctive patterns of microRNA expression in primary muscular disorders. Proceedings of the National Academy
of Sciences of the United States of America 104, 17016–21 (2007).
42. Erdogan, B. et al. Diagnostic microRNAs in myelodysplastic syndrome. Experimental hematology 39, 915–926.e2 (2011). 43. Giricz, O. et al. Hsa-miR-375 is differentially expressed during breast lobular neoplasia and promotes loss of mammary acinar
polarity. The Journal of pathology 226, 108–19 (2012).
44. Hawkins, S. M. et al. Functional microRNA involved in endometriosis. Molecular endocrinology (Baltimore, Md.) 25, 821–32 (2011). 45. Ito, T. et al. Polo-like kinase 1 regulates cell proliferation and is targeted by miR-593* in esophageal cancer. International journal of
cancer 129, 2134–46 (2011).
46. Li, Z. et al. miR-495 and miR-551a inhibit the migration and invasion of human gastric cancer cellLaskos by directly interacting with PRL-3. Cancer letters 323, 41–7 (2012).
47. Wang, R.-j et al. MicroRNA-873 (miRNA-873) inhibits glioblastoma tumorigenesis and metastasis by suppressing the expression of IGF2BP1. The Journal of biological chemistry 290, 8938–48 (2015).
48. Wang, P., Fu, T., Wang, X. & Zhu, W. Primary, study of miRNA expression patterns in laryngeal carcinoma by microarray. Lin chuang
er bi yan hou tou jing wai ke za zhi = Journal of clinical otorhinolaryngology, head, and neck surgery 24, 535–8 (2010).
49. Lagos-Quintana, M., Rauhut, R., Meyer, J., Borkhardt, A. & Tuschl, T. New microRNAs from mouse and human. RNA (New York,
NY) 9, 175–9 (2003).
50. Lee, K. et al. Replenishment of microRNA-188-5p restores the synaptic and cognitive deficits in 5XFAD Mouse Model of Alzheimer’s Disease. Scientific reports 6, 34433 (2016).
51. Zhang, J., Hu, M., Teng, Z., Tang, Y.-P. & Chen, C. Synaptic and cognitive improvements by inhibition of 2-AG metabolism are through upregulation of microRNA-188-3p in a mouse model of Alzheimer’s disease. The Journal of neuroscience: the official journal
of the Society for Neuroscience 34, 14919–33 (2014).
52. Song, W.-Y. et al. Reduced microRNA-188-3p expression contributes to apoptosis of spermatogenic cells in patients with azoospermia. Cell proliferation 50, 4953–62 (2017).
53. Hamam, R. et al. microRNA expression profiling on individual breast cancer patients identifies novel panel of circulating microRNA for early detection. Scientific reports 6, 25997 (2016).
54. Fang, F. et al. MicroRNA-188-5p suppresses tumor cell proliferation and metastasis by directly targeting FGF5 in hepatocellular carcinoma. Journal of hepatology 63, 874–85 (2015).
55. Pichler, M. et al. Genome-Wide miRNA Analysis Identifies miR-188-3p as a Novel Prognostic Marker and Molecular Factor Involved in Colorectal Carcinogenesis. Clinical cancer research: an official journal of the American Association for Cancer Research 6, 25997 (2016).
56. Wang, L. & Liu, H. microRNA-188 is downregulated in oral squamous cell carcinoma and inhibits proliferation and invasion by targeting SIX1. Tumour biology: the journal of the International Society for Oncodevelopmental Biology and Medicine 37, 4105–13 (2016).
57. Chakraborty, C. et al. MicroRNAs mediated regulation of MAPK signaling pathways in chronic myeloid leukemia. Oncotarget 7, 42683–42697 (2016).
58. Jinlong, S., Lin, F., Yonghui, L., Li, Y. & Weidong, W. Identification of let-7a-2-3p or/and miR-188-5p as prognostic biomarkers in cytogenetically normal acute myeloid leukemia. PloS one 10, e0118099 (2015).
59. Wang, K. et al. APF lncRNA regulates autophagy and myocardial infarction by targeting miR-188-3p. Nature communications 6, 6779 (2015).
60. Bi, C. et al. Genome-wide pharmacologic unmasking identifies tumor suppressive microRNAs in multiple myeloma. Oncotarget 6, 26508–18 (2015).
61. Yang, S., Li, H., Ge, Q., Guo, L. & Chen, F. Deregulated microRNA species in the plasma and placenta of patients with preeclampsia.
Molecular medicine reports 12, 527–34 (2015).
62. Zhang, H. et al. miR-188-5p inhibits tumour growth and metastasis in prostate cancer by repressing LAPTM4B expression.
Oncotarget 6, 6092–104 (2015).
63. Wu, J. et al. MicroRNA-188 suppresses G1/S transition by targeting multiple cyclin/CDK complexes. Cell communication and
64. Berezikov, E. et al. Many novel mammalian microRNA candidates identified by extensive cloning and RAKE analysis. Genome
research 16, 1289–98 (2006).
65. Ho, J. J. D. et al. Active stabilization of human endothelial nitric oxide synthase mRNA by hnRNP E1 protects against antisense RNA and microRNAs. Molecular and cellular biology 33, 2029–46 (2013).
66. Liao, Y.-C. et al. MicroRNA-765 influences arterial stiffness through modulating apelin expression. Molecular and cellular
endocrinology 411, 11–9 (2015).
67. Muiños-Gimeno, M. et al. Allele variants in functional MicroRNA target sites of the neurotrophin-3 receptor gene (NTRK3) as susceptibility factors for anxiety disorders. Human mutation 30, 1062–71 (2009).
68. Leung, Y.-K. et al. Hsa-miRNA-765 as a key mediator for inhibiting growth, migration and invasion in fulvestrant-treated prostate cancer. PloS one 9, e98037 (2014).
69. Abu-Halima, M. et al. Altered micro-ribonucleic acid expression profiles of extracellular microvesicles in the seminal plasma of patients with oligoasthenozoospermia. Fertility and sterility 106, 1061–1069.e3 (2016).
70. Xie, B.-H. et al. Mir-765 promotes cell proliferation by downregulating INPP4B expression in human hepatocellular carcinoma.
Cancer biomarkers: section A of Disease markers 16, 405–13 (2016).
71. Cai, W.-F. et al. Up-regulation of micro-RNA765 in human failing hearts is associated with post-transcriptional regulation of protein phosphatase inhibitor-1 and depressed contractility. European journal of heart failure 17, 782–93 (2015).
72. Lv, J. et al. miRNA expression patterns in chemoresistant breast cancer tissues. Biomedicine & pharmacotherapy = Biomedecine &
pharmacotherapie 68, 935–42 (2014).
73. Della Vittoria Scarpati, G. et al. A specific miRNA signature correlates with complete pathological response to neoadjuvant chemoradiotherapy in locally advanced rectal cancer. International journal of radiation oncology, biology, physics 83, 1113–9 (2012). 74. Chen, X., Liu, M.-X. & Yan, G.-Y. RWRMDA: predicting novel human microRNA–disease associations. Molecular BioSystems 8,
2792 (2012).
75. Chen, H. & Zhang, Z. Prediction of associations between OMIM diseases and MicroRNAs by random walk on OMIM disease similarity network. The Scientific World Journal 2013 (2013).
76. Xuan, P. et al. Prediction of microRNAs Associated with Human Diseases Based on Weighted k Most Similar Neighbors. PLoS One
8 (2013).
77. Chen, X. & Yan, G.-Y. Semi-supervised learning for potential human microRNA-disease associations inference. Scientific reports 4, 5501 (2014).
78. Xuan, P. et al. Prediction of potential disease-associated microRNAs based on random walk. Bioinformatics (Oxford, England) 31, 1805–1815 (2015).
Acknowledgements
This work was granted access to the HPC and vizualization resources of the “Centre de Calcul Interactif” hosted by University Nice Sophia-Antipolis. The authors would also like to acknowledge Gérald Rocher, who critically proof-read the article.
Author Contributions
C.P., D.P. and J.G. conceived the study. C.P. and D.P. developed the method, C.P., D.P. and J.G. carried out the computational analysis, C.P. and J.G. analyzed the results, C.P., D.P. and J.G. wrote the manuscript. All authors reviewed the manuscript.
Additional Information
Supplementary information accompanies this paper at doi:10.1038/s41598-017-10065-y Competing Interests: The authors declare that they have no competing interests.
Publisher's note: Springer Nature remains neutral with regard to jurisdictional claims in published maps and
institutional affiliations.
Open Access This article is licensed under a Creative Commons Attribution 4.0 International
License, which permits use, sharing, adaptation, distribution and reproduction in any medium or format, as long as you give appropriate credit to the original author(s) and the source, provide a link to the Cre-ative Commons license, and indicate if changes were made. The images or other third party material in this article are included in the article’s Creative Commons license, unless indicated otherwise in a credit line to the material. If material is not included in the article’s Creative Commons license and your intended use is not per-mitted by statutory regulation or exceeds the perper-mitted use, you will need to obtain permission directly from the copyright holder. To view a copy of this license, visit http://creativecommons.org/licenses/by/4.0/.