Design, Construction and Testing of an Ocean Renewable Energy
Storage Scaled Prototype
By
James D. C. Meredith
B. Eng. Mechanical Engineering, McGill University (2009)
Submitted to the Department of Mechanical Engineering in partial fulfillment of the requirement for the degree of
Master of Science in Mechanical Engineering
at the
Massachusetts Institute of Technology
February 2012
0 2012 Massachusetts Institute of Technology. All rights reserved.
MASSACHUSETTS INSTIUTE OF TECHNOLOGY
FEB
16
2012
LIBRARIES
ARCHIVES
Signature of Author:Department of Mechanical Engineering January 6 h2012
Certified by:
Alexander H. Slocum Pappalardo Professor of Mechanical Engineering Thesis Supervisor
Accepted by:.
David E. Hardt Professor of Mechanical Engineering Chairman, Committee for Graduate Students
Design, Construction and Testing of an Ocean Renewable Energy
Storage Scaled Prototype
By
James D. C. Meredith
Submitted to the Department of Mechanical Engineering on January 20th, 2012 in Partial Fulfillment of the Requirements for the Degree of
Master of Science in Mechanical Engineering
Abstract
The concept for a new form of pumped storage hydro is being developed within the Precision Engineering Reseach Group at MIT: the Ocean Renewable Energy Storage (ORES) project. Large, hollow concrete spheres are created, fitted with a reversible pump-turbine and deployed to the sea floor. Water is then allowed to flow through the turbine, into the sphere, to produce power and power is stored back in the device by running the turbine backwards as a pump and evacuating the sphere. The first prototype of that concept is presented here. A land-based system was designed, built and tested to demonstrate its ability to store energy and test the viability of the manufacturing methods planned.
The device was successfully built and cycled, storing 2Wh of energy. The round-trip efficiency of the device was severely affected by the low efficiency of the scaled down rotating equipment. It was also found that casting a monolithic sphere is preferable to assembling multiple pieces and that the interior of the sphere should be maintained at atmospheric pressure via a vent line.
Thesis Supervisor: Alexander H. Slocum
Acknowledgements
I would like to acknowledge the following people for their help and support during the preparation of this document:
e Alex H. Slocum: His mentorship and continuous support made this work possible. Alex's insight into mechanical design and his dedication to the projects he is involved in are unparalleled and I am grateful for his help, guidance and hospitality. His relentless energy and passion for
technology are an inspiration and with him and others like him at MIT, the institute has a bright future ahead of it.
0 Bill Miskoe and Nishan Nahikian: Their services were instrumental in the creation of the prototype documented here. Bill Miskoe's shop was the battleground where the most of the fabrication was done and where the machine finally came together. Bill's experience, patience and creativity got the project over many of the hurdles it encountered. To Bill, I wish many more seasons of Miata racing and many more projects in the back yard.
* The team: Bruna Moscol, Greg Fennell, Gokhan Dundar and Brian Hodder. It was a privilege to work with such dedicated and capable people. I hope our paths cross again soon.
Table of Contents
Abstract
...
3
Acknow ledgem ents
...
5
Table of
onten
...
6
List of figures ...
8
List of Tables ...
12
Abbreviations and Acronym s
...
13
1 Introduction...
14
1.1 Motivation...14
1.2 Previous Studies...15
2
Energy storage ...
16
2.1 Grid scale Energy storage...16
2.2 Ocean energy storage...18
2 .2 .1 O ce an C A ES ... 18
2.2.2 PSH Ocean Storage...19
3oncep
Rne...
er ew
...
21
3.1 Prototype Concept Overview... 22
4
Design ...
23
4.1 Overall system design...23
4.2 Concrete Sphere...24 4.3 Hemisphere Joint ... 31 4.4 Mold...38 4.5 Turbine ... 44 4.6 Pump...54 4.7 Electrical ... 56 4 .7 .1 T u rbine C ircuit ... 57 4 .7 .2 P u m p circuit ... 5 8 4.8 Data Acquisition and sensors... 59
4.9 Piping ... 63
5
Build (Procedure)...
68
5.1 Concrete Hemispheres ... 68
5.3 Core drill... 72
5.4 Turbine Installation ... 73
5.5 Piping installation and manifold support...75
5.6 High Reservoir...77
5.7 Vacuum Sealing ... 78
5.8 Vents/ports and gas handling ... 79
6 Test...
80
6.1 Overview ... 80 6.2 Test procedure...80 6 .2 .1 Sta rt-up ... 8 0 6 .2 .2 V e nt lin e ... 8 1 6 .2 .3 N o V e nt Line ... 8 2 6 .2 .4 S h ut d o w n ... 8 3 6.3 Leak test ... 83 6.4 Turbine Tuning...85 6.5 Results...87 6 .5 .1 C a lcu latio n s ... 8 7 6 .5 .2 R e su lt .. ... 8 87 Conclusion
...
92
7.1 Lessons Learned:...92 7 .1 .1 Jo in t ... 9 2 7 .1 .2 M o ld ... 9 2 7 .1.3 P u m p/T u rbine ... 9 2 7.2 Future W ork...93 7.3 Closing Remarks...948
Bibliography
...
95
9 Appendices
...
97
9.1 Turbine Efficiency Chart...97
9.2 Additional Design Calculations...97
9.2.1 Pressure Drop Calculator ... 97
9.2.2 Piping Losses in the turbine piping system ... 100
9.3 Piping Diagram ... 101
List of figures
Figure 1: Comparison of Energy Storage Technologies. Source: Roberts, 2009 ... 16
Figure 2: Compressed air energy storage conceptual layout. Source: www.sandia.gov/media/NewsRel/NR2001/images/jpg/minebw.jpg... 17
Figure 3: Pumped Storage Hydro conceptual layout. Source: www.tva.gov/power/pumpstorart.htm... 18
Figure 4: Thin Red Line Inc.'s energy bags. Left: First wet test of the energy bag concept. Right: A larger untested bag. Source: http://www.thin-red-line.com/... 19
Figure 5: Artist's impression of Gottlieb Paludan Architects and Rise-DTU's Energy Island. Source: http://www.gottliebpaludan.dk/dk/menuprojekter/projektgpi/billeder/www/greenpowerisland.pdf...20
Figure 6: The German professors' depiction of undersea PSH. Source:faz.net... 20
Figure 7: Sim ple O RE S concept im age. ... 21
Figure 8 : 120 degree concrete sphere section. The red arrow on the scale at right indicates the yield strength of the concrete. This structure will fail in several locations... 25
Figure 9: 180 degree concrete sphere sections. While stress concentrations still exist with this geometry, there are no stresses above the yield strength of the concrete... ... 25
Figure 10: Radial and Hoop stress in the thick-walled spherical shell. ... 29
Figure 11: Maximum deployable depth for 25m spheres with varying wall thickness using both the thick-walled spherical shell model and the thin wall approximaiton ... 29
Figure 12 A concrete hemisphere fresh out of the mold. The pipe coupling can be seen embedded in the p o le ... 3 0 Figure 13: Annular channel with injection ports for epoxy injection... 31
Figure 14: Left: Annular channel with stud ports. Right: Cross section of the same. ... .... 32
Figure 15: Steel ring with welded studs used to create the epoxy channels. ... 33
Figure 16: The lower hemisphere with sealant applied and stud ports filled with epoxy... 35
Figure 17: The upper hemisphere prior to being joined with the lower hemisphere. The four studs are visible, protruding downward from the upper stud ports... ... 35
Figure 18: A ssem bled concrete sphere. ... 36
Figure 19: The open channel used to join the two hemispheres. Left: Cross section of the channel. Right: T he channel filled w ith epoxy... 37 Figure 20: The failed stud ports. Left: Separation between the concrete and the epoxy within the stud port. A gap around the edge is visible. Center: Weather stripping retains the epoxy. Right: The sealed stud port. ... 3 8
Figure 21: Early m odels of the m old. ... 39
Figure 22: M odel of the final m old... 39
Figure 23:Draft angle on the inner hemispherical mold. ... ... 41
Figure 24: Lifting on the inner steel hemisphere and the direction of loading. ... 42
Figure 25: FEA of the outer mold. Loading case based on lifting the sphere...43
Figure 26: Model of the pole assembly...44
Figure 27: A reversible pump/turbine. source: www.voithhydro.com ... 45
Figure 28 Available turbines capable of meeting the project requirements... 47
Figure 29: The LV750 fresh out of the box. The nozzle port is seen protruding from the left of the turbine casing. The generator is shown connected to the rectifier that was included with the turbine...48
Figure 30: Turbine efficiency as stated by the manufacturer... 49
Figure 31: Left: The turgo turbine runner and nozzle. Right: Several of the different nozzles used... 50
Figure 32: First iteration of the turbine draft tube... 51
Figure 33: 6 inch turbine draft tube. Model and completed installation...52
Figure 34: Model section view of the generator cap, showing the turbine casing, generator and cap. Coloured to distinguish the separate components... 53
Figure 35: Right: Model section view of the bulkhead fitting. Note that the fitting has three wires; one is not visible due to the sectioned view. Left: The completed bulkhead fitting (grey fitting at top) is shown fastened to the generator cap via a pipe coupling. ... 53
Figure 36: Pump performance curve as given by the manufacturer. ... 55
Figure 37: Left: A schematic drawing of the pump(l), motor coupling(3) and flange adapter(5). Right: T he pum p coupled to its m otor. ... 56
Figure 38: E lectrical system box...57
Figure 39:Left: The generator with its top cover and bearing removed. Right: The connection between the bulkhead fitting and the rectifier...57
Figure 40: Left: The TDK-Lambda Zup36V-24A. Source: datatec.de. Center: The external control connector on the rear panel of the power supply; the horizontal lines indicate jumpers between connecting ports. Source: User manual. Right: Connections on the rear panel of the power supply. Source: User m anu al.. . . . ... ... 59
Figure 4 1: U SB -6009 Source: ni.com ... 59
Figure 42: Internal layout of the USB-6009. Source: ni.com ... 60 9
Figure 43: Pressure transducers...61
Figure 44: Left: The FP-5603 shown without its pipe housing. The paddle wheel paddles can be seen at the bottom of the unit. Right: Wiring for the FP-5600 series of which the FP-5603 is a part...62
Figure 45: Locations of the sensors. PX indicates a pressure transducer. ... 62
Figure 46: Manufacturer's recommended length of straight pipe prior into and following the FP-5603 flow m eter...64
Figure 47: The first version of the single line drawing... 64
Figure 48: Left: Close-up of the turbine piping. Center and right: Close-up of the pump piping. ... 65
Figure 49: 3D model of the piping system close to the sphere. ... 66
Figure 50: The mold being filled with concrete. Mold release (engine oil) can be seen to darken the surfaces of the mold where contract with the concrete will occur. Bolts holding the mold to the vibration table can be seen bottom right...69
Figure 51: The studded steel ring being pressed into the concrete. The plastic wrap used in attempts to seal the backer rod can be seen on the stud in the foreground. This plastic wrap caused several problems during assem b ly...70
Figure 52: Lifting a concrete hem isphere. ... 70
Figure 53: The assembled concrete sphere being manipulated through the use of nylon slings. Left: A tractor lifts the sphere. Right: The sphere is rotated through successive lifts with a chain fall...71
Figure 54: T he core drill in action. ... 72
Figure 55: Core drill results. Left: The enlarged hole in the sphere. Right: The core resulting from the drilling process. The pipe coupling used previously can be seen embedded in the centre. ... 73
Figure 56: The com pleted turbine assem bly. ... ... 74
Figure 57: A wooden structure provides support for the valve assembly...75
Figure 58: The completed piping assembly. Left: "No Vent line" case testing. Right: "Vent line" testing. Notice that the vacuum pump is not connected to the system for this test. ... 76
Figure 59: The high reservoir shown behind the completed system...77
Figure 60: The vacuum pum p...78
Figure 61: Results of a leak rate test. The pressure in the draft tube was measured for over 10 minutes after the system had been brought to 9 kPa internal pressure. Linear regression yielded the equation shown. The leak rate was 4.21 Pa/s or 0.253kPa/m in... ... ... 85
Figure 62: Energy recovered by the turbine using various nozzle sizes... 86
Figure 63: Turbine power output using a 12.7mm nozzle with various load resistances applied...87 10
Figure 64: Energy stored and discharged for all tests. ... 89
Figure 65: Typical charge and discharge power curves during a "vent line" test cycle. ... 90
Figure 66: Typical charge and discharge power curves during a "no vent line" test cycle. ... 90
Figure 67: Storage Vessel. Left: Size comparison. Right: Cut-away showing wall cross section... 94
Figure 68: The pressure drop calculator spreadsheet... 98
Figure 69: T urbine C ircuit ... 103
List of Tables
Table 1: Eyer and Corey's "Five Categories of Energy Storage Applications" ... 15
T able 2: B uoyancy C alculations ... 26
Table 3 Calculation of maximum deployable depth ... 28
Table 4: Pressure drop of epoxy during injection. ... 34
T able 5: Lifting eye calculations...42
Table 6: Minimum specifications for the turbine unit (shown in red).Values used to estimate the specifications are show n in black...46
Table 7: Flow rates for various nozzle sizes in the LV750 micro-hydro turbine. Source: Hydro Induction P o w er ... 4 9 Table 8: Pump performance requirements... 55
Table 9: Connections to the data acquisition module. ... 60
Table 10: Example calculations of the piping losses in the pump system near the sphere using % inch size threaded pipe fittings. Black numbers are inputs and red numbers are calculated. ... 67
Table 11: The total pressure loss estimated for the pump piping system near the sphere. The price, in the right-most column, is the price of a typical brass ball valve in that size from McMaster Carr Supply C om p an y ... 6 7 Table 12: Turbine piping system pressure loss for various pipe sizes... 68
Table 13: Summary of piping losses for the hose connecting the near-sphere piping system to the high reserv o ir. ... 6 8 Table 14: Equations used to determine energy flows for a given test...88
Table 15: Detailed results comparing the "vent line" and "no vent line" cases... ... 91
Table 16: Overall specifications of the 3m concrete sphere. ... 93
Table 17: Estimated turbine piping system losses. This is an example calculation. For each pipe size, the internal diameter is entered as the hydraulic diameter, Dh , and the calculations are completed... 100
Abbreviations and Acronyms
A AC AWG CAES DC d K LRA p pf Ps g H n NPTQ
P PSH p po V I a S FOS R r ri r, V VIW
External pressure Voltage Electrical current Stress Material strength Factor of safetyRatio of maximum to mini Radius
Inner radius of the sphere Outer radius of the sphere Volts
Virtual Instrument Watts
mum stress in cyclic loading Amperes
Alternating current American wire gauge
Compressed air energy storage Direct current
Depth
Minor loss coefficient Locked rotor amperage Density
Density of fresh water: 1000kg/m3 Density of seawater: 1025kg/m3 Gravity: 9.81 m/s2
Head height
Rotational speed in revolutions per minute (rpm) National pipe thread
Flow rate Power
Pumped Storage Hydro Pressure
1 Introduction
1.1 Motivation
Renewable energy sources have increased grid integration costs and cause increase loading on fast-response generation capacity because of their intermittent nature. Energy storage has the potential to reduce that intermittency. As renewable power increases its contribution to the grid, energy storage will become increasingly important. In the limit where all power is supplied by renewable sources, a significant amount of energy storage would be needed to bridge the inherent gaps, or curtailments, in power output (Corbus et al, 2009).
While fast-response energy storage technology has its uses, storage methods with longer discharge times and greater amounts of energy stored are needed for widespread grid integration. A majority of the potential applications for storage require several hours of discharge time (Eyer & Corey, 2010).
In addition to the enabling effects of storage on renewable energy sources, a number of benefits have been identified that individually allow economics gains to be made. Eyer & Corey of Sandia National
Laboratory have compiled a list of applications for storage and have elaborated on the benefits provided in serving these applications. The list is shown below in Table 1.
It should also be noted that this work is in the wake of a detailed economic analysis by Gregory Fennell (2011) in which the economics of offshore energy storage were evaluated as they relate to the concept described here and deemed favourable.
1. Electric Energy Time-shift 2. Electric Su I Ca acit c 3. Load Following
4. Area Regulation
5. Electric Supply Reserve Capacity
7. Transmission Support
8. Transmission Congestion Relief
9. Transmission & Distribution (T&D) Upgrade Deferral 10. Substation On-site Power
11. Time-of-use (TOU) Energy Cost Management 12. Demand Charge Management
13. Electric Service Reliability
14. Electric Service Power S alit 15. Renewables Energy Time-shift 16. Renewables Capacity Firming 17. Wind Generation Grid Integration
Table 1: Eyer and Corey's "Five Categories of Energy Storage Applications"
1.2 Previous Studies
The ORES project was started by Alexander H. Slocum in the Precision Engineering Research Group (PREG) at MIT in 2007. An initial concept development was conducted by Alison Greenlee (Greenlee, 2009) within PERG, who found that spherical shells offered the best performnance and required the least material to construct. Subsequently, the concept was further developed and expanded upon by Gregory Fennell, also in PERG. Gregory also conducted a detailed economic analysis to estimate the overall cost of creating ORES devices at scale (Fennell, 2011).
These works have indicated that further development of the concept is warranted and form part of the motivation of this paper.
2 Energy storage
2.1 Grid scale Energy storage
There are a variety of technologies used to store energy with various power and energy capacities; some providing high power for a few seconds and others capable of running for hours. Figure 1 shows the
spread of available energy storage technologies. There are several applications where short duration storage is acceptable (e.g. managing power quality) however a large proportion of the benefits of storage require longer discharge time, on the order of hours. While several of the technologies shown in Figure 1 can store power for multiple hours, the chemical storage methods are still much more expensive than the more conventional energy storage methods that use rotating equipment, such as PSH and compressed air energy storage (CAES).
System Ratings
Installed Systems as of November 2008
100
E
0.0001
0.,001 0.01 0.1 1 10 100 1,000 10, 200
Rated Power (MWJ)
CAES Comrpressed Air Ni-Cd Nickel-Cadmiumn
EDLC Dbl-Layer Capacitors Ni-H Nickei-Metal Hydride
FW Flywheels PSH Pumpej d Hydra
L/A Lead-Acid VR Vanadium Redox
Li-Ion Lithium-Ion Zn-Br Zinc-Bromine Na-S Sodium-Sulfur
Figure 1: Comparison of Energy Storage Technologies. Source: Roberts, 2009
While pumped storage hydro is alone in its capability to store very large amounts of energy, it is worth describing CAES since it has received recent attention and funding. CAES stores energy by compressing air and storing the compressed air in a vessel until it is needed. The energy is then released by expanding
the air through a turbine. A hybrid system can be create when the compressed air is used to augment the output of a natural gas turbine. These hybrid systems are the only ones to have been constructed of which there are currently 2 in operation; the Huntorf plant in Germany and the McIntosh plant in Alabama. Both use salt domes for their storage vessels. The storage vessel for the air can be a variety of things from steel pressure vessels to underground limestone caverns. Since a larger pressure vessels allows more energy to be stored at a given pressure, large caverns are the pressure vessel of choice and this is the configuration depicted in Figure 2.
Figure 2: Compressed air energy storage conceptual layout. Source: www.sandia.gov/media/NewsRel/NR2001/images/jpg/minebw.jpg.
Pumped storage hydro, on the other hand, uses water to store the energy. In configurations similar to that depicted in Figure 3, energy is produced in the same way as a conventional hydro power station. Water flows down, from the high reservoir to the lower one, through a turbine spinning it and producing power. Energy is store by the reverse process, where the turbine is run backwards as a pump and is used to pump water back up the hill. As of 2009, there was 104GW of installed capacity worldwide (USEIA, 2012); the only significant method of grid-scale energy storage in use today.
Pumped-Storage Plant
VI~ho~ Cou~t~Figure 3: Pumped Storage Hydro conceptual layout. Source: www.tva.gov/power/pumpstorart.htm
Despite PSH being deployed around the globe, it is only available areas with the correct geology to allow a high reservoir and a low one to be adjacent. In regions without the geological features necessary, PSH is simply not possible.
2.2 Ocean energy storage
Because of the high pressures available at depth in the ocean and because so many cities and energy load centers are coastal, several concepts have been put forward in attempts to store large amounts of energy offshore.
2.2.1 Ocean CAES
Hydrostor Inc., Thin Red Line Aerospace and Nimrod Energy Ltd. are all working on almost identical concepts for CAES. The idea centers on using high pressure ocean water to contain the compressed air instead of a rigid pressure vessel. Since water is providing the pressure, stiff materials such as steel and rock formations are not required to contain the compressed air and flexible bags can be used. However, the bags experience buoyancy and must be held in place. The force of buoyancy being substantial, aerospace polymers must be used to form and reinforce the bags which also require a sizable anchor.
Figure 4: Thin Red Line Inc. 's energy bags. Left: First wet test of the energy bag concept. Right: A larger untested bag. Source: http://www. thin-red-line. com/
Bright Energy Inc. was the recipient of an ARPA-E grant for energy storage and has patented a concept whereby CAES is conducted using underwater balloons as the pressure vessel. However these balloons are anchored to the sea floor by virtue of being laden with Sediment. In attempting to use the lowest cost material, and the one most readily available, the material of the sea floor itself was selected. Bright Energy hopes to have a prototype in the coming year but is also working on developing pure CAES onshore in steel vessels.
2.2.2 PSH Ocean Storage
Gottlieb Paludan Architects and Rise-DTU, as well as Kima Inc. are working on the concept of an energy island. The idea is to create an island with either a raise or lowered water level compared to the
surrounding waters and to use this height difference as the head for pumped storage hydro. Despite the head being relatively small, the volumes planned are quite large as can be seen in Figure 5. There have not been any prototypes to date nor are any planned at this time.
Figure 5: Artist's impression of Gottlieb Paludan Architects and Riso-DTU's Energy Island. Source: http://www.gottliebpaludan.dk/dk/menu projekter/projekgpi/billeder/www/greenpowerisland.pdf
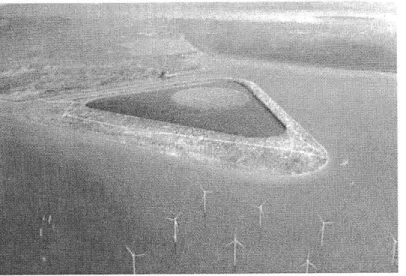
Two physics professors, Horst Schmidt-B6cking and Gerhard Luther have independently conceived of an idea virtually identical to the ORES concept albeit two years later. Their concept consists of a large concrete sphere on the seafloor with a reversible pump-turbine to transfer water in and out of the sphere, shown in Figure 6. The spheres are also connected to wind turbines, although not in any mooring configuration.
A~j
3 ORES Concept Overview
The ORES concept is a scheme to store energy in the deep waters offshore. In principle, the idea is very simple: to create large, hollow concrete spheres and drop them down onto the sea floor. By fitting these spheres with a reversible pump-turbine, water can be cycled in and out of the spheres, from high pressure outside to low pressure inside and back. In that way, energy can be stored or discharged, similar to pumped storage hydro. A simple concept image of one of the potential architectures is shown in Figure 7.
Figure 7: Simple ORES concept image.
The discharging and charging cycles happen as follows:
Discharging: The device is discharging when it allows water to flow into the sphere, passing through a turbine. The turbine spins a generator producing electricity. Eventually, the sphere fills and power production must stop.
Charging: Electricity can be delivered to the generator, running it backwards as a motor. The now motor spins the turbine which acts as a pump, draining the water from the sphere. The energy delivered to the motor caused a volume of water to leave the sphere. That energy can later be recovered by allowing water to flow back in, filling that same volume.
The round-trip efficiency of pumped storage hydro facilities ranges from 75-78% (Eyer & Corey, 2010) so it is expected that similar rotating equipment could be applied to the ORES concept and similar efficiencies would result. A pilot sea-water pumped storage hydro facility was completed in 1999 on the island of Okinawa in Japan. Since then, the facility has demonstrated the successful operation of a pumped storage hydro plant using sea-water.
While conventional pumped storage hydro is well established as a viable and cost effective method of storing large amounts of energy, it is limited by the geology required. In areas without mountains, for example, it would not be possible to create a PSH system. In contrast, the ORES system removes this constraint and brings the proven effectiveness, high power and high energy capacity of pumped storage hydro to the offshore. Given that a large portion of the world's population lives in coastal areas, there are many more sites available for ORES development. A substantial list of potential sites for the ORES concept has been compiled based on several factors but most notably according to water depth, proximity to population centers and the quality of the wind resources available (Fennell, 2011).
Taking a systems approach, as shown in Figure 7, the concrete sphere can be used as a mooring for offshore floating wind turbines. Joining these two technologies provides cost savings in several areas: the moorings themselves are no longer required, only one transmission line to shore is required and that transmission line can be sized for lower power. Since the average output of a wind farm is much less than the rated output, the transmission lines and substations can be sized for less power with peak power from the wind turbines being stored for later use.
3.1 Prototype Concept Overview
This system is the first in a series of test devices that will be created to develop and demonstrate the viability of the ORES concept. The tests devices will be as close to the design of the final concept as possible with each successive build being larger than and improving on the last. With this first device, the goals were as follows:
1. To explore the viability of creating an ORES device by casting concrete spherical sections and joining them together.
2. To successfully demonstrate the ability of an ORES device to store energy in a simulated underwater setting.
3. Evaluate the usefulness of a vent line from the sphere to atmosphere.
For this study, a Im diameter ORES device was to be designed and built for testing on land. The device would consist of a spherical concrete shell and rotating equipment to transfer energy to and from the water. To test the device, several additional systems would be needed including: An electrical system to power the rotating equipment and accept output power, a reservoir of water at height to simulate the ocean depths including a piping system to deliver the water to the rotating equipment, and a system of sensors and data acquisition modules to collect the test data.
The purpose of the vent line is to maintain the interior of the sphere at constant pressure, allow air to escape from the sphere as water comes in during discharging and the reverse during charging. While a vent line requires additional cost for the line itself, the couplings and its maintenance, the potential lost storage capacity, due to rising internal pressures in the sphere as it fill, has the potential to offset that cost. The sphere would thus be cycled both while open to atmosphere and while sealed.
This prototype was to be built quickly and using a minimum of resources such that potential major issues with the design could be discovered as fast as possible. While there are still major differences in the conditions the prototype was subjected to here and those of the offshore environment, it is hoped that the methods developed and tested in creating the Im device will be transferable to larger devices.
4 Design
4.1 Overall system design
The design of the prototype will mimic that of the full sized device and consist of the same basic
components. To achieve the stated goals of the prototype, it was important to maintain as much fidelity as possible to the design and operation of the full sized ORES concept. However, design choices were made that deviated from the full sized device to simplify and reduce the cost of the prototype. An overview of the choices made follows.
The first and most obvious deviation is the size. With full sized ORES devices potentially having a diameter as large as 33m (Fennel, 2011), the prototype is thus a 1:33 scale model. As the device will be scaled linearly, the volume and energy storage capacity will be reduced by a factor of 333=35937. The deployable depth, however, will remain the same. The prototype will not be deployed underwater but deployable depth may still be useful for design purposes.
Because of its smaller size, handling of the concrete components will be much easier. Thus the concrete sections will be cast with the equatorial plane being horizontal instead of vertical. Vertical casting was desired to reduce the use of heavy lifting equipment however, that is not a concern in this study.
The interior of the vessel will be accessed by 2 ports. The pump suction will be piped to the bottom of the vessel while the turbine draft tube will deliver water through the top. This configuration is necessary due to the type of turbine being used since turgo turbines require a draft tube that discharges to open air. Unfortunately, a loss of 3 feet of head (~] 0% of the total head) is incurred by having inlets and outlets at different heights. Reaction turbines such as Kaplan and Fracis types would not have this issue since their
draft tubes are filled with water and can thus support a pressure change along the draft tube. A turgo turbine, however, has a pressure drop across the nozzle leading into the turbine and nowhere else. With the prototype not being under water, a piping system to deliver high pressure water directly to the rotating equipment will be needed. While this should not change the behaviour of the rotating equipment, the concrete sphere will not be subject to external compressive forces, unlike the full sized device. Also due to the lack of external pressure, only limited positive gauge pressure will be allowed inside the sphere. The pressure on the exterior of the sphere will only be atmospheric and the tensile strength of the sphere, and its seals in particular, are not able to withstand internal pressure without failing.
Finally, the system must be made air tight, as air leakage is not possible in the production device. To ensure that the behaviour of the prototype does not deviate from that of the production device due to air leakage, those leaks must be managed and reduced to an acceptable level. The sphere must also be sealed since tests will be conducted with internal pressures other than atmospheric.
With these requirements in mind, the following components were designed, built and tested. 1. Concrete sphere
2. Turbine 3. Pump
4. Electrical system
5. Data acquisition system 6. Piping system
The design of these systems is described in detail in the following sections.
4.2 Concrete Sphere
To create the concrete sphere, two hemispheres were to be cast and joined. Previous work explored the possibility of using more than two sections, like barrel staves, to create the sphere but concluded that simply using two halves was best for preventing failure of the section prior to assembly. The individual concrete sections under their own weight are much more susceptible to tensile forces than the assembly itself so failure is more likely to occur prior to assembly being completed. The smaller the number of sections used, the better each section is at resisting gravity as well as stresses exerted during handling so the minimum, two pieces, was chosen.
Figure 8 : 120 degree concrete sphere section. The red arrow on the scale at right indicates the yield strength of the concrete. This structure will fail in several locations.
Figure 9: 180 degree concrete sphere sections. While stress concentrations still exist with this geometry, there are no stresses above the yield strength of the concrete.
As seen in Figure 8 and Figure 9, the production model will feature a wider base; the internal cavity will be spherical but the concrete itself will have a conical base added for stability on the ocean floor. For simplicity of fabrication, the prototype's concrete shell was entirely spherical, thus allowing the use of hemispherical molds for both the inner and outer mold pieces.
The wall thickness of the prototype was selected in accordance with the scale factor applied to the internal diameter. For a 20m sphere, the wall thickness required was approximately 6 feet (Fennell, 2011). The nominal wall thickness for the prototype was thus about 3.5 inches. The exact thickness was subject to the availability of inexpensive mold materials. To facilitate the removal of the inner mold, no part of the inner mold was allowed to contact concrete at an angle parallel to the direction of pull used to release it, i.e. a draft angle was applied to the concrete sphere. To do this, a spacer was placed between the two molds at the pole to keep the inner mold out enough such that a sufficient draft angle exists. Given the mold sections available and the draft angle, the thicknesses at the equator and the pole were approximately 3.75 inches and 4 inches respectively.
While the prototype completed here is not designed to be deployed offshore, the possibility of creating a sphere is this size for deployment was also a factor in the wall thickness selection. For deployment offshore, the sphere must be negatively buoyant so the walls must be thick enough (i.e. weigh enough) to cause the sphere to sink. The turbine and pump in a deployable sphere would likely increase the sphere's tendency to sink so they were not included in this calculation, shown in Table 2.
Inner Mold Diameter [m] 0.76
Outer Mold Diameter [m] 0.95
Wall thickness [m] 0.10 Concrete Volume [m3 ] 0.22 Concrete Density [kg/m3] 2400 Concrete Mass [kg] 528 Displacement Volume [M3] 0.45 Seawater density [kg/m3 ] 1025 Displaced mass [kg] 463 Net buoyancy [N] -642
Table 2: Buoyancy Calculations
The maximum depth a sphere can be deployed to also depends on the wall thickness. Stresses in the concrete were calculated modeling it as a thick walled sphere that was linear, isotropic, and continuous, in accordance with Hooke's Law. Concrete's strength was 5000psi and a safety factor of 1.5 was applied. The internal pressure of the sphere is also assumed to be 0.
Since only hydrostatic pressure is applied, which is evenly distributed over the entire face it acts on, the shear stresses are zero. The normal stresses are thus equal to the principal stresses. Due to the symmetry of the sphere, two of the three normal stresses are equal. The normal stresses are given as follows:
Pirg3 r] + 2r3 P 0rf ria+2r3 a1(r) = a2(r) - 2r (1) 2r3 r3 - rg3 23 r r3 Pir3 r -r3 P0r3 (r3 3 3(r)-- r33 rf - rg3 3 3) (2) r3 r0 rg3
Where
a,,
02 and G3 are the principal stresses, Pi is the internal pressure of the sphere, Po is the external pressure (related to the depth), ri is the inner radius of the sphere, ro is the outer radius and r is the radius being evaluated. A stress tensor, of the form below, results.=
[0or
0
(3)
0 0 U3
And the von Mises stress is calculated from the principal stresses:
(a1 - a2)2 (az - 03)
2 + (o - 0 3)2
L(7 = U 2 = U1 - 3 (4)
The maximum von Mises stress will occur when r = rg, as a, is maximized and 03 is minimized (and
equal to 0), and thus a, = a1. Taking into account the material properties, the maximum allowable stress, which is the strength of the concrete, S, over the factor of safety, FOS, will be the von Mises stress at the maximum deployable depth.
S
S= FOS (5)
The external pressure is also related to the depth as follows.
Po = psgd (6)
Simplifying Equations I and 2 and substituting for the values stated above, an equation for depth can be found:
2 S r53
d=- 3 1 (7)
ps -gFOS fl
The external pressure, d, is then calculated. The numerical results are shown in Table 3.
oU, [psi] -3333.3
o1, [psi] -3333.3
Pi, [psi] 0.0
ri, [in.] 15.0
ro, [in.] 18.7
Wall thickness, t [in.] 3.7
t/d 8.1
Po [psi] 1075.2
Depth [ft.] 2443.6
Table 3 Calculation of maximum deployable depth
It should also be noted that the concrete structure is required to be cycled (ie. pressurized and depressurised) potentially several times a day for many years. For the production device, the current thought is to have a 0.05atm internal pressure and 1 atm when the sphere is full, leaving 5% of the volume for air compression. The ratio of von Mises stress in the sphere when "full" to that when "empty" would thus be:
22.97 - 0.0051
R = = 1.013 (8)
22.76 - 0.1013
While the effects of cyclic loading on the planned concrete-self consolidating steel fiber reinforced concrete-have been investigated (Singh, 2004), it is still unclear at this early stage in development which concrete and pressures to use and further work will be necessary to correctly account for cyclic loading and other potential factors relating to sphere thickness.
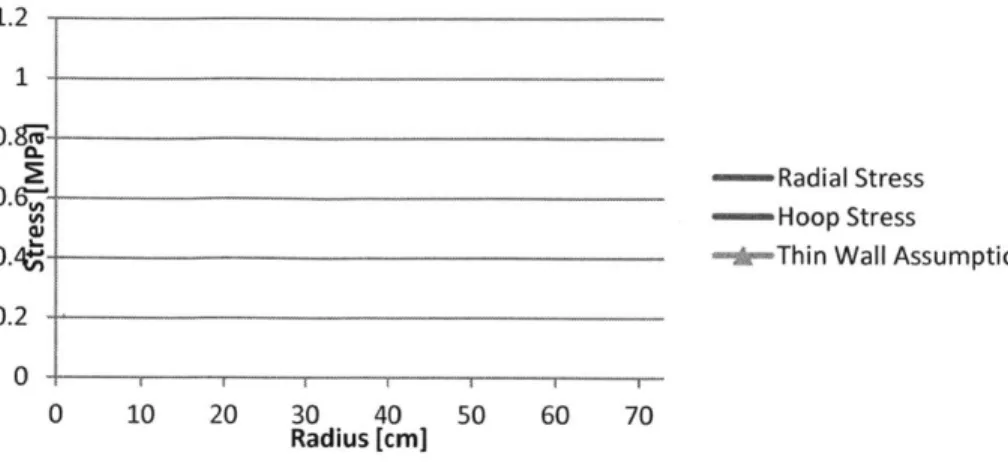
The stresses throughout the wall thickness are shown in Figure 10 below. Notice the maximum stress occurs at the inner radius (15in.) and is tangential to the shell.
1.2 1 0.
0.692 - Radial Stress
- Hoop Stress
0.t_ --*-Thin Wall Assumption
0.2
0 f
0 10 20 30 40 50 60 70
Radius [cm]
Figure 10: Radial and Hoop stress in the thick-walled spherical shell.
Using the same methods outlined above, the maximum deployable depth for a full size, 25 meter sphere with a safety factor of 1.5 is calculated for various wall thicknesses. The results of these calculations are shown in Figure 11. It can be seen here that the thin wall model has growing error as the wall becomes thicker.
1200.00
' 1000.00
-800.00
-600.0 - Thin Wall Model
.T 600.00
40 -Thick Wall Model
>- 400.00 0 0. oi 200.00 -_________ 0.00 1.00 2.00 3.00 4.00 Wall Thickness [m]
Figure 11: Maximum deployable depth for 25m spheres with varying wall thickness using both the thick-walled spherical shell model and the thin wall approximaiton
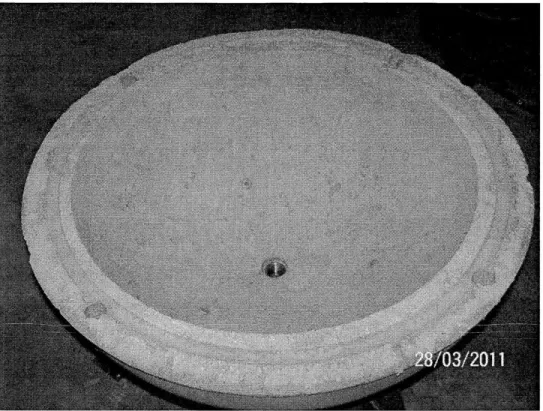
To connect the hemisphere to piping systems and to access the sphere generally, a pipe coupling was used as the spacer between the inner and outer molds and was embedded in the concrete. The seal made between the concrete and the steel coupling was found to be air tight. The embedded pipe coupling also served as a temporary lift point to lift the cured concrete hemisphere out of the lower mold. All lifts using the coupling were successful. However, additional reinforcements to the lift point would be suggested for further use of this practice.
AV'
Figure 12 A concrete hemisphere fresh out of the mold. The pipe coupling can be seen embedded in the pole.
Once the sphere is deployed, it will only be subject to the compressive forces of the water above it. Prior to that, however, it is possible that the spheres are subjected to a variety of loads from handling and assembly. While it would be possible to create a cage of conventional re-bar to withstand the tensile forces, it would greatly increase the cost of assembling the sphere (Fennell, 2011). With this cost in mind, the sphere is designed without any re-bar. Instead, either glass, polymer or steel fibre will be used for the full scale device. The type of concrete used here was self-consolidating and Kevlar@ fiber-reinforced. The self-consolidating properties allow reduced or even no vibration of the concrete once it has been poured. The specific concrete selection was done by Newstress Inc. of New Hampshire.
At this scale, vibrating the mold as the concrete settles was simple and done by casting the hemispheres while the mold was on a vibration table. Large versions will not be vibrated so effective self consolidating concrete as well as proper mold design will be important to avoid trapped air pockets.
As mentioned above, the sphere is designed without re-bar. There were no indications during the creation of this concrete sphere that would indicate the need for re-bar in the future however, more work will be necessary in modelling and testing to determine the reinforcement method used for the full scale device.
4.3 Hemisphere Joint
To join the two hemispheres together a bonding compound was used. A bonding compound was selected over conventional fasteners because it simultaneously creates a seal between the two hemispheres and also reduces stress concentrations that features in the concrete, through holes or fasteners may apply.
Since the bond is only required to handle low loads, a bonding compound capable of handling the load was easily found.
Originally, designs involved creating an annular ring with injection ports in the mating faces into which grout or epoxy could be injected. Since it was envisioned that the full scale device would be joined together via grout injection, the prototype followed suit. The annular channel can be seen in Figure 13.
Figure 13: Annular channel with injection ports for epoxy injection.
The gap between the ports was purposefully left small such that enough epoxy would be able to leak across and bridge the gap, sealing the sphere. However, it had to be large enough so that the fluid
resistance across it would still be more that the resistance of the channel itself; otherwise the epoxy would simply cross the gap and come out the other side instead of going around the circumference.
Figure 14: Left: Annular channel with stud ports. Right: Cross section of the same.
Further development brought about the idea of using a continuous ring, which is much easier to
manufacture. A hammer drill would then be used to create two diametrically opposed ports; the inlet and outlet for epoxy. Several holes could further be drilled if it was found that the epoxy would not flow fast enough, allowing more to be injected further along the ring. Furthermore, to increase the strength at the interface, studs embedded in epoxy would sit in stud ports formed in the concrete and bridge the gap between the two hemispheres.
The channel for epoxy and the stud ports were all created simultaneously during the casting process using a steel ring with studs welded on, shown in Figure 15. The ring itself was selected to occupy the middle third of the joining faces thus a one inch steel pipe was rolled into a ring of the correct diameter. The stud ports were made by pressing a one inch diameter piece of backer rod onto each of the metal spikes welded onto the ring. The stud port and channel were thus both about one inch in diameter. To prevent the backer rod from sticking to the concrete, it was wrapped in plastic wrap. Unfortunately, the plastic wrap became embedded in the concrete; every fold and wrinkle giving the concrete a gripping point. Furthermore, the stud ports were made too deep such that the concrete at the blind end of the port was very thin on the side closest to the outer wall. This thin concrete failed easily and leaked. Ultimately, the studs were found to be problematic and unnecessary because they caused leaks and only served to provide strength across the joint that was not needed.
Figure 15: Steel ring with welded studs used to create the epoxy channels.
To inject the epoxy successfully, it must flow fast enough to reach the outlet before it begins to thicken. To accomplish this task, the epoxy must be pumped with sufficient pressure. Sikadur-32 from Sika Corporation was selected for its ability to bond to concrete and its high strength and stiffness. To determine if the required pumping pressure was reasonable and that suitable seals could be made to contain the epoxy, the following calculations, shown in Table 4, were performed using a Moody chart and the Darcy-Weisbach friction factor.
Working time [min.] 22
Target flow time [min.] 1
Dynamic viscosity, p [Pa-s] 3.00
Channel diameter [cm] 2.54
Channel cross section [cm2] 5.07
Channel length [m] 2.7
Minimum velocity [m/s] O.00206
Target velocity [m/s] 0.0452
Flow rate [L/s] 0.0229
Density [kg/m3]
1400
Reynolds Number 0.536
Flow Regime Laminar
Darcy-Weisbach factor (f=64/Re) 119.4
Pressure Loss [kPa] 18.3
Table 4: Pressure drop of epoxy during injection.
The pressure loss, AP, was calculated from the friction factor as shown in Equation 9. I pV2
AP = f
d 2
The two mating faces, both being made of concrete, would not be able to form a seal to prevent the epoxy from leaking out so backer rod was to be placed between the two mating hemispheres to seal the epoxy channel. An outer ring and an inner ring of backer rod would be needed to surround the channel in which epoxy would be injected. Backer rob being difficult to lay out and given the low pressures stated above, it was decided that caulking be used instead; it is easy to lay out in any shape and can maintain its shape enough to plug large gaps (observed up to 0.5 inches). Figure 16 shows the hemisphere layed out with sealant and epoxy in the stud holes. The sealant used around the channel was Sonolastic NP-1
Polyurethane Sealant Caulking (white) while the stud ports were filled with Epcon A7 epoxy for its higher strength. The upper hemisphere had the studs epoxied in using the Epcon A7. It was then flipped over, suspended on a chain fall, brought into position above the lower hemisphere and lowered into place.
Figure 16: The lower hemisphere with sealant applied and stud ports filled with epoxy.
Figure 17: The upper hemisphere prior to being joined with the lower hemisphere. The four studs are visible, protruding downward from the upper stud ports.
Alignment between the upper and lower hemispheres was achieved by eye. This method was sufficient for the mating faces, shown in Figure 16 with the white caulking. However, the studs, whose ports
contain dark gray caulking in Figure 16, were difficult to align by eye and took several attempts. Due to the low pumping pressure and the theoretical simplicity of laying down a continuous bead of sealant, this approach was attempted but was unsuccessful. The end result had leaks from the channel to the interior of the sphere. The reasons for failure of this method are: 1. The surface of the concrete was very rough with large chips having been broken off the edges making the contact area between the mating faces very thin. 2. There was no way to verify that the sealant would bond and seal effectively before the upper concrete hemisphere was lowered into position. 3. It was not possible to test the seal until the sealant had cured and fused the two halves together. 4. The interior ring was no longer accessible once the two halves were joined. The assembled sphere, seen in Figure 18 below appears fully assembled but leaks considerably.
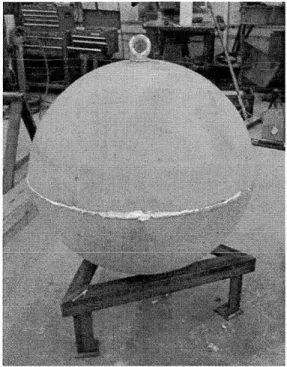
Figure 18: Assembled concrete sphere.
Once the two halves were joined together, it was found that one or more leaks existed on the interior ring seal that were not easily serviceable. However, since this device would only be subjected to external pressures (no internal pressure tests were planned nor undertaken), the channel for epoxy injection was abandoned and the sphere was sealed from the exterior. Instead of using an internal channel to seal the joint, an open channel was created at the interface with the channel depth sufficient to close the gap
between the two hemispheres. Figure 19 show the channel cross section and the channel once filled with epoxy, which could easily be poured in from above. The same Sikadur-32 was used here. Once the open channel was filled with epoxy and cured, the equatorial seal was established and the joint was found to be leak free.
Figure 19: The open channel used to join the two hemispheres. Left: Cross section of the channel. Right: The channel filled with epoxy.
The stud ports were initially filled with Epcon A7 epoxy however, once the sphere was sealed using the open channel technique above, it became clear that the Epcon A7 had not created an adequate seal and air was leaking through the thin concrete at the base of the stud ports. This thin concrete showed cracks and gave way easily to even light taps with a hammer. To fix these leaks, the thin concrete was cleared, revealing the failed epoxy seal inside. Figure 20 shows the clear separation and failed bond between the concrete and the Epcon A7. The failure of these seals was due, in part to the plastic wrap used when making the stud ports. A large amount of the plastic wrap had to be removed in small piece through both the intended opening of the stud ports and the opening created by chipping away the thin concrete. Sikadur-32 was then filled into the ports to create a seal. Weather stripping was again used to retain as much Sikadur-32 as possible within the port. All the ports on the top side were filled, the sphere was then flipped over and the rest of the ports were filled. In the end, all eight ports had to be cleaned and sealed in this way.
Figure 20: The failed stud ports. Left: Separation between the concrete and the epoxy within the stud port. A gap around the edge is visible. Center: Weather stripping retains the epoxy. Right: The sealed
stud port.
On the far right of Figure 20, a large void can be seen on the sealed port. Despite this void, a gas-tight seal was achieved since the epoxy was able to achieve a good bond to the concrete over most of the stud port and the concrete is thick where the void appears. Once the stud ports and the joint between the two hemispheres were sealed, the sphere was successfully pressure tested and an acceptable leak rate was achieved.
4.4 Mold
To create the concrete hemispheres, a custom mold was designed and built. The mold consisted of two steel hemispherical heads of different diameter modified as needed, as well as a device to position the hemisphere relative to each other. These heads were taken from a 250 gallon and a 500 gallon LPG tank (Fennell, 2011). Using prefabricated heads greatly reduced the cost of creating the mold and required only modest concessions in the design. Nominal specifications were for a 1 m ID sphere with a wall thickness of 8cm. The steel hemis found sized the sphere created here at 0.76m ID, with a wall thickness of 9cm. For the purpose o f this prototype, that was well within the range of acceptable sizes.
While larger versions of the sphere will be cast vertically, resulting in a hemisphere more akin to the model in Figure 9, the current prototype was cast horizontally. Casting horizontally was acceptable because of its small size; handling the hemispheres would be possible using standard chain falls and hoists while a larger sphere would be much more costly to manipulate. By casting the hemispheres
vertically, manipulation is minimized. Another advantage of casting horizontally is that the flat surface is exposed allowing easy insertion of the concrete as well as it being easier to create features on the face.
Figure 21: Early models of the mold.
Initial designs resulted in the models shown above in Figure 21. Further refinements to the joint design and consideration of the functional requirements listed below led to the final design shown in Figure 22.
Figure 22: Model of the final mold.
Once the steel hemispheres had been found, they were modified towards satisfying the following functional requirements:
I. The concrete must easily release from the mold.
2. The mold must be easily manipulated when filled with concrete.
3. The inner steel hemisphere must be held in place securely so as not to move while concrete is being poured.
4. The inner hemisphere must be located in the center such that the resulting concrete wall thickness is uniform.
5. The mold must allow for the creation of features for the joint.
6. The mold must accommodate the coupling to be embedded in the pole. 7. The mold must be stable on a flat surface.
The first design feature included to facilitate de-molding is a draft angle on the inner hemisphere. To accomplish this, the inner hemisphere is simply raised up with a spacer, as shown in Figure 26 below. By moving the inner hemisphere up approximately 2.5cm, a draft angle around 4' is achieved. Concrete also
shrinks as it cures (Kwon, 2008) which makes it possible for the concrete hemisphere to grab the inner steel one and bind it. Since it is our intent to have the mold be reusable, the inner steel hemisphere was fitted with lift eyes and threaded ports welded to the interior surface to aid in de-molding. Once the concrete had cured, chain falls would be connected to the lift eyes and the inner mold section would be lifted out. Should the concrete bind to the inner head such that the head could not be pulled off with the lift points, pressurized air or water could be injected through the threaded ports to release the mold. The threaded ports were closed off from the concrete with duct tape prior to the concrete being poured to avoid damaging the threads. In addition to these de-molding features, the surfaces of the mold would be covered in mold release prior to the concrete being poured. In this case, engine oil was sufficient as a mold release agent.
T
~!Figure 23:Draft angle on the inner hemispherical mold.
The outer hemisphere was not as much of a concern with respect to de-molding since the concrete's shrinkage would tend to disengage it from the steel. A draft angle was also added to the outer hemisphere by cutting the hemisphere down below the vertical section. As shown above in Figure 23, the inner steel hemisphere is joggled just above the vertical point. The outer hemisphere was joggled in this way as well but the joggle was removed with a plasma cutter because, firstly, the joggle would impinge on the concrete as it began to leave the mold. And secondly, by cutting it off a little further down, the draft angle mentioned above could be created. Once the joggle was removed, the edge of the hemisphere was less stiff so an equatorial flange was added. This flange also aided the pouring process since it made a bigger target for the cement truck and could be used to steady a trowel.
The inner steel hemisphere's lifting lugs were designed for a lift force equal to the weight of the mold when fully loaded with concrete. While they won't be used to lift the mold itself, lift point failure must be avoided even if the inner mold is so bound to the concrete that the mold lifts off the ground. The mold is expected to weigh 131kg when empty so with the concrete a total weight of 659kg is expected. The failure mode analysed is tensile failure on a plane perpendicular to the applied load; thus the two areas on either side of the hole. The applied load is assumed to be directed along the solid blue line shown in Figure 24. The thickness is predetermined since all of the lifting lugs, mold feet and the equatorial flange will be water-jet cut from a single plate of steel. As the hole in the lug must be large enough to
accommodate the hooks available, the dimension to be found is the width of the lift eye. The following calculations were performed to determine the minimum size of the lug given a factor of safety of 5 in accordance with ASME B30.20 as reviewed by Williams (Williams, 2006).
Mass to lift [kg] 659
Number of lift points 3
Flift [N] 2155 Angle [degrees] 45 Fappied [N] 3047 Strength [Mpa] 200 FOS 5 ailowable [Mpa] 40 Area [mm2 ] 76.17 Thickness [mm] 6.35 Length [mm] 6.00
Table 5: Lifting eye calculations.
Figure 24: Lifting on the inner steel hemisphere and the direction of loading.
The outer hemi was modified in three ways: 1. It fitted with legs to prevent it from rolling, 2. The equatorial flange was added and 3. lifting eyes were added under the equatorial flange. The legs were T sections, each one being water-jet cut from steel plate and welded together so that a shape conformal to the sphere was made. Welding the foot to the sphere was stronger and easier to accomplish as a result. Three legs were used (instead of 4 or more) to prevent wobble on uneven surfaces. The equatorial flange was cut out of the same sheet of steel and welded on. This flange provides stiffness to the edge of the outer hemisphere and helps maintain circularity. The flange also provides support to the outer
hemisphere's lifting eyes and facilitates the concrete pouring process. The flange's outer diameter was specified to be 1.2m (4ft.) so it could be cut out of a single 4'x4' sheet of steel. However, as cutting began the large piece began to warp out of plane. Internal stresses are suspected however the reason is unclear.
This deformation would have been problematic should the flange have required higher precision but simply clamping and welding the flange onto the hemisphere flattened it sufficiently. Should large parts need to be cut from thin plate, de-stressed material or a process of relieving internal stresses must be employed. The lifting eyes were included to allow the concrete hemisphere to be flipped over prior to de-molding to reduce the chances of handling damage. The lifting eyes also served as connection points for
the vibration table. Despite self consolidating concrete being used, if too many voids were found, subsequent hemisphere could be vibrated.
Calculations for the outer lift eyes were conducted in the same manner as for those on the inner steel hemisphere. An FEA study was also conducted, in addition to the hand calculations, to verify the design.
Several loading cases were evaluated to ensure that the lifting eyes would not fail at any point while the mold is flipped over under load. Figure 25 shows one of the cases.
Ovmax
=51.6MPa
FOS=4.25
Figure 25: FEA of the outer mold. Loading case based on lifting the sphere.
To position the inner hemisphere, a threaded rod and spacers were used. The threaded rod was sized to be used as a lift point, in conjunction with a large washer, allowing the mold and concrete to be lifted from the pole. The spacer consisted of a pipe coupling in the middle and plastic spacers at the outside to give additional height and help seal the coupling against the steel hemisphere. A model of the configuration used is shown in Figure 26.