HAL Id: hal-03173627
https://hal.archives-ouvertes.fr/hal-03173627
Submitted on 18 Mar 2021
HAL is a multi-disciplinary open access archive for the deposit and dissemination of sci-entific research documents, whether they are pub-lished or not. The documents may come from teaching and research institutions in France or abroad, or from public or private research centers.
L’archive ouverte pluridisciplinaire HAL, est destinée au dépôt et à la diffusion de documents scientifiques de niveau recherche, publiés ou non, émanant des établissements d’enseignement et de recherche français ou étrangers, des laboratoires publics ou privés.
Detection of Transit Events during CoRoT Operations
Celine Quentin, Raphael Cautain, Pierre Barge
To cite this version:
Celine Quentin, Raphael Cautain, Pierre Barge. Detection of Transit Events during CoRoT Opera-tions. ADASS - Astronomical Data Analysis Software & Systems, Oct 2005, San Lorenzo del Escorial, Spain. �hal-03173627�
C. Gabriel, C. Arviset, D. Ponz and E. Solano, eds.
Detection of Transit Events during CoRoT Operations
C´eline Quentin, Raphael Cautain, Pierre Barge
Observatoire Astronomique de Marseille Provence, LAM, Traverse du Siphon - BP8, F-13376 Marseille, FRANCE
Abstract. CoRoT, scheduled for launch in September 2006, should be the first mission to detect planetary transits from space. A method is proposed for detection in short data sets, based on a 1D-morphological filter and on one by one processing. The signal is processed using four modules separately applied to each light curve: (i) denoising with a non-linear filter based on the morphological approach, (ii) detection of transit-like features, (iii) sorting out of these features into possible events or noise, (iv) exploration of possible periodicities among the suspected events. For each light curve an index estimating the confidence level in the detection is determined. This index is used to sort all the light-curves in a list. Our algorithm is not time consuming and could be easily implemented for real-time analysis.
1. Introduction
Mainly funded by CNES but also by the European community, the CoRoT1
space telescope, will be launched in 2006 for a 2.5-year mission. CoRoT should detect some big terrestrial planets and a few hundred close-in giants using the transit method. The transit of a planet in front of the disk of its parent star results in a slight photometric gap in temporal light-curves. The relative am-plitude ranges from 10−2 for Jupiter-like planets to 10−4 for Earth-like planets.
The periodicity P and duration d of the transits are directly related to the or-bital motion of the planets. On a run of 150 days CoRoT will be able to detect transits with periods less than 3 months, and durations from one hour to 0.5 day. During the lifetime of the mission some 60000 stars will be monitored on 150 days and 60000 stars monitored on 20 days. Two modes are possible for the observations: (i) a standard mode with a sampling at 512 seconds, (ii) an oversampled mode at 32 seconds. The oversampled mode concerns less than 10% of all the targets in a field of view. Targets will be oversampled if a transit-like event is detected in the light-curve all along the data acquisition. Most detection methods are based on periodicity analysis and are not optimized for the short data sets we have to manage. Here, we present the morphological detector (MD) adapted to this context.
1http://smsc.cnes.fr/COROT/index.htm 307
308 Quentin, Cautain & Barge 2. Denoising
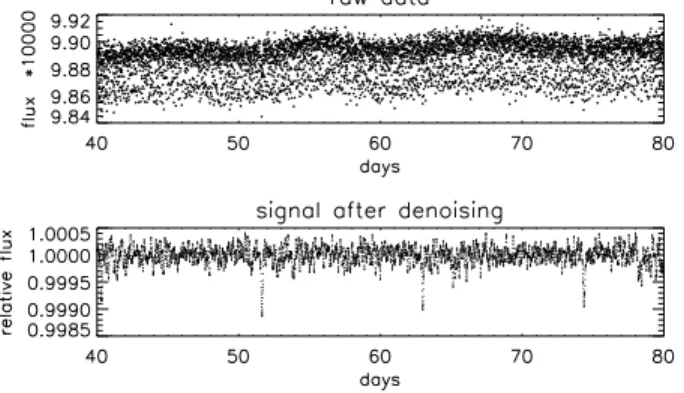
Each of the 12000 light curves (run from 7 to 150 days) is pre-processed as shown in Figure 1: (1) a non-linear filter is used to estimate slow variations of the signal related to stellar variability; (2) the signal is corrected for orbital noises; (3) the gauging filter (Guis & Barge 2005) is applied.
Figure 1. Example of a synthetic light curve with transit events be-fore and after the denoising steps.
Based on a 1D-morphological filtering, the gauging filter use aperture and closure operators with elliptic structuring elements (or gauges). The performance of the detection (Figure 2) is related to the gauge half-width. Four sizes are sufficient to cover the range of transits durations.
Figure 2. Performance in the detection of true transits using different gauges. Transits of short duration are effectively detected with narrow gauges (half-width < 34 min.), whereas longer transits (600 min.) are well detected with large gauges (half-width > 60 min.).
3. Detection and Sorting Out
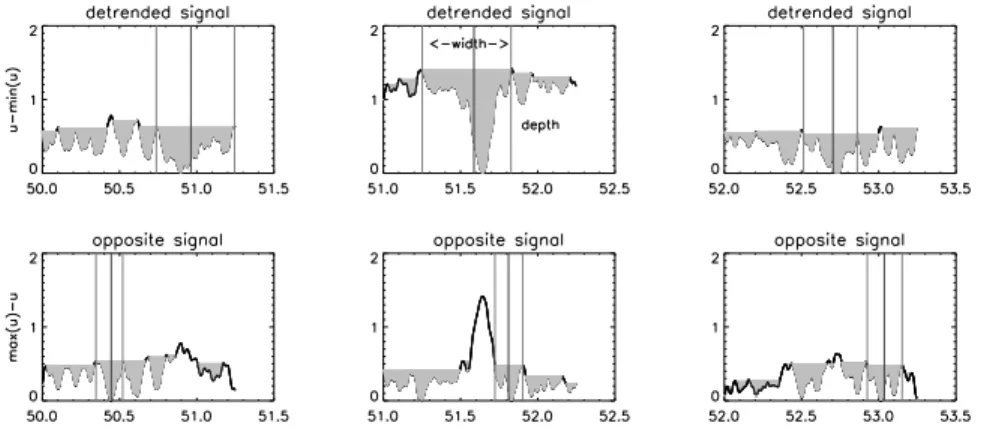
Detection of transit-like features is individually performed on each block of data, with 36 hours duration (see Figure 3). Segmentation is operated using the waterline method on the signal u and its opposite.
Figure 3. Detection by the waterline method on 3 consecutive blocks. Two points in a 3D-space are determined for each data block. Their coordinates are: depth, width and surface of the deeper basin.
duration, and surface) with at least 14 points and at maximum 300 points (as Figure 4). Points in the opposite signal help to define a noise reference cluster. Each point (starting from the most distant one from the noise reference cluster) is joined either to the noise cluster or the transit cluster, depending on the smallest separation.
Figure 4. Projection in two dimensional space (depth, surface) of the detected features, in one light curve during 55 days (100 points). Crosses refer to only noise in the opposite signal (noise reference cloud). Stars refer to possible noise features. Squares refer to possible transit events. The confidence level in the detection is related to the distance between the noise cluster and the transit one.
Finally, an index corresponding to a confidence level in the transit detection is calculated for each light curve. This procedure will provide weekly a list of light curves sorted according to their confidence index. Possible periodicity is explored for each light curve. Only 1000 light-curves will be selected for oversampling among the 12000 light-curves.
310 Quentin, Cautain & Barge 4. Performance on True Detection
The performances of this process have been tested on a set of realistic synthetic light curves (Moutou et al. 2005). The sample contained 1000 light curves among which 20 light curves contained transit events with periods from 2.5 days to 90 days. We found that most light curves containing planetary transits or stellar occultation (due to eclipsing binaries) are in the top list. Comparative results (Table 1) show that during the first 20 days, the score of the BLS algorithm (Kov´acs, Zucker & Mazeh 2002) are definitely lower than those of the MD. This is explained by the easier detection of single transit event with MD than with BLS.
Table 1. Comparative results of transit detection in a realistic set of 1000 light curves simulated for blind test exercise and for various durations (10, 20, 50, 100, or 150 days): using BLS, MD and MDCI morphological detection with use of collective informations. Results are the number of true (T) or false (F) detections for each light-curve in a list of the 50 best candidates when sorted as a function of the best confidence level. Days BLS MD MDCI T F T F T F 10 0 0 6 1 3 0 20 3 8 6 13 4 4 50 7 8 9 5 9 3 100 9 3 9 23 9 0 150 9 2 8 16 12 0 5. Future Developments
Our method is based on individual detection and is runnable during the first days of observation. A first investigation taking into account collective informations (MDCI in Table 1 ) allows to significantly reduce the false alarm rate. It will be improved removing systematic effects as performed in some other works during the denoising step (Tamuz, Mazeh & Zucker 2005), or after the detection step (Guterman et al. 2005). Ambiguities due to background eclipsing binaries, or grazing binaries will be removed using CoRoT chromatic information.
References
Guis, V., & Barge P. 2005, PASP,117, 160
Guterman, P. et al. 2005, in Proceeding of SPIE, 5905 Kov´acs, G., Zucker, S., & Mazeh, T. 2002,A&A, 391, 369 Moutou, C. et al. 2005, 437, 355