HAL Id: hal-00362232
https://hal.archives-ouvertes.fr/hal-00362232
Preprint submitted on 17 Feb 2009
HAL is a multi-disciplinary open access
archive for the deposit and dissemination of
sci-entific research documents, whether they are
pub-lished or not. The documents may come from
teaching and research institutions in France or
abroad, or from public or private research centers.
L’archive ouverte pluridisciplinaire HAL, est
destinée au dépôt et à la diffusion de documents
scientifiques de niveau recherche, publiés ou non,
émanant des établissements d’enseignement et de
recherche français ou étrangers, des laboratoires
publics ou privés.
Pre-maximum spectro-imaging of the Mira star T Lep
with AMBER/VLTI
Jean-Baptiste Le Bouquin, Sylvestre Lacour, Stephanie Renard, Éric
Thiébaut, Antoine Merand, Tijl Verhoelst
To cite this version:
Jean-Baptiste Le Bouquin, Sylvestre Lacour, Stephanie Renard, Éric Thiébaut, Antoine Merand, et
al.. Pre-maximum spectro-imaging of the Mira star T Lep with AMBER/VLTI. 2009. �hal-00362232�
Astronomy & Astrophysicsmanuscript no. 11579.hyper7598 c ESO 2009 February 17, 2009
Letter to the Editor
Pre-maximum spectro-imaging of the Mira star T Lep with
AMBER/VLTI
⋆
J.-B. Le Bouquin
1, S. Lacour
2, S. Renard
2, E. Thi´ebaut
3, A. Merand
1, and T. Verhoelst
41 European Southern Observatory, Casilla 19001, Santiago 19, Chile
2 LAOG–UMR 5571, CNRS and Universit´e Joseph Fourier, BP 53, F-38041 Grenoble, France 3 AIRI/Observatoire de Lyon, France and Jean-Marie Mariotti Center, France
4 Instituut voor Sterrenkunde, KULeuven, Celestijnenlaan 200D B-3001 Leuven, Belgium
Received 24/12/2008 ; Accepted 04/02/2009
ABSTRACT
Context. Diffuse envelopes around Mira variables are among the most important sources influencing the chemical evolution of galax-ies. However they represent an observational challenge because of their complex spectral features and their rapid temporal variability.
Aims. We aimed at constraining the exact brightness distribution of the Mira star T Lep with a model-independent analysis.
Methods. We obtained single-epoch interferometric observations with a dataset continuous in the spectral domain (λ = 1.5 − 2.4 µm) and in the spatial domain (interferometric baselines ranging from 11 to 96 m). We performed a model independent image reconstruc-tion for each spectral bin using the MIRA software. We completed the analysis by modeling the data with a simple star+layer model inspired from the images.
Results. Reconstructed images confirm the general picture of a central star partially obscured by the surrounding molecular shell of changing opacity. At 1.7 µm, the shell becomes optically thin, with corresponding emission appearing as a ring circling the star. This is the first direct evidence of the spherical morphology of the molecular shell. Model fitting confirmed a spherical layer of constant size and changing opacity over the wavelengths. Rough modeling points to a continuum opacity within the shell, in addition to the CO and H2O features. Accordingly, it appeared impossible to model the data by a photosphere alone in any of the spectral bins.
Key words.techniques: interferometric - stars: AGB and post-AGB - stars: atmospheres - stars: individual: T Lep - stars: mass-loss
1. Introduction
Among the Asymptotic Giant Branch members, Mira stars are low-mass (1M⊙), large-amplitude (∆V ≈ 9), long-period
vari-ables (≈ 1yr), evolving toward the planetary nebula and white dwarf phases. Their important mass-loss rate, of the order of 10−6M
⊙/year, significantly affects their evolution and is one of
the most important sources for the chemical enrichment of the interstellar medium. A better understanding of these late stages of stellar evolution may help shed light on this important player in the chemical evolution of galaxies. Due to their large diame-ters and high luminosities, Mira variables are a favorite target for observations at high angular resolution in the optical and near-infrared (NIR) wavelengths. The wealth of aperture-masking and long baseline interferometric information has strongly ad-vanced the study of molecule and dust formation (Perrin et al. 1999; Thompson et al. 2002; Woodruff et al. 2004; Ohnaka 2004; Ireland & Scholz 2006; Ragland et al. 2006). The global picture is an onion-like structure with molecular layers and dust shells surrounding the photosphere, the latter animated by var-ious activities (pulsations, convection, wave-shocks) crucial to explain the mass-loss process and the structural evolution.
To fully characterize the structure of a Mira star’s atmo-sphere, one would need the complete intensity map at all wave-lengths and all pulsation phases, recorded over a large number of pulsation cycles. The majority of recent studies concentrated
Send offprint requests to: J.B. Le Bouquin
e-mail: jlebouqu@eso.org
⋆ Based on observations collected at the VLTI, ESO-Paranal, Chile.
on the spectral and/or the phase dependence. They overcame the issue of the exact brightness distribution by using either inte-grated quantities (such as diameter, Millan-Gabet et al. 2005; Woodruff et al. 2008), or the direct comparison of a few interfer-ometric measurements with geinterfer-ometric (Mennesson et al. 2002; Perrin et al. 2004) or dynamic models of pulsating atmospheres (Ohnaka et al. 2006; Wittkowski et al. 2007, 2008). To study the brightness distribution, the difficulty lies in collecting a sufficient amount of spatial information in a period of time shorter than the typical life-time of the expected structures, and within spectral bins small enough to spectrally resolve the molecular bands (for which completely different intensity maps are expected).
In this work, we present a multi-wavelength, spatially re-solved observation of the single star T Lep. This Mira variable has a spectral type of M6e-M9e and V-band magnitude vary-ing from 7.3 to 14.3 (Samus et al. 2004). For the ephemeris, we use a Modified Julian Day of last maximum brightness T0 =
54446 days and a pulsation period of 380 days (based on the last cycles observed by AAVSO), instead of the 368 days from Whitelock et al. (2000). The mass-loss has been estimated to be 7.3 × 10⁻⁷M
⊙/year by Loup et al. (1993). The most prominent
spectral features expected in the NIR comes from water vapor and also CO. The shapes and widths of these molecular bands depend on the stellar phase.
We present the dataset in Sec. 2, with a special emphasis on the observations and data reduction. Image reconstruction is presented and discussed in Sec. 3. We model the data in Sec. 4 with a simple star+layer model inspired by Perrin et al. (2004).
2 J.-B. Le Bouquin et al.: Pre-maximum spectro-imaging of the Mira star T Lep with AMBER/VLTI 15min T Lep Transfer Function 0.16 0.18 0.20 0.22 0.24 0.0 0.2 0.4 0.6 0.8 mjd − 54781 (days) V 2
Fig. 1. Example of observation sequence, on the baseline G0-H0
and for the spectral bin 1.59 µm. The interpolated TF is repre-sented.
Table 1. Observation log.
Date T Lep phase Baselines Spectral range 2008-10-10 0.80 G2-G0-K0 1.5087 − 2.3191 µm 2008-11-04 0.86 D0-H0-G1 1.4287 − 2.4413 µm 2008-11-06 0.87 A0-D0-H0 1.4287 − 2.4238 µm 2008-11-10 0.88 E0-G0-H0 1.4287 − 2.4413 µm
2. Observations and data reduction
Data were collected at the Very Large Telescope Interferometer (VLTI, Haguenauer et al. 2008) with the spectrograph AMBER (Petrov et al. 2007) covering simultaneously the J-, H- and K-bands with a spectral resolution of R ≈35. Even though J-band fringes have been properly recorded in several observations, we decided to discard them from the analysis of this paper since the data quality is significantly worse than for longer wavelengths. The majority of the observations have been obtained by the FINITO fringe-tracker (Le Bouquin et al. 2008). When the con-ditions were unstable, we used FINITO in group-tracking mode (instead of phase-tracking). This mode reduces the sensitivity to unstable atmospheres at the cost of a clearly reduced instrumen-tal contrast. We used 4 configurations of 3 Auxiliary Telescopes (ATs) each. Data for the A0-D0-H0, D0-H0-G1 and E0-G0-H0 configurations were obtained within a few days of each other while data with G2-G0-K0, extracted from the archive, was ob-tained about 1 month before as shown in Table 1.
Concerning the wavelength tables, we performed a rough absolute calibration by cross-correlating our observed spectra with an atmospheric model. We found a systematic offset of 0.08 ± 0.02 µm with respect to the initial AMBER table.
Observations of calibrator stars with smaller angular diame-ters were interleaved with observations of T Lep. We were able to reach an average observation frequency of about 25min per calibrated point. This appeared to be crucial to properly sample the instrumental and atmospheric transfer function (TF). This also allowed us to manually discard the obvious outlier mea-surements without degrading the spatial coverage of our dataset too much. Additionally, we discarded all observations where the FINITO locking ratio was lower than 60%. Raw visibility and closure phase values were computed using the latest public ver-sion of the amdlib package (verver-sion 2.2, Tatulli & AMBER con-sortium 2007) and the yorick interface provided by the Jean-Marie Mariotti Center. We used our own software to calibrate
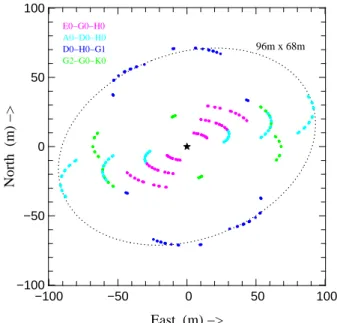
96m x 68m G2−G0−K0 D0−H0−G1 A0−D0−H0 E0−G0−H0 −100 −50 0 50 100 −100 −50 0 50 100 East (m) −> North (m) −>
Fig. 2. Projected baselines (UV-plane) in meters of the complete
AMBER dataset on T Lep.
the instrumental and atmospheric TF (see Fig. 1 for an exam-ple). We estimated the uncertainty on the TF with the dispersion between the consecutive points obtained for each observation of a calibration star. This dispersion generally dominated the other sources of error (mainly the diameter uncertainty of calibrators) and was propagated to the uncertainties on the calibrated visibil-ities and phases obtained for T Lep. Fig. 2 shows the final UV-plane coverage of all observations that successfully passed all steps of the data reduction and calibration quality control. The east-west direction is favored because of the geometry of the telescope triplets used. Visibility curves are displayed in Fig. 3.
Looking at the interferometric data, we found that the gen-eral picture of T Lep significantly departs from a simple disk or Gaussian. It is composed of at least two different features: one has a characteristic size 5 − 7mas and the other 11 − 16mas. The exact size of these components and the flux ratio depend on the wavelength. This is qualitatively in agreement with a complex stellar atmosphere surrounded by molecular shells with wavelength-dependent opacity. Additionally, the non-zero clo-sure phase (departure from 0−180 deg up to 90 deg in the H-band and 30 deg in the K-band) indicated the presence of asymme-tries either in the shells or in the photosphere itself. Interestingly, we were not able to reproduce correctly the interferometric data with simple geometrical models such as Gaussian + Gaussian, or limb-darkened disk (LDD) + Gaussian, even when disregard-ing the closure phases This was our main motivation to attempt to reconstruct an image.
3. Image reconstruction
Our dataset is perfectly suited to spectro-spatial inversion, where the spectral and the spatial dimensions are treated together as-suming a certain number of degrees of freedom in each space. Unfortunately the necessary algorithms are not yet available, and we had to solve the problem independently for each spec-tral bin. We performed the image reconstruction with the MIRA software (Thiebaut 2008; Cotton et al. 2008). In spite of the ap-parent completeness of the dataset, we expected that it would not be straightforward to produce images: (i) the geometry of the VLTI array makes the east-west direction privileged, (ii) the
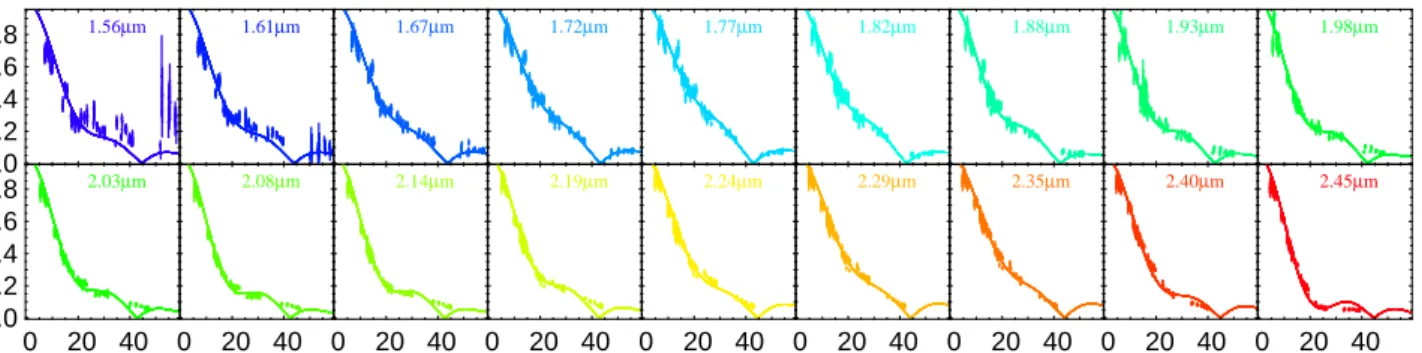
1.56µm 0.0 0.2 0.4 0.6 0.8 1.61µm 1.67µm 1.72µm 1.77µm 1.82µm 1.88µm 1.93µm 1.98µm 2.03µm 0 20 40 0.0 0.2 0.4 0.6 0.8 2.08µm 0 20 40 2.14µm 0 20 40 2.19µm 0 20 40 2.24µm 0 20 40 2.29µm 0 20 40 2.35µm 0 20 40 2.40µm 0 20 40 2.45µm 0 20 40
Fig. 3. Visibility profiles V(Bλ) from AMBER/VLTI, compared to the star+layer model of Perrin et al. (2004). The horizontal axes
are the spatial frequencies Bλ, marked in meter per micron, the vertical axes are the linear visibilities.
necessary use of closure phases makes the phase information three times less rich than that of the visibilities. Therefore, a 2-step image reconstruction strategy was specifically elaborated. The first step consisted of building a radially symmetrical image from the data. Only the baseline length was considered. The am-plitude and sign of these pseudo data (which are all real due to the assumed symmetry) were derived from the measured power spectrum and sign of the closure phases respectively. We then used MIRA with a strong smoothness regularization to recon-struct the first stage images. The second step uses these bright-ness distributions as a support for a quadratic regularization of a 2D brightness map (Le Besnerais et al. 2008). Each of the spec-tral channels was processed separately. Resulting final images are presented in Fig. 4.
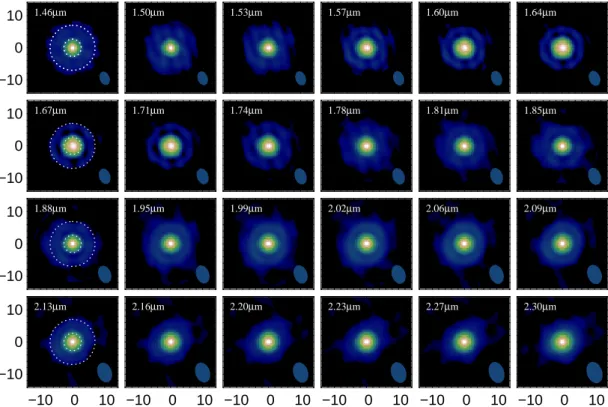
The recontructed images clearly highlight two components. The brighter central component corresponds to the photosphere, with a linear radius of 100 R⊙(assuming a parallax of 5.95 mas
from Lee 2007). The second component is the molecular layer (molsphere), characterized by the high spectral dependency of its apparent morphology. Within the molecular absorption bands (1.5 − 1.6 µm, 1.75 − 2.15 µm, 2.3 − 2.5 µm), the shell is opti-cally thick and appears, projected toward the observer, as a cir-cular disk. Between these bands, absorption by molecules is not as strong, and the shell becomes optically thin. It appears as a projected ring encircling the photosphere (1.6 − 1.75 µm). The lack of data points in the second lobe at 2.2 µm (see Fig. 3) pre-vented the algorithm from reconstructing the inner gap between the molecular shell and the photosphere. Instead, it resulted in a decreased contrast between the molsphere and the photosphere. Each spectral bin has been reduced and imaged indepen-dently. These images are in good agreement. It provides a strong indication that the MIRA algorithm is not inverting the statistical noise present in the data. Possible correlations may still originate from the calibration noise (atmospheric turbulence) and the use of common calibrator stars. However, these sources of errors are unlikely to give rise to such a coherent pattern as observed in Fig. 4. These images are a strong argument for a shell-like ge-ometry of the molecules within the atmosphere.
4. Intensity profile modeling
In addition to reconstructed images of the molecular shells, we used a simple radiative transfer model developed by Perrin et al. (2004) to derive the physical parameters of the system. This model consists of a uniform disk star that emits radiation with a black body spectrum (Φ⋆,T⋆), surrounded by a spherical layer
with no geometrical thickness. The layer is characterized by a size, a temperature and an optical depth (Φl,Tl, τl). Such an
ana-(mas) 0 10 20 CO H2O CO H2O 1.5 2.0 2.5 0.0 0.5 1.0 1.5 λ (µm) τlayer Φlayer
Fig. 5. Size and optical depth of the layer surrounding the
pho-tosphere, as extracted by a fit of the visibility curves (Sec. 4). The dashed curve is a fit with H2O and CO opacities assuming Tl = 1800 K (T. Verhoelst, private communication). A
contin-uum opacity of τ ≈ 0.2 was added.
lytic model can be compared to our wealth of observations with-out requiring time-consuming computations. We have also pre-ferred to use an ad-hoc geometrical model rather than a self-consistent hydrodynamical model in order to easily give some geometrical flexibility to the fitting process. Other types of mod-els will be discussed in further publications. We allowed the layer size and optical depth to be wavelength dependent, but not its temperature nor the stellar parameters. We were able to reproduce the visibility curves with the following parameters T⋆ = 3500 K, Tl = 1800 K, Φ⋆ = 5.8 mas and the chromatic
quantities of Fig. 5. According to the good overlay of the vis-ibility curves in Fig. 3, all spectral features observed in Fig. 5 are real. However, our fit shows important correlations between T⋆, Tland the average level of τl(≈1). Additional spectroscopic
inputs may be needed to provide definite measurements of these quantities.
The model is able to reproduce the wavelength dependency of the visibility break around Bλ= 20. Our data strongly suggest
that the star+layer geometry is a good proxy for the real inten-sity profile and strengthens the result we had obtained with our imaging technique. It also gives a strong argument suggesting that the opacity effect explains most of the apparent size changes, without requiring important changes in the layer size (which was wavelength-independent in previous studies).
4 J.-B. Le Bouquin et al.: Pre-maximum spectro-imaging of the Mira star T Lep with AMBER/VLTI 1.46µm −10 0 10 1.50µm 1.53µm 1.57µm 1.60µm 1.64µm 1.67µm −10 0 10 1.71µm 1.74µm 1.78µm 1.81µm 1.85µm 1.88µm −10 0 10 1.95µm 1.99µm 2.02µm 2.06µm 2.09µm 2.13µm −10 0 10 −10 0 10 2.16µm −10 0 10 2.20µm −10 0 10 2.23µm −10 0 10 2.27µm −10 0 10 2.30µm −10 0 10
Fig. 4. Reconstructed images of T Lep with the MIRA software for several AMBER spectral bins across the H and K bands. The
interferometric beam size is displayed in the bottom-right part of each image. Spatial scale is in mas. The white circles in the first column represent the average radius for the molecular layer (Φl∼15mas) and for the central star (Φl∼5.8mas), extracted from the
modeling of Sec. 4. It corresponds to the respective diameters of 2.5 and 1 AU (assuming 5.95 ± 0.70 mas parallax from Lee 2007). The mean surface brightness ratio between the photosphere and the molecular environment is around 10%.
Following computations of Verhoelst et al. (2006), we mod-eled the spectral dependency of the optical depth as a sum of wa-ter vapor (mainly contributing in the range 1.75 − 2.15 µm), and CO (below 1.75 µm and above 2.3 µm). However, we had to add a continuum opacity of constant value ≈0.2 to be able to fairly reproduce the observed curve. Accordingly, the optical depth of the layer is always greater than 0.4 over the complete spectral range : it is impossible to see the photosphere alone. The pres-ence of this continuum opacity, as well as the discrepencies in the fit, will require adapted modeling before being understood.
The simple star+layer model was able to reproduce almost all the visibility points with V > 15% but clearly failed at higher spatial frequency. An important feature in the visibility curves is the increase of contrast with baseline observed around Bλ= 45
for the spectral bins around 1.8 µm. It could be tempting to iden-tify it as a “visibility second lobe” following a “visibility null” (confirmed by the closure phases). This visibility lobe is appar-ently no longer observed around 1.9 µm and above. The only way to continuously remove a visibility null is i) to fill it with unresolved flux or ii) to displace it to infinite spatial frequen-cies by smoothing the corresponding edge, and iii) to add im-portant asymmetries so that the visibility becomes a complex number around the null. The two first cases are not plausible in our case because the visibility around Bλ = 45 never reaches
0 in the entire dataset. We conclude that the visibility profiles cannot be explained by an axisymmetric distribution continu-ous in wavelength. Undoubtedly, such an effect would have been missed with a less complete spectral and/or spatial coverage.
5. Conclusions
We believe this letter presents the first interferometric observa-tions of a Mira star with a dataset almost continuous in the spec-tral and in the spatial domain. Obtaining it in a short amount of time has been made possible by the use of the AMBER spectro-graph associated with the relocatable ATs of VLTI.
Individual spectral channel image reconstruction was achieved using the MIRA software. It provides confirmation of the existence of a spherical molecular shell at ≈ 1 AU of the photosphere. Between 1.5 − 2.4 µm we did not find any spectral region where the brightness profile of T Lep can be explained by a single Gaussian or a single LDD. Conversely, when using a simple radiative transfer model we never found an optical depth less than 0.4 for the layer surrounding the photosphere. Rough modeling points to a continuum emission within the molecular shell, in addition to the CO and H2O features.
Acknowledgements. JBLB thanks the complete VLTI team. We acknowledge
the use of the AAVSO International Database, of the Smithsonian/NASA Astrophysics Data System, and of the Centre de Donnees Astronomiques de Strasbourg. All graphics were drawn with the freeware yorick.
References
2007, Hipparcos, the new reduction of the raw data (Springer) Cotton, W., Monnier, J., Baron, F., et al. 2008, in SPIE Conf., Vol. 7013 Haguenauer, P., Abuter, R., Alonso, J., et al. 2008, in SPIE Conf., Vol. 7013 Ireland, M. J. & Scholz, M. 2006, MNRAS, 367, 1585
Le Besnerais, G., Lacour, S., Mugnier, L. M., et al. 2008, in IEEE Journal of Selected Topics in Signal Processing
Le Bouquin, J.-B., Abuter, R., Bauvir, B., et al. 2008, in SPIE Conf., Vol. 7013 Loup, C., Forveille, T., Omont, A., & Paul, J. F. 1993, A&AS, 99, 291 Mennesson, B., Perrin, G., Chagnon, G., et al. 2002, ApJ, 579, 446 Millan-Gabet, R., Pedretti, E., Monnier, J. D., et al. 2005, ApJ, 620, 961
Ohnaka, K. 2004, A&A, 424, 1011
Ohnaka, K., Scholz, M., & Wood, P. R. 2006, A&A, 446, 1119
Perrin, G., Coud´e du Foresto, V., Ridgway, S. T., et al. 1999, A&A, 345, 221 Perrin, G., Ridgway, S. T., Mennesson, B., et al. 2004, A&A, 426, 279 Petrov, R. G., Malbet, F., Weigelt, G., et al. 2007, A&A, 464, 1 Ragland, S., Traub, W. A., Berger, J.-P., et al. 2006, ApJ, 652, 650
Samus, N., Durlevich, O. V., & et al. 2004, VizieR Online Data Catalog, 2250, 0 Tatulli, E. & AMBER consortium. 2007, A&A, 464, 29
Thiebaut, E. 2008, in SPIE Conf., Vol. 7013
Thompson, R., Creech-Eakman, M. J., & van Belle, G. 2002, ApJ, 577, 447 Verhoelst, T., Decin, L., van Malderen, R., et al. 2006, A&A, 447, 311 Whitelock, P., Marang, F., & Feast, M. 2000, MNRAS, 319, 728 Wittkowski, M., Boboltz, D. A., Driebe, T., et al. 2008, A&A, 479, L21 Wittkowski, M., Boboltz, D. A., Ohnaka, K., et al. 2007, A&A, 470, 191 Woodruff, H. C., Eberhardt, M., Driebe, T., et al. 2004, A&A, 421, 703 Woodruff, H. C., Tuthill, P. G., Monnier, J. D., et al. 2008, ApJ, 673, 418
List of Objects ‘T Lep’ on page 1 ‘T Lep’ on page 2 ‘T Lep’ on page 2 ‘T Lep’ on page 2 ‘T Lep’ on page 2 ‘T Lep’ on page 2 ‘T Lep’ on page 4 ‘T Lep’ on page 4