based on a Single Measure for BRT in China
The MIT Faculty has made this article openly available.
Please share
how this access benefits you. Your story matters.
Citation
Huo, Yueying; Zhao, Jinhua; Zhang, Jian and Qiu, Feng
“Development of Level-of-Service Criteria Based on a Single
Measure for BRT in China.” Journal of Public Transportation 18, no.
2 (June 2015): 20–33.
As Published
http://dx.doi.org/10.5038/2375-0901.18.2.2
Publisher
University of South Florida
Version
Final published version
Citable link
http://hdl.handle.net/1721.1/108094
Terms of Use
Creative Commons Attribution-Noncommercial
Criteria based on a Single Measure for
BRT in China
Yueying Huo
Inner Mongolia University
Jinhua Zhao
Massachusetts Institute of Technology
Jian Zhang and Feng Qiu
Southeast University
Abstract
Bus rapid transit (BRT) has gained popularity as a cost-effective way of expanding public transit services, and its level of service (LOS) is receiving increasing attention. However, rela-tively little is known about the precise criteria that can consistently and objecrela-tively classify the LOS of BRT into different levels. This paper introduces the measure of “unit delay” to develop BRT LOS criteria, defined as the sum of delays a bus experiences at stops and inter-sections and on a 100m link. Based on field surveys conducted on BRT in Changzhou, China, we obtained a unit delay data set and established BRT LOS criteria using Fuzzy C-means Clustering. The LOS criteria can be applied for operational, design, and planning analyses for BRT systems. A method to examine the operational conditions in spatial and temporal dimensions and pinpoint the service bottlenecks of a BRT system is presented.
Key words: Level of service criteria, bus rapid transit, unit delay, Fuzzy C-means clustering
Introduction
Bus rapid transit (BRT) combines the efficiency and reliability of rail service with the operating flexibility and lower cost of conventional bus service. Many cities are turning to BRT as a way to cost-effectively expand public transit services to relieve traffic congestion, reduce fuel consumption and carbon emissions, and increase mobility options for the poor (Cervero and Kang 2011). BRT has been implemented throughout Latin America and North America, Europe, Asia, Australia, and, now increasingly, in Africa and India (Deng and Nelson 2011). In China, BRT has expanded faster than in any other regions over the last five years (Fjellstrom 2010). By the end of 2014, BRT was implemented in 19 cities in
China, and its total length has reached 529km (Institute for Transportation & Develop-ment Policy 2015).
Level of service (LOS) as a way to quantify service quality of BRT is receiving increasing attention. BRT LOS criteria, which classify the LOS of BRT into several levels, are an effective method to evaluate the service quality of BRT and can provide useful tools for communicating the service quality of BRT to laypersons and decision makers. BRT LOS criteria also can be used for BRT design analysis to allow a new or modified BRT facility to operate at a desired LOS. Typically, analysts can use BRT LOS criteria to determine values for elements such as stop space, berth number, and route number at one stop.
Issues about the planning, design, and passenger-carrying capacity of BRT have been well researched in China (Xu 2007, Mo 2007, Wu 2010, Lu 2011). Researchers outside China focus more on the impacts of BRT on land use, fuel consumption, pollution emissions, and traveler behavior (Zargari and Khan 2002, McDonnell et al. 2008, Mishra et al. 2010, Perk et al. 2010, McDonnell and Zellner 2011, Aiga 2014). However, relatively little aca-demic focus has centered on BRT LOS criteria. Therefore, this study generated scenarios to investigate BRT LOS criteria in China.
First, research progress on LOS criteria of urban streets and public transit are reviewed. This is followed by the introduction of BRT development in China. Next, a research methodology involving measure selection, level number of LOS, theoretical approach for LOS partitioning, and supporting data sources is presented. Finally, BRT LOS criteria are established and their applications are discussed.
Literature Review
The concept of LOS was introduced in the 1965 edition of the Highway Capacity Manual (HCM), which presented the now-familiar letter-grade system for characterizing the qual-ity of operations on a variety of traffic facilities, from intersections to freeways (Roess et al. 2010). LOS is a quantitative stratification of a performance measure or measures that represent quality of service (TRB 2010). HCM defines six levels of service, ranging from A to F, with LOS A representing the best operating conditions from the traveler’s perspec-tive and LOS F the worst.
The 2010 edition of HCM provides LOS criteria for freeways, multi-lane highways, two-way hightwo-ways, urban streets, and intersections. BRT is a portion of an urban street; thus, the LOS criteria for urban streets in HCM 2010 are introduced below. An urban street right-of-way is shared by four types of travel modes—automobile, pedestrian, bicycle, and transit—and each mode uses its assigned portion of the right-of-way. HCM 2010 provides separate LOS criteria for these four modes on urban streets. Through-vehicle travel speed and auto LOS scores are used to characterize automobile LOS. Pedestrian LOS scores and average pedestrian space on a sidewalk are used as measures to classify pedestrian LOS into six levels. LOS scores reported by travelers are used to describe LOS for bicycle and transit modes. The LOS score is the common service quality measure for the four modes on urban streets. Therefore, it can be used to compare the relative quality of service pro-vided to the users of each mode and to estimate the impact of reallocating street right-of-way on each mode’s quality of service.
LOS criteria in HCM are more suitable for traffic conditions in North America, particularly the United States. Bhuyan and Rao (2010), Mohapatra et al. (2012), Das and Bhuyan (2014) addressed LOS criteria for highly heterogeneous traffic flow on urban streets in India using a clustering algorithm and found that speed thresholds for LOS criteria in India are lower than those mentioned in HCM. Historically, HCM has used a single performance measure as the basis for defining LOS. Different from this, researchers in China use multi-ple measures to characterize LOS for urban streets. For exammulti-ple, Xu et al. (2008) proposed LOS criteria for urban streets by considering density, speed, volume-to-capacity ratio, and service flow rate.
BRT is a new form of public transit; LOS criteria of public transit are discussed below. The
Transit Capacity and Quality of Service Manual, 3rd Edition (TCQSM 2013), provides
sys-tematic and detailed introductions to LOS criteria for public transit (TRB 2013). For fixed-route transit service, TCQSM 2013 uses two categories of service measures—availability and comfort & convenience—to evaluate service quality. The measures for availability include frequency, service span, and access. The measures for comfort & convenience include passenger load, reliability (on-time performance and headway adherence), and transit-auto travel time ratio. TCQSM 2013 also presents LOS criteria (called quality of service tables) for each service measure, which eliminate the LOS letters associated with the transit quality of service measures. Eliminating the letters has allowed LOS criteria to show more or fewer service levels, as appropriate, rather than being forced to fit the levels to the six letters, as before. The selection of thresholds in LOS criteria for service measures represents a collective professional judgment.
Recognizing that transportation planners and engineers generally are comfortable with letter-grade LOS, TCQSM 2013 introduced the transit LOS score as the measure of transit quality on urban streets. This measure provides a single transit LOS letter as its output while incorporating most of the factors included in the manual’s transit service quality framework. This measure also can be incorporated into an overall evaluation of the ser-vice quality provided to all urban street users—transit passengers, pedestrians, bicyclists, and motorists.
The LOS criteria of public transit are characterized by multiple measures in TCQSM 2013. The disadvantage of an LOS evaluation system with multiple measures is that it does not allow definite benchmarking of different systems (Xin et al. 2005). Different from the approach adopted in TCQSM 2013, Chen (1999) and Xu (2001) developed LOS criteria for exclusive bus lanes based solely on a single measure—delay.
BRT in China
BRT has expanded and evolved in China since the first median bus lanes were introduced in Kunming in 1999. However, with no special BRT buses or pre-board fare collection, and no significantly improved station environment, Kunming is not regarded as a full-fledged BRT system. Beijing was, in 2005, the first full BRT system to open in China, in the sense that it provides high-capacity BRT buses, fare collection at stations rather than on buses, and dedicated bus lanes for most of its length (Fjellstrom 2010).
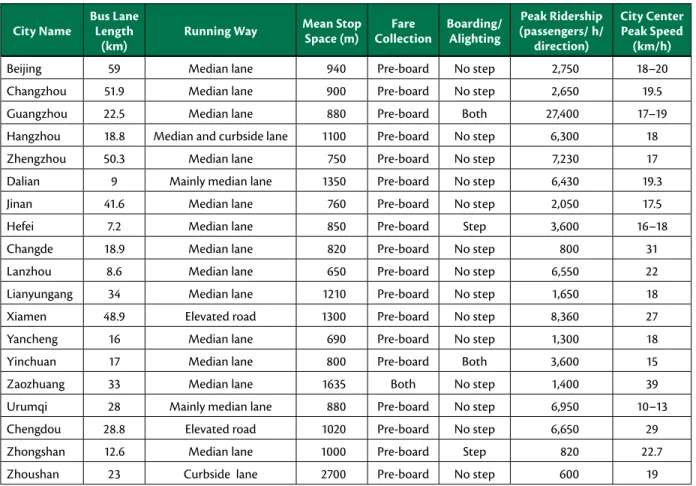
Information on running ways, stop space, fare collection, ridership, and speed of BRT sys-tems in China is detailed in Table 1. A majority of BRT syssys-tems in China use median bus lanes as running ways and on-line stations rather than bus bays for bus stopping. Fare col-lection is mainly off-board, and passengers pay or swipe at stations. Because of low-floor buses or high platforms, most BRT systems allow level passenger boarding and alighting. BRT ridership among these cities varies greatly, ranging from 600 passengers per hour per direction in Zhoushan to 27,400 passengers per hour per direction in Guangzhou. Peak-hour speeds in city centers also differ, with 39km/h in Zaozhuang compared to about 10km/h in Urumqi.
TABLE 1. Design and Operation Features of BRT in China
City Name Bus Lane Length
(km) Running Way
Mean Stop
Space (m) CollectionFare Boarding/ Alighting
Peak Ridership (passengers/ h/ direction) City Center Peak Speed (km/h)
Beijing 59 Median lane 940 Pre-board No step 2,750 18–20
Changzhou 51.9 Median lane 900 Pre-board No step 2,650 19.5
Guangzhou 22.5 Median lane 880 Pre-board Both 27,400 17–19
Hangzhou 18.8 Median and curbside lane 1100 Pre-board No step 6,300 18
Zhengzhou 50.3 Median lane 750 Pre-board No step 7,230 17
Dalian 9 Mainly median lane 1350 Pre-board No step 6,430 19.3
Jinan 41.6 Median lane 760 Pre-board No step 2,050 17.5
Hefei 7.2 Median lane 850 Pre-board Step 3,600 16–18
Changde 18.9 Median lane 820 Pre-board No step 800 31
Lanzhou 8.6 Median lane 650 Pre-board No step 6,550 22
Lianyungang 34 Median lane 1210 Pre-board No step 1,650 18
Xiamen 48.9 Elevated road 1300 Pre-board No step 8,360 27
Yancheng 16 Median lane 690 Pre-board No step 1,300 18
Yinchuan 17 Median lane 800 Pre-board Both 3,600 15
Zaozhuang 33 Median lane 1635 Both No step 1,400 39
Urumqi 28 Mainly median lane 880 Pre-board No step 6,950 10–13
Chengdou 28.8 Elevated road 1020 Pre-board No step 6,650 29
Zhongshan 12.6 Median lane 1000 Pre-board Step 820 22.7
Zhoushan 23 Curbside lane 2700 Pre-board No step 600 19
All BRT systems in China use on-line stations.
Source: Bus Rapid Transit Information. www.worldbrt.net/defaulten.aspx, accessed April 8, 2015.
To collect data for this research, surveys were conducted on the Changzhou BRT, which opened in January 2008 and currently has two trunk routes, six branch routes, three sec-tion routes, and two loop routes. Its operasec-tion mode is direct-service operasec-tions. The run-ning ways are dedicated median bus lanes that are about 3.75m wide. The system has 58 stations, each about 3m wide and 60m long and spaced roughly 900m apart and located close to intersections. The system has 60 BRT vehicles, most of which are 18m articulated buses. Monitoring facilities are installed throughout system to prevent other vehicles
from entering. This system also includes intelligent technologies such as automated vehicle location (AVL), real-time passenger information, and transit signal priority (TSP).
Methodology
Measure Selection for LOS of BRT
BRT is a new type of public transit. Since BRT is located on urban streets, it has the char-acteristics of both public transit and urban streets. In HCM, a single measure is used to define the LOS of urban streets; however, TCQSM adopts multiple measures to evaluate LOS of public transit. This paper considered both HCM and TCQSM when selecting service measures for the LOS of BRT; a single measure to evaluate the LOS of BRT was sought and was selected through identifying the most pressing problems of bus transit in China from multiple service aspects such as availability, reliability, etc.
Availability, economy, comfort & convenience, and reliability are important aspects of bus transit service. At present, the Chinese government attaches great importance to public transit; many bus routes and stops are being planned for Chinese cities, and service times have been extended. Travelers can conveniently access bus service, availability in space and time are not a problem, and bus fares are low and affordable. Reliability is the most significant problem, and it is particularly urgent that it be improved. Late arrivals and departures and unreliable wait and travel times are major weaknesses. Comfort is also a significant problem, with buses too crowded during peak hours and no air conditioning in older buses. Lack of comfort is a derived problem and is exacerbated by unreliability; for example, uneven headways at stops, uncertain bus arrival times, and unreliable travel times all lead to passenger imbalance and crowding on buses. Comfort will be improved with improvements in reliability.
A BRT system includes links, stops, and intersections. Operational conditions on links are relatively unimpeded because of the use of exclusive rights-of-way, but stops and inter-sections can be traffic bottlenecks in a BRT system, where bus queues and bunching often occur, resulting in bus delays. Although delay of one bus at one stop or intersection may be small, the combined delay of all buses at all stops and intersections can be significant and can result in large economic losses. Accumulated delays at stops, intersections, and links result in unreliability of the entire BRT operation. Therefore, BRT delay—the sum of delays of buses at all stops, intersections, and links within a BRT system—is the appropri-ate measure of BRT LOS.
Estimation Model for Delay
This study aimed to develop BRT LOS criteria, but the LOS criteria based on BRT delay cannot provide a benchmark for comparing different BRT systems. Therefore, “unit delay” was used to develop BRT LOS criteria. Unit delay in this paper is defined as the sum of delays a bus experiences at stops and intersections and on a 100m link (Note: To compare the LOS of different BRT systems, “link” is a 100m link; the delay on a 100m link equals average delay per 100m link).
A near-side stop is a bus stop immediately prior to an intersection at which buses stop to serve passengers before crossing the intersection. Operational conditions at near-side stops are the worst within the BRT network, as bus queueing and bunching become more
severe under the additional interferences of traffic lights at downstream intersections. Bus delays at near-side stops are generated mainly from bus queueing and bunching, and bus delay at near-side stops includes delays at both stops and intersections.
Huo (2013) built a model for bus delay at near-side stops, as shown in Equation (1). This model was validated by data collected from near-side stops on the Changzhou BRT and bus transit in Vancouver, with accuracy of 81.32% and 75.07%, respectively (Huo 2013, Huo 2015). This model was used to calculate the unit delay shown below.
(1)
Where, D represents the delay a bus experiences at near-side stop (s/vehicle), ϴ indicates
the fraction of waiting time variation resulting from buses being blocked from exiting a stop by buses in front and/or by a red light (estimated to be 0.467 based on collected data from Changzhou BRT), λ represents the mean arrival rate (vehicle/s), μ represents
the mean service rate (vehicle/s/berth), s represents the berth number at the stop, tr
represents the red time at the downstream intersection (s), C represents the cycle length
at the downstream intersection (s), n represents the number of buses included in service
and in queue at the stop, and
Theoretical Method for LOS Criteria
Defining LOS criteria is a classification problem, and from the literature it was determined that cluster analysis is the most suitable technique for solving this kind of problem (Bhu-yan and Rao 2010, Mohapatra et al. 2012, Das and Bhu(Bhu-yan 2014). Fuzzy C-Means clustering (FCM), developed by Dunn in 1973 and improved by Bezdek in 1981, is a cluster analysis method derived from fuzzy logic (Bezdek et al. 1984) that allows a dataset to be grouped into C clusters, with every data point in the dataset belonging to every cluster to a cer-tain degree, which makes the cluster result of FCM closer to reality (Bezdek et al. 1984). Therefore, FCM is the most frequently-used cluster analysis method (Yue et al. 2014). In the study of LOS criteria, Bhuyan and Rao (2010) applied FCM to develop LOS criteria for urban streets in India. Mohapatra et al. (2012) used a hybrid algorithm based on FCM in association with a genetic algorithm (GA) to investigate LOS criteria for urban streets. Cheol and Stephen (2002) applied FCM and other methods to develop real-time
induc-tive-signature-based LOS criteria for a signalized intersection surveillance system. There-fore, based on analysis of literature, this study used FCM to establish BRT LOS criteria.
Level Number Defined
In China, LOS for a roadway facility, such as a freeway or an urban street, is classified into four levels (Xu et al. 2008), which is different from HCM’s six levels. BRT is a part of urban streets; thus, the LOS of BRT was defined as four levels in this study, ranging from 1 to 4, with LOS 1 representing the best operating conditions and LOS 4 the worst.
As mentioned, unit delay was used to establish BRT LOS criteria; therefore, BRT LOS cri-teria were interpreted in the style of Table 2, where D0 represents unit delay in BRT and
d1, d2, and d3 represent unit delay thresholds. Establishing BRT LOS criteria is determining unit delay thresholds for partitioning different levels, i.e., determining the values for d1,
d2, and d3 in Table 2.
TABLE 2.
Proposed BRT LOS Criteria
LOS Unit Delay
1 D0 ≤ d1 2 d1 < D0 ≤ d2 3 d2 < D0 ≤ d3 4 D0 > d3
Unit Delay Data Set Used for BRT LOS Criteria
Unit delay refers to the sum of delays a bus experiences at stops or intersections and on 100m links. Analyzed as above, bus delay at near-side stops includes delays at both stops and intersections. Thus, we used the estimation model for bus delay at near-side stops (Equation [1]) to obtain unit delay data set: 1) determine the variable values in Equation (1), 2) match the values of the variables and form different variable value combinations, 3) calculate the sum of delays at stops and intersections under each variable value com-bination with Equation (1), and 4) obtain the unit delay data set by adding the delay on a 100m link to the sum of delays at stops and intersections.
The variables in Equation (1) include mean arrival rate, mean service rate, and berth num-ber at a near-side stop and red time and cycle length at downstream intersections. Mean arrival rate is the mean of the number of arrival buses per unit time. Mean service rate is the service capacity of each berth at a stop and is the reciprocal of average service time. Service time is the time that a bus spends at a stop and equals the difference between the time it exits the stop and the time it begins to decelerate.
To gain values for these variables and delay on a 100m link, three types of field surveys were conducted for the Changzhou BRT on April 11 and 12, 2013: 1) mean arrival rate and mean service rate at near-side stops, 2) berth number, red time, and cycle length, and 3) delay on links. For the first type of survey, the two busiest near-side stops were selected, with one surveyor for each stop, who recorded all buses arriving at the stop from 9:00– 18:00 and, for each arriving bus, recorded the time when it began to decelerate t1 and the time when it exited the stop t2. Values for mean arrival rate were derived by counting the
number of arriving buses per hour. Service time for each bus is t1 minus t2, and average service time is the mean of service time of all arriving buses per hour. Values for mean service rate were derived by calculating the reciprocal of average service time.
For the second type of survey, 10 near-side stops were randomly selected, with one sur-veyor to record berth numbers, red times, and cycle lengths. For the third type of survey, 10 links near the selected stops were chosen, with one surveyor to observe bus delay. It is found that buses are almost unimpeded on BRT links due to exclusive rights-of-way, and bus delay on 100m links is approximately 0.5s.
Based on the collected data from the field surveys, the variable values used to produce the unit delay data set were identified, as shown in Table 3. The variable ranges in Table 3 cover as many values as possible in practice and, thus, the unit delay data set is feasible for BRT LOS criteria.
TABLE 3.
Values for Variables in Equation (1)
Variables Ranges Step Size Number
Mean arrival rate (vehicle/h) 20–80 5 13
Mean service rate (vehicle/h/berth) 60–120 10 7
Berth number 2–4 1 3
Red time (s) 60–130 10 8
Cycle length (s) 90–150 10 7
Based on the variable values in Table 3, all the values for all the variables were matched, and different variable value combinations were generated accordingly. The values for mean arrival rate, mean service rate, berth number, red time, and cycle length were 13, 7, 3, 8, and 7, respectively. Therefore, the number of variable value combinations was 15,288 (13×7×3×8×7).
The variable values in Equation (1) were set in the variable value combinations, and the sum of delays a bus experiences at stops and intersections under all the variable value combinations was calculated. Finally, 0.5s (bus delay on a 100m link) was added, and the unit delay data set was obtained, at 15,288.
BRT LOS Criteria Results
Based on the unit delay data set built above, BRT LOS criteria using FCM were established. Cluster numbers in FCM are the four level numbers of BRT LOS. Cluster centers in FCM are median values between adjacent levels of BRT LOS, and thresholds between adjacent levels can be determined on the basis of the median values. Cluster results for unit delay using FCM are shown in Table 4.
TABLE 4.
Cluster Results of Unit Delay using FCM
Category Cluster Centers of Unit Delay (s)
1 7
2 18
3 37
By calculating the average values of adjacent cluster centers, the thresholds between adja-cent levels of BRT LOS were determined, and BRT LOS criteria were established, as shown in Table 5. Unit delay was less than 13s at LOS 1; when unit delay increased to 28s, BRT LOS deteriorated to LOS 2; when unit delay was between 28s and 53s, it was LOS 3; and when unit delay was more than 53s, it was the worst operating condition, LOS 4. What the four LOS ranges represent from a transit operator perspective are shown in Table 5. (Note: The variables for the unit delay data set were collected from BRT systems in which bus overtaking maneuvers are prohibited; thus, the BRT LOS criteria in Table 5 are suitable only for BRT systems in which bus overtaking maneuvers are prohibited.)
TABLE 5.
BRT LOS Criteria in Changzhou
LOS Unit Delay (s) Operator Perspective
1 <13 Slight bus queueing and bunching at a stop and intersection; transit agency does not need to take traffic control actions.
2 13–28 Moderate bus queueing and bunching at a stop and intersection; transit agency needs to arrange traffic police to disperse bus flow during peak hours
3 28–53
Frequent bus queueing and bunching at a stop and intersection; transit agency needs to take action such as adjusting signal timing or increasing berth to transform current BRT
4 >53 Serious bus queueing and bunching at a stop, an intersection, and on a link; government needs to construct new BRT routes to meet passenger demands.
Note: Unit delay refers to the sum of delays a bus experiences continuously at stops and intersections and on a 100m-long link within a BRT system.
Applications
The BRT LOS criteria established above have potential applications for operational, design, and planning analyses for BRT systems.
• Operational analyses review operational conditions (levels of service) of sub-segments within BRT systems and generally are oriented toward current conditions of BRT systems. They aim at identifying operational bottlenecks of BRT systems and providing information for decisions on whether there is a need for improvements to an existing station, link, or facility.
• Design analyses apply the BRT LOS criteria to determine the required physical features that will allow a new or modified BRT to operate at a desired LOS. They are usually targeted at mid- to long-term implementation of BRT systems. Typically, analysts can use BRT LOS criteria to determine such elements as spacing and location of stations, berth number, frequency of bus service, and route number.
• Planning analyses typically focus on future conditions and provide information for decisions on whether there is a need to construct a new BRT and evaluate a series of alternatives.
Further studies are required to develop the methods for all three types of applications. The following presents one method for operational analysis.
A BRT’s operational conditions vary in spatial and temporal dimensions; operational conditions differ in different sub-segments and during different time periods. Thus,
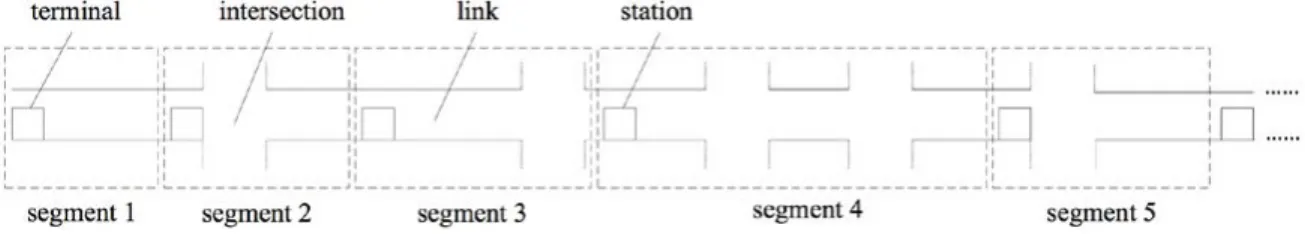
oper-ational analysis should reflect operating conditions by sub-segment and by time period. Based on this idea, the following method was used to carry out an operational analysis. First, divide a BRT system into several segments; beginning at a terminal, the sections between two BRT stations are identified as segments, and the division of that segment ends at the next terminal. The division method is illustrated in Figure 1.
FIGURE 1. Method for dividing BRT into segments
Second, evaluate the operating conditions of each segment during all time periods, e.g., every 15 min, 20 min, 30 min, etc. Table 6 shows the operational analysis for a segment. To complete the operational analysis for a segment, obtain data for the delays a bus experi-ences on links or at stations and/or intersections in the segment during all time periods; the types of delays can be obtained through field surveys or using existing models. Delays on links are converted into delays on a 100m link; one or more intersections may be included within the segment (as indicated in the division method of segments). If there are no intersections, intersection delay is 0. If there are two or more intersections, inter-section delay equals the average delay of multiple interinter-sections. Determine unit delay by adding these delays together. Then, based on the established BRT LOS criteria (Table 5), identify the levels of service for a segment during all time periods.
TABLE 6.
Operational Analysis Table for Segment on BRT
Segment number Link length intersection included: Yes or No
Time
Periods Delay on Links (s) 100m Link (s)Delay on Station (s)Delay at Intersection (s)Delay at Unit Delay for Segment (s) SegmentLOS for
6:00–6:30 6:30–7:00 7:00–7:30 7:30–8:00 …… 18:30–19:00 19:00–19:30 19:30–20:00
Finally, complete the operational analysis by obtaining the operational analysis results of all the segments. Table 7 shows the operational analysis table for a BRT, which is formed by gathering levels of service and unit delays of all segments during all time periods. The operational conditions by segment and by time period are clear, and the service bottle-necks of the BRT system are obtained.
LOS / Unit Delay (s) Segment Time Period 1 2 3 4 5 6 ….. 6:00-6:30 6:30-7:00 7:00-7:30 7:30-8:00 …… 19:00-19:30 19:30-20:00
Conclusions
This study aimed to establish consistent and objective criteria for BRT LOS in China. To make operational conditions comparable across different BRT systems, a new measure of “unit delay”—the sum of delays a bus experiences at stops and intersections and on a 100m link—was proposed to establish BRT LOS criteria. A unit delay data set was obtained by conducting field surveys and based on BRT LOS criteria in Changzhou estab-lished using FCM. These BRT LOS criteria can be applied to conduct operational, design, and planning analyses for BRT systems. They also provide a useful tool for communicating operational conditions of BRT to laypersons and non-technical policy makers. Finally, a method for operational analysis that applies BRT LOS criteria to examine operational conditions in spatial and temporal dimensions was presented.
One limitation of this study is that the LOS level number has been pre-determined to be 4, following a tradition of transportation facility LOS classification in China. However, the FCM method has the potential to decide the optimal number of levels on the basis of empirical data analysis. In addition, the BRT LOS criteria are based on objective delays. How to expand to and incorporate passenger perception into consideration remains an open question.
Acknowledgments
This research is jointly funded by the National Nature Science Foundation of China (No. 51208099, 51108080, and 51308115).
References
Aiga, S. 2014. “Does Bus Rapid Transit Influence Urban Land Development and Property Values: A Review of the Literature.” Transport Reviews: A Transnational
Transdisci-plinary Journal, 34 (3): 276-296.
Bezdek, J. C., R. Ehrlich, and W. Full. 1984. “FCM: The Fuzzy C-Means Clustering Algo-rithm.” Computers & Geosciences, 10 (2-3): 191-203.
TABLE 7.
Operational Analysis Table for a BRT System
Bhuyan, P. K., and K. V. K. Rao. 2010. “FCM Clustering Using GPS Data for Defining Level of Service Criteria of Urban Streets in Indian Context.” Transport Problems, 5 (4): 105-113.
Cervero, R., and C. D. Kang. 2011. “Bus rapid Transit Impacts on Land Uses and Land Val-ues in Seoul, Korea.” Transport Policy, 18: 102-116.
Chen, L. 1999. “Research on Level of Service and Service Volume of Bus Reserved Lanes.” Master’s thesis, Institute of Civil Engineering, National Taiwan University.
Cheol, O., and G. R. Stephen. 2002. “Real-Time Inductive-Signature-Based Level of Service for Signalized Intersections.” Transportation Research Record, 1802: 97-104.
Das, A. K, and P. K. Bhuyan. 2014. “Level of Service Criteria of Urban Streets Using Cluster-ing Large Application (CLARA).” Advances in Transportation Studies an International
Journal, B32: 75-88.
Deng, T. T., and J. D. Nelson. 2011. “Recent Developments in Bus Rapid Transit: A Review of the Literature.” Transport Reviews, 31 (1): 69-96.
Fjellstrom, K. 2010. “Bus Rapid Transit in China.” Built Environment, 36 (3): 363-374. Huo, Y. 2013. “Evaluation Method on Level of Service of Exclusive Bus Lane.” Doctoral
dissertation, School of Transportation, Southeast University, Nanjing.
Huo, Y., W. Li, J. Zhao, and S. Zhu. 2015. “Modelling Bus Delay at Bus Stops.” Transport, 30(2).
Institute for Transportation & Development Policy. Bus Rapid Transit Information. www. worldbrt.net/defaulten.aspx. Accessed April 8, 2015.
Lu, H. 2011. “Study on the Planning and Design Method of Bus Rapid Transit System.” Master’s thesis, School of Transportation, Shandong University, Jinan.
McDonnell, S., and M. Zellner. 2011. “Exploring the Effectiveness of Bus Rapid Transit: A Prototype Agent-Based Model of Commuting Behavior.” Transport Policy, 18: 825-835.
McDonnell, S., S. Ferreira, and F. Convery. 2008. “Using Bus Rapid Transit to Mitigate Emis-sions of CO2 from Transport.” Transport Reviews, 28 (6): 735-756.
Mishra, R. K., M. Parida, and S. Rangnekar. 2010. “Evaluation and Analysis of Traffic Noise along Bus Rapid Transit System Corridor.” Int. J. Environ. Sci. Tech., 6 (4): 37-750. Mo, Y. 2007. “Study on Optimization Algorithm of Route Design of BRT.” Traffic &
Trans-portation, 1.
Mohapatra, S. S., P. K. Bhuyan, and K. V. K. Rao. 2012. “Genetic Algorithm Fuzzy Clustering using GPS Data for Defining Level Oof Service Criteria of Urban Streets.” European
Transport, 52 (7).
Perk, V., M. Mugharbel, and M. Catalá. 2010. “Impacts of Bus Rapid Transit Stations on Surrounding Single-Family Home Values: Study of East Busway in Pittsburgh, Penn-sylvania.” Transportation Research Record, 2144: 72-79.
Roess, R. P., M. A. Vandehey, and W. Kittelson. 2010. “Level of Service 2010 and Beyond.”
Transportation Research Record, 2173: 20-27.
Transportation Research Board of the National Academies. 2010. Highway Capacity
Man-ual. Transportation Research Board, Washington, DC.
Transportation Research Board of the National Academies. 2013. TCRP Report 165:
Tran-sit Capacity and Quality of Service Manual, Third Edition. Transportation Research
Board, Washington, DC.
Wu, Y. 2010. “Research on Bus Rapid Transit Planning.” Master’s thesis, School of Transpor-tation, Chang’an University, Xian.
Xin, Y., L. Fu, and F. F. Saccomanno. 2005. “Assessing Transit Level of Service along Travel Corridors, Case Study using the Transit Capacity and Quality of Service Manual.”
Transportation Research Record, 1927: 259-267.
Xu, B. 2007. “Design of Urban Road Transit (BRT) System.” Urban Roads Bridges & Flood
Control, 5: 36-40.
Xu, L., X. Yang, S. Ai, and B. Jin. 2008. “Study the Service Level of the City Roads in Beijing.”
Traffic and Transportation: 43-45.
Xu, P. 2001. “Research on Evaluation Method of Level of Service of Bus Reserved Lanes.” Master’s thesis, Institute of Civil Engineering, National Taiwan University.
Yue, S., T. Huang, and P. Wang. 2014. “Matrix Eigenvalue Analysis-Based Clustering Validity Index.” Journal of Tianjin University (Science and Technology), 47 (8): 689-696. Zargari, S. A., and A. M. Khan. 2002. “Fuel Consumption Model for Bus Rapid Transit.”
Journal of Advanced Transportation, 37 (2): 139-157.
About the Authors
Yueying Huo (huoyueying2008@163.com) is an Assistant Professor at the
Transpor-tation Institute of Inner Mongolia University. She received a Ph.D. from the School of Transportation at Southeast University and studied at the University of British Columbia in 2011–2012. Her research interests include public transit planning, capacity, and service quality of public transit.Jinhua Zhao (jinhua@mit.edu) is an Assistant Professor in the Department of Urban
Studies and Planning at Massachusetts Institute of Technology (MIT). He holds a Ph.D. in City and Regional Planning and a master’s degree in Transportation and City Planning from the MIT. His research interests include urban development and planning in China, urban transportation systems in China, transportation economics, public transportation management, and urban information systems.Jian Zhang (jianzhang@seu.edu.cn) is an Assistant Professor in the School of
Transpor-tation in Southeast University and deputy director of the Research Center for Internet of Mobility at Southeast University. He received a Ph.D. in Transportation Engineering from Southeast University and studied at the University of Wisconsin Madison in 2009–2010.Journal of Public Transportation, Vol. 18, No. 2, 2015 33 His research interests include public transit planning, scheduling and intelligent transpor-tation systems.