Determination of Peptide and Protein Structure by Tandem Hass Spectrometry
by
Richard S. Johnson B.S., Iowa State University
( 1983>
Submitted to the Department of Chemistry in partial fulfillment of the requirements of the degree of
Doctor of Philosophy
at the
Massachusetts Institute
ot
Technology February 1988~ Massachusetts Institute of Technology 1988
Signature of Author
,.
Department of Chemistry, 5 February 1988
Certified by Accepted by ~ - .- ----~
...
".
Klaus Biemann Thesis SupervisorThis doctoral thesis has been examined by a Committee of the Department of Chemistry as follows:
Professor Daniel S. Kemp ••••
Chairman
Professor Klaus Biemann •••••.
Thesis Supervisor
3
DeteLmination of Peptide and Protein Structure
by Tandem Hass Spectrometry by
Richard
s.
JohnsonSubmitted to the Department of Chemistri of the Massachusetts Institute
of Technology on February 5, 1988, in partial fulfillment of the requirements for the degree of Doctor of Philosophy.
ABSTRACT
Fast atom bombardment mass spectrometry (FABHS) was employea to verify the DNA sequence of intracellular (non-glycosylated) and extracellular (glycosylated) invertase from the yeast SaccharolDyces cererisiae, and to locate points of N-glycosylation in the extracellula~ fo~m of this enzyme.
Collision induced dissociation (CID) mass spectra were acquired with a tandem high resolution mass spectrometer of E.B.(cc]E28} configuration (where £1 and E1 are the electric sectors of the first and second high resolution mass spectrometers in tandem, 8. and BJ are the magnetic sectors, and [ee] 1s
th~ collision cell) In this technique, a precurso~ Ion Is selected by the
first mass spectrometer
(BIB.),
fragmentation Is induced by collision with a neutral gas in the collision cell «(cc), and the masses of the resulting fragment ions are determinen by the the second mass spectrometer (EJB2) . Thus, peptide ion fragmentations were studied in a detail not previouslypossible; three as yet unreported fragmentation processes were characterized.
The structural information contalr.ed within such spectra was ascertained, and computer programs aiding the interpretation of
eIn
mass spectra ofpeptides of unknown sequence were written.
The use of tandem mass spectrometry in the sequencing of proteins vas demonstrated by the deter.lnation of the primary structures of three bacterial
thioredoxlns (small proteins of molecular weight 11,500) isolated from
Chlorobium thiosullatophiJum, Chromalium rinosum, and Rhodospirillum ,.ubrum,
and a mammalian thioredoxin isolated from rabbit bone marrow. Bnzymatic
digests and high perforaance liquid chromatography were used to obtain
peptides, which were detected by FABMS and their sequences determined from their CIO mass spectra.
Thesis Supervisor: Dr. Klaus Biemann
Table of Contents
Page S~ct1on I. Introduction
1.1 Hass Spectrometry of Peptldas and Proteins ....•... 19 I.2 Fast Atom Bombardment Ionization ...•... 23 1.3 Collision Induced Dissociation •.•....•...•. 26 I.4 Linked Scans for Double Focusing Hass Spectrometers 29 1.5 Alternative Instrumentation for HS/MS of Peptides •...•.... 32 1.6 Preparation of Peptldes for Hass Spectral Analysis ...
G....
35 1.7 Instrumentation and Deta Acquisition ...•... 36 Section II. Verification of the DNA Sequence ot the Gene Coding forInvertase in Saccharomyces cere,isiae, and Location
of the Sites of N-Glycosylation in External Invertase II.l
II.2
II.3
II.4
Introduction ..•... " •.••..•...•..•... Materials and Methods ••• 0 • • • • • • II• • • • • • (I • • • , • • • • • • • • • •II . . . .
Resul ts .••...•...c o• • • • • • • • • II• • • • • • • • • • w • • • • • • • Discussion 42 44 50 59
Section III. Collision Induced Fragmentations of Peptide Ions
111.1 Introduction... 65
I1I.2 Materials and Methods ...•.•..•..•...
0...
66111.3 Nomenclature ••••••••••••••• " •••••••.••••••••.•..•
0...
70Il1.4 Charge Induced Fragmentations •••••••....•...•...•..
e..
73 II1.S Remote Site Fragmentations ....•..e...
82III.5.a Differentiation of Leucine and Isoleucine by Cleavage of the ~,Y-Bond of C-Terminal Fragment Ions of Peptides
o.
95 III.5.b Differentiation of Leucine and Isoleucine by Cleavage ofthe ~,Y-Bond of N-Terminal Fragment Ions of Pept1des •. 115 Altering Fragmentations Via Derivatlzatlon of Peptides 130
III.S.c Cleavage of the a,~-Bond of C-Term1nal Fragment Ions
of Peptides •..0 • • • • • • • • • • • • • • • • • • • • • • • • • • • " • • • • • • • • • • • 139
I11.6
Miscellaneous Ions •.••.•.•••..•...
~ ~ lSI III.7 Conclusion ..•.••...•.••.•..•••••.•••.••...0 • • • • • • • • • ~ • • 0 • • 1525
page
Section IV. Interpretation of CIO Mass Spectra Obtained From Peptides of Unknown Sequence Using the Computer Programs SEQPEP and ALTSEQ
IV.l Introduction •..•....•...••... e _ • • • • • • • • • " • • • • • • • • " . . 157 IV.2 Generation of Complete Sequences Using SBQPEP 164 IV.2.a Generation of Subsequences Using SEQPEP 164
IV.2.b Scoring of Amino Acid Extensions in SEQPEP 178
IV.2.c User Specified Parameters in SEQPEP n 182
IV.3 Generation of Complete Sequences Using ALTSEQ 186
IV.3.a Generation of Subsequences Using ALTSEQ " •... 186
IV.3.b Scoring of Amino Acid Extensions In ALTSEQ J90
IV.3.e User Specified Parameters in ALTSEQ 193
IV.4 Determination of Sequence Scores for Complete Sequencas 196 IV.5 Examples Using SEOPEP and ALTSEQ ...• ~ _ 199 IV.6 General Rules of Interpretation - Using SEQPEP and ALTSEQ 221
Section V. Primary Structure of the Thio~edoxin Isolated From
Chlorobium thiosulfatophiJum Using a Combination
of Hass Spectrometric Methods
V.l Introduction ... ~ . . . . .. . . .. . . 227
V.2 Materials and Methods 229
V.3 Results and Discussion ...•... 231
V • 4 Con c 1us10n ••••••••••••••••••••••••• 0 • • • • • • • • • • • • • • • • • • • • • • • • 249
Section VI. Primary Structure of the Thioredoxin Isolated From
("'hromatium yinsosum Determined by High Performance
Tandem Mass Spectrometry
VI.l
VI.2 VI.3
VI.4
Introduction ...• a • • • • • • • • • • • • • • • • • • • • • • •
Materials and Methods ...•...~ .•... Results and Discussion ~ ...•.•...••...•.... Conclusion " ...•••..•...•...•••..••...•...•
252 253
254
282
Section VII. Primary Structure of the Thioredoxin Isolated From RhodospiriJJum rubrum Determined by 81gh Performance
Tandem Mass Spectrometry
VII.l
VII.2
VII.3
VII.4
Introduction ...••••... CI • • • • • • • • • • • • • • • • • ~ • • • • • • • • • •
Materials and Methods 0 • • • • • • •
Results and Discussion ..••...••.•.•...
Cone1us ion ..•... It• • • • • • • • • • • • • • • • • • • • • • e • • • • • • 284
284
285 308
page
Section VIII. Primary Structure of the Thioredoxin Isolated From Rabbit Bone Harrow Determined by High Performance Tandem Hass Spectrometry
VIII.l VIII.2
VIII,.3
VIII.4
Introduction ...•....c>.
Materials and Methods ~ 8 • • • •
Results and Discussion .
Summary of the thioredoxin sequences
-homology cons iderations .
310 310
312
334
Sec t Ion IX. Summary. . . • . . . .. . . • . . . 343
Section
x.
References •.. ~ ...••...••...~ •.•••... 346Section XI. Biographical note anJ publications/abstracts 357
7
Table of FlgurJ!§.
page
Section I
Figure 1.1: B- E plane diagram. • • •e • • • • • • • • • • • • • • • • • • • • Cl• • • • • • • • • 33
Figure 1.2: Schematic diagram of the BXIIO/BXIIO
mass spectrometer .••••••••.••••••••.•.•~... 37
Section II
Magnetic field ys. reference voltage diagram •••.e • • • 40
Figure II.l: BPLC chromatogram of a tryptic I ~ aureous
protease digestion of internal invertase ••..•....•.. 46 Figure 11.2: BPLC chromatogram of a tryptic / S aureous
protease digestion of Indo B treated
external invertase ••.•.•...••...••...•.•... 47 Figure 11.3: BPLC chromatogram of a chymotrypt1c digest of Endo B
treated external invertase •••••••••••••••..•
0...
48 Figure 11.4: FAB mass spectra of BPLC fraction 3 of a tryptic I~~ aureous protease digestion of (a) internal
invertase and (b) Indo B treated external invertase. 52 Figure 11.5: Amino acid sequence of external invertase .•..•..•.•• 55 Figure 11.6: FAS mass spectra of BPLC fraction 7 of a chymotryptic
digest of Indo B treated external invertase (a) berote, Cb) after one Bd.an cycle,
and (c) after two Bdaan cycles •••••••••.••..•
0...
58 Figure 11.7: CID mass spectrum of a peptlae encc.passlng positions387-· 397 of external inver tase e • • 60
Section III
Figure 111.1: CID BaSS spectrum of the b2 ion found in the FAB
mass spectru. of Phe-Leu-Glu-Glu-Leu ••.••.•••••••••• 79
Pigure 111.2: CID aass spectrua of the bJ ion found in the PAB
mass spectrum of ~-lipotropin(1-10) ..•• ~... 79
Figure III.3~ FAD mass spectrum of the £-trl.ethylpyr1diniua
(TMP+) derivative of
K(TMP+)-I-a-p-p-B-L-L-V-Y-S
83'igure 111.4: CID mass spectra of (a) ~~derlYatl~edand
page
Figure III.S:
ero
mass spectra ~£ (a) under1vatized and<b) the THP+ derivative of K-I-H-P-F-B-L-L-V-Y-S 8~
Figure 111.6:
eIn
mass spectra of (a) underivatlzed andCb) the THP+ derivative of neurotensin (1-6) 87 Figure 111.7: eID mass spectra of (a) underivatized and
<b> the THP+ derivative of physalaemln 88
Figure 111.8: eIO mass spectrum of the mono-THP+-derivative of
grami c 1din S .•.••.•.••.• II • to • • • • • • • • • • • • • • • • • • • • • • • • • 94
Figure 11I.9: CID mass spectrum of underivatized gramicidin S 94
Figure III.I0: B2/E scan of the fragment ion m/z 607.3 found
in the FAB mass spectrum of neurotensin <1-6) Figure 111.11: CID mass spectra of (a) za and
<b>
za+~ foundin the FAB mass spectrum of fibrinopeptide A
Figure 111.12: CID mass spectrum of G-I-P-T-L-L-L-F-K
Figure IIle13: Expanded regions of the spectrum shown in
101
103
105
Fig. I I I .12 .••••.••••••••.•...•...••. ~ ..•...•• 0 109
Figure III.14: B2/E scan of the fragment ion m/z 522.3 found
in the FAB mass spectrum of substance P •.••...•.• 117
Figure III. IS: CIO mass spectra of (a) as and (b) 8 5+1 found
in the FAB mass spectrum of substance P ••••••• ~ •••• 119
Figure 111.16: CID mass spectrum of substance ~ .... o • • • • • • • • • • s • • • 120
Figure 111.17: Expanded region of the spectrum shown in
FIg. I I I •16 ••.••••••••••.•.••...•..•...•...f" • • 122 Figure III.18: CID mass spectrum of m/z 1275.7 found in the FAB
mass spectrum of substance P •••• d • • • • • • • • • • • ~ • • • • • • 124
Figure 111.19: CID mass spectra of (a) 8z found 1n the FAB mass
spectrum of F-L-E-R-L and (b) a2 found in the FAB
mass spectrum of ~-llpotropln •••. e • • • • • • • • • • • • • • • • • 131
Figure 111,20: CID mass spectra of (a) underivatized, <b> the
a-N
amidine derivative, and (e) the~-N-p-guanidinopropionyl derivative of ~-lipotropin 133 Figure Ill.21: PAS mass spectra of (a) underivatized and <b) the ~-N
~-guan1d1noprop1onylderivative of V-H-L-T-P-V-B-K. 135
Figure l1I.22: CID roass spectra of (a) uladerivat1zed and (b) the
9
page
Figure I11.23: CID mass spectra of (a) underivatized and (b) the ~-N ~-guanidinopropionylderivative of F-L... E··E-L
0...
137 Figure III.24: CIO mass spectra of (a) underivatized and <b> theo-N-~-guanidlnopropionyl derivative of
P-H-P-F-H-F-F-V-Y-K 138
Fig~re 111.25: CID mass spectra of Ca) D-Ala~-luteiniz1ng hormone releasing hormone and <b> N-lnethyl-Leu'-D-Ala
6-luteinizing hormone releasing hormone ....•. g • • • • • • • 144 Figure 111.26: Expanded regions of Figs. III.25<a) and III.25(b) 145
Figure 111.27: B2/E scan of m/z 567.4 found in the FAB mass
spectrum of D-Ala6-1uteinizing hormon~ releasing
hormone ••.•••.•••..•••••••••••••.••••••••••••.••.•• 147 Figure 111.28: 82tH scan of m/z 817.4 found in the FAB mass
spectrum of D-Ala6-1uteinizing hormone releasing
ho rmone l;l • • • • • • • • • • • • • 147
Section IV
Figure IV.I: CIO mass spectrum of bradykinin (R-P-P-G-F-S-P-F-R) . 205 Figure IV.2: CID mass spectrum of Lys-bradykinin
(K-R-P-P-G-F-S-P-P-R) 205
Amino acid sequence of Chlorobium thiosuJlatophiJum 234
CID mass spectrum of K-K-G-O-K-V-G-E-F e • • 206
Sample output from SBOPEP 219
CID mass spectrum of V-D-M-V-V-G-A-V-P-K 206
237
ern
mass spectrum of V~D-V-D-D-C-K~D-I-A-A-E-C-E.... 207CIO mass spectrum of T-T-L-S-O-T-L-E-K ... &• • • • • • 0 • • • 205
CID mass spectrum of F-H-A-L-S-E-K-F ....• ~...•.•..•• 206
CID mass spectrum of V-L-D-S-A-G-D-K-L-V~V-V-D.. ~... 207
CID
mass spectrum ofK-F-N-N-V-V-F-I-E ...•....
207HPLC chromatogram of a tryptic digest of
s-
carboxymethyla ted Chlorobium th1oredoxinFigure IV.3: Figure IV.4: Figure IV.5: Figure IV.6: Figure IV.7: Figure
IV.S:
Figure IV.9: Figure IV.I0: Section V Figure V. 1: Figure V.2:page
Figure V.3: CID mass spectrum of the tryptic peptide of
("+B)+ = m/z 811.4 from Chlorobillm thioredoxin 238
Figure V.4:
eIn
mass spectrum of the tryptic peptide of<H+8)+
=
m/z 1309.6 from Chlorobium thioredoxin 239Figure V.5:
ero
mass spectrum of the tryptic peptide of("+8)+
=
m/z 1015.5 from Chlorobium thioredoxin 240 Figure ~/.6 : Tvo-sector B/E linked scan of the tryptic peptide of<H+8)+
=
m/z 1772.9 from ChlorobiulD thioredoxin .•... 241Section VI
Figure VI.I: HPLC chromatogram of a tryptic digest of
s-
carbamidomethyla~~d Chroma tium yjnosum thioredoxin 256 Figure VI.2: CID mass spectrum of the tryptic peptide of(M+8>+ = m/z 246.2 from Chroma tium thioredoxin 263
Figure VI.3: CID mass spect~um of the tryptic peptIde of
("+B)+ = m/z 1047.4 from Chromatium thioredoxin 264 Figure VI.4:
ero
mass spectrum of the tryptic peptide of(H+B)+ = m/z 1379.7 from Chromatium thioredoxin 265 Figure VI.S: CID mass spectrum of the tryptic peptide of
("+8)+ = m/z 1762.7 from Chromatium thioredoxin 266 Figure VI.6: CID mass spectrum of the tryptic peptide of
<"+8)+ :: m/z 2049.0 from Chromatium thioredoxin 267 Figure VI.7: CID mass spectrum of the tryptic peptide of
(H+8)+ := m/z 631.3 from Chroma tium thioredoxin 268
Figure VI.8: CID mass spectrum of the tryptic peptide of
("+8)+
=
m/z 744.6 from Chromatium thioredoxin 269 Figure VI.9: CID mass spectrum of the trvptic peptide of(M+8)+
=
m/z 1063.9 from Chromatium thioredoxin 210Figure VI.IO: CID mass spectrum of the tryptic peptide of
(M+8)+
=
m/z 999.5 from Chromalium thioredoxin 271 Figure VI.II: eln mass spectrum of the tryptic / ~ aureousprotease peptide of <"+8)+ a m/z 1708.5 from
Chromalium thloredox1n •• 0 • • • •e • • • • • • • • • • • • • • • •0 • • • • 274
Figure VI.12: CID mass spectrum of the tryptic I chymotryptic peptide of ("+8)+ = m/z 620.9 from Chromalium thioredoxin .• 276
11
page
Figure VI.13: CID mass spectrum of the tryptic / chymotryptic peptide of \H+8)+ :: m/z 1004.1 from Chromatium th1oredoxin 277
Figure VI. 14: Amino acid sequence of Chroma/ium vinosum
thloredoxin ...•.•0 • • • • • • • • • • • • 278
Figure VI. IS: CID mass spectrum of the S. aureous protease peptide
of <M+8)+ = m/z 2586.5 0 • • • • • • • • • • • 281
Figure VI.16: CH+H)+ ion of intact Chromatium thioredoxin ••.•••.• 283
Section VII
Figure VII.I: HPLC chromatogram of a tryptic digest of
s-carbamidomethyla ted Rhodospirillum TUbrum
thioredoxin .. I 0 • • 286
Figure VII.2: eIO mass spectra of tryptic peptides of <H+8)+
=
m/z 789.4 from (a) E coli thloredoxin and
<b) R. rubrum 293
Figure VII.3: CID mass spectra of tryptic / ~~ aureous protease peptides of (a) ("+8)+ = m/z 882.5 and <b> (M+8)+
=
m/z 865.4 from R. rubrum ••••••••••••.•••(I • • • • • • • • • • • 298
Figure VII.4: Amino acid sequence of R. rubrulD thioredoxln •.••.••. 306
Section VIII
Figure VIII.I: BPLC chromatogram of a tryptic digest of
S-carboxymethylated rabbit bone marrow thioredoxin 314
Figure VIII.2: Amino acid sequence of rabbit bone marrow thioredoxin 336
Table of Tables page Section II Table II.I: Table II.2: Section III
Tryptic / S aureous protease peptides from
internal invertase ...••Q • • • • • • • • • • • • • ~.O• • • • • • • • • • • •
auantitation of glycosylation sites in
ex ternal inver tase 'I " .
54
61
Table III.I: Interconversion between Roepstorff-Fohlman
nomenclature and that used in this thesis •....•.•..• 77
Table 111.2: Exact mass measurements of vD ions found In FAD
mass spectra •••••••••••••••••••••••••• 0 • • • • • • • • • • • • • 98
Table 111.3: Partial listing of peptides used in the study of
wD lons It.. • • • ..• • ..• • • • • • • 99
Table 111.4: List of observed and calculated masses of VB
ions found in Fig. III.12 ••..•...•.~ •.... 106
Table III.5: Presence or absence of dD ions in CID spectra of aD
and ant} ions found in FAB mass spectra of peptides 127 Table l1I.6: Partial listing of peptides used in the study of
dD ions ...•...~ 129 Table 111.7: Partial listing of peptides used 1n the study of
VD 10DS •••••••••••••••••••••• ~ 0 • 141
Table 111.8: Exact mass measuremants of vD ions fou~d in FAB mass spectrum of D-Ala6-1uteinizing hormone
releasing hormone ~. 143
Table 111.9: Summary of CID spectra of precursor ions that give rise to the v6 ion of D-Ala6-1uteiniz1ng hormon~
releasing hormone ...••• ~ Q • • • • • • • • • • • • • 148 Table 111.10: Neutral losses and low mass ions observed for each
am1r10 acid ••0 • • • • • • • • • .. • • • • ~• • • • • 0 • • Q • • • • • • • • • • • • ..• • 153
Table 111.11: Method of calculating masses of peptide fragment ions 154
Table 111.12: Summary of observations pertaining to the
Section IV Table IV.I: Table IV.2: Table IV.3: Table IV.4: Table IV.5: Section V Table V. I: Table V.2: Table V.3: 13 page
Hypothetical ern mass spectrum used to illustrate ... 172
Results obtained on twenty peptides using SEQPEP 201
Results obtained on twenty peptides using ALTSEQ 203 Product ions used as data input to obtain the results
shown in Tables IV.2 and IV.3 8 • • • ~.O• • • • • • • • • • 208
Low mass ions that strongly indicate the presence of
particular amino acids ~...•... e • • • • • • • • • • • • • • • 225
Summary of FABHS/Edman data for ChlorobiulD
thioredoxin Co • • • • • • • • • • • • • • • • • • • • • • • • • • • • • • • 232
Summary of
ero
mass spectral data obtained fromtryptic peptldes of ChlorobiulD thioredoxin 242
Comparison of amino acid compositions obtained from
amino acid analysis and from the sequence ...•..•••.• 250 Section VI
Table VI.I: <H+8)+ 10ns of tryptic peptides from Chromatium
th1oredoxin •••....•••.••• ~ •..••...••...•••...• 257 Table VI.2:
eIn
mass spectral data for the tryptic peptide of<H+8)+
=
m/z 331.2 from Chromatium thioredoxin ... 258 Table VI.3: CID mass spectral data for the tryptic peptide of("+8)+
=
m/z 790.3 from Chromatium th1oredoxin ••••• 259 Table VI.4: CIO mass spectral data for the tryptic peptide of<"+8)+ == m/z 560.3 from Chromatium thioredoxin •.••. 260
Table VI.S: CID mass spectral data for the tryptic peptide of
(H+8)+ = m/z 435.3 from Chroma/ium thioredoxin ....:t 261
Table VI.6: CID mass spectral data f~r the tryptic peptide of
page
Section VII
Table VII. 1: (H+8)+ ions of tryptIe pept ides from R. rubrum
thior~doxin .... 0 • • • • • • tl • • • • • • • • • • • • •" • • • • • • • • • • .. • • • • 288
Table VII.2: Summary of eIO mass spectral data of tryptic peptides from S-carbamidomethylated R. rubrulD thioredoxin 289
Table VII.3: Summary of CID mass spectral data of ~ aureous
protease / tryptic peptides from R. rubrum
thioredoxln 295
Table VII.4: Summary of CID mass spectral data obtained from the
S aureous protease peptide of (Ht)+ = m/z 1141.4 300
Table VII.S: <H+8)+ ions resulting from chymotrypt1c cleavage of
the S aureous protease peptide of <H+H)+ = 6070 3D? Table VII.6: Summary of CIO mass spectral data obtained from
S dureous protease / chymotryptic peptides 303
Table VII.7: Comparison of amino acid composition determined by amino acid analysis and from the sequence of
R. rubrum thioredoxin t" • • • • • • • • • • • • • • • • • • • • 309 Section VIII
Table VIII.!: FABHS/Edman data for rabbit bone marrow thioredoxin 313
Table VIII.2: <H+8)+ ions of tryptic peptides .•... & • • • • • • • • 315
Table VIII.3:
ern
mass spectral data for tryptic peptldes 316Table VIII.4: <H+8)+ ions of tryptic/S aureous protease
pept1des D• • • • • • • ~ • • • • • • • • • • 32 1
Table VIII.5: CID mass spectral data for tryptic/~ aureous
protease peptides ...•...•. 323 Table VIII.6: <M+8)+ 10ns of ~~ aureous protease peptides .•... 326 Table VIII.7: CID mass spectral data for S aureous protease
peptides "'. .. .. 327
Table VIII.8: <H+8)+ ions of chymotryptic and
tryptic/thermolytic peptides .•... tl • • •G • • • • O • • • • • • • • 331
Table VIII.9:
cre
mass spectral data for chymotryptic peptides 332 Table VIII.lO: Amino acid analysis of a C-terminal chymotrypticTable VIIIQ ~ '1,~ CID ma~:.~ spectral data of tryptic/thermolytic
~ep tid(~ r; It • • • • • • • • • • • • • • • • • It • e • • • • • • • • • w • • • • • 15
Table of Schemes
page
Scheme III.l~ Roepstorff and Pohlman nomenclature for peptide
fragmentations ...•...•...e II• • • • • • • • 71 Scheme III.2: Structures and nomenclature for protonated peptide
fragment ions used throughout this thesis •..•... 74
Scheme 111.3: Structures of fragment ions derived from peptide
derivatives containing stable positive charges 89
Scheme III.4: Proposed mechanism for the ~ormation of
aQ+1 and ZD+1 92
Scheme III.S: Possible pathway's for the formation of Vo ions... 102
Scheme III.6: Possible pathways for the formation of
dD and aD ions ...,.. IS • • • • II • • • • • • • • • • • • 118
Scheme 111.7: Proposed mechanism for the formation of aD+l~R fans. 125
Scheme III.a: Proposed mechanisms for the formation of va ions .... 149 Scheme IV. 1 :
Scheme IV.2:
Flow diagram for SEOPEP
Subsequences for position m determined from the hypothetical CID mass spectral data of Table IV.I
169
173
Scheme IV.3:
Scheme IV.4:
Subsequences encompassing positions m and m-l
determined from the hypothetical CID mass spectral
da ta of Table IV. 1 e • • • • • • • • • • • • • • • • • • • • • • • • • • • • • • • " . 174 Subsequences encompassing positions m through m-2
and m through m-3 determined from the hypothetlLal
17
List of abbreviations Nld acronyms
FABHS/Edman B.; B2 B/E B2/E CID Cys'; C' : DTT/DTE El ; 82 81 Endo H FAB FABHS FD FT-ICR FTHS Glc GlcNAc
<GIu
HPLC
HPTHSMan
(M+8)+HIKES
"5-1 "5-2 MS/MSMagnetic sector of HS-1; Magnetic sector of H5-2
Product ion scan
Precursor ion scan
Collision induced dissociation
Carboxymethylated cysteine
Dlthiothreitol/dlthioerythrltol
Electric sector of HS-l; Electric sector of M8-2 Electron ionization
Endo-~-N-acetylglucosamlnldaseH FAst atom bombardment
Fast atom bombardment mass spectrometry
FABHS in conjunction ~1th subtractive Edman degradation Field desorption
Fourier transform 10n cyclotron resonance Fourier transform mass spectrometry
Glucose
N-acetylglucos?,'~.lne
Pyroglutamic acid
High performance liquid chromatography High performance tandem mass spectrometry Hannose
Protonated molecule
Mass-analyzed Ion Kinetic Energy Spectrometry
First of two double focusing mass spectrometers in tandem Second of tvo double focusing mass spectrometers in tandem Tandem mass spectrometry
m/z prB QET QaQ SIMS TFA TMP+ TPCK u Xle; X
Mass to charge ratio
Phenylthlohydantoin
auasiequilibrium Theory
Triple quadrupole mass spectrometer
Secondary ion mass spectrometry
Trifluoroacetlc acid
2,4,6-trimethylpyridinium group
N-tosyl-L-phenylalanine chloromethyl ketone
Atomic mass unit
19
Section I Introduction
I.I Mass Spectrometry of Peptides and Proteins
Since the introduction of fast atom bombardment (PAS) 1n 1981 (1) as a means of 1,onizing large polar molecules, mass spectrometry has become
an increasingly important method for the analysis of pept1des. P~lor to the emergence of FAB mass spectrometry, tedious sample and time consuming
derivGtl~ations were required for the introduction of these very polar nonvolatile molecules into the mass spectrometer via a gas chromatograph
or a direct insertion prcbe (2-3)& The most abundant ions found 1n FAB
mass spectra of peptides are due to the protonated molecules <H+8)+ in the case of positive ion FABMS or the deprotonated molecules (M-8)- for
negative 10n FABHS, thus allowing for the molecular weight determination
of the peptidese Since the sensitivity for positive ion FABHS of
peptides Is better than that for negative ion FABHS, the former te~hnique is used throughout the work described here.
This ability to determine peptide molecular weights has &s one of
its
major applications, the
verificationand
correction of proteinprimary structures as determined either by Bdman degradation (4) or from
DNA seqyences (5-7). The basic idea is to compare observed molecular weights of peptides derived from specific cleavages of the gene product,
with the values predicted from the DNA sequences. A similar application of PABMS is in the confirmation of the structure of proteins produced
from recombinant DNA technology, ~here it is important to quickly
determine if a gene product is the sam~ as the wild type protein (7-9)~
This, naturally, is of significance for the biotechnology 1.ndustry where, at least for patent purposes, it 1s important to know what has been
produced. This methodology can also be employed for the detection of post translational modifications, where the observed molecular weight of a modified peptide differs from the predicted molecular weight by the mass of the modification (10-14). An example, utilizing this technique for the determination of the location of N-glycosylation sites in an
extracellular Jeast invertase 1s presented In Section II of this thesis.
Although the molecular weight of a peptide can be readily determined
from the mass of the ("+8)+ ion, the high stability of this Ion precludes the formation of significantly abundant sequence specific fragment ions.
Despite this, there have been a number of reports correlating FABMS peptide fragments with the known peptide sequence <3,15-17); there are
far fewer instances where a FABMS spectrum has been used to deduce the sequence of an unknown peptide (3,16,18-19). The difficulty with this approach is that relatively large amounts of pure (single component)
pept1des are required to obtain a spectrum that exhibits sufficiently
abundant fragment Ions.
A technique that overcomes these limitations, tandem mass spectrometry (or HS/MS> , involves the selection of a precursor ion,
followed by excitation through collision or other energetic processes, and mass analysis of the resulting fragment ions. In the summer of 1985
21
a JEOL HIll0llI0 mass spectrometer consisting of two Nier-Johnson double focussing instruments in tandem was installed at HIT, thus allowing for what we have termed high performance tandem mass spectrometry (HPTHS). Use of the term HPTMS is meant to imply a type of HS/MS where both the selection of the precursor ion and the mass analysis of the daughter ions can be carried out at unit mass resolution on fairly large molecules (up to mass 3000). It Is not meant to imply that further improvements are unlikely or that other types of mass spectrometers, such as Fourier transform ion cyclotron resonance or quadrupole instruments, are "low performance", although ~~ of yet only four-sector instruments (two electric and two magnetic sectors) such as the 8X110/110 have met these
conditions. Tandem mass spectrometry, part~cularlyHPTHS, has several advantages over normal FABHS in that fragmentation 1s enhanced, and the resulting spectra are simplified, being devoid of the matrix related ions,
lJe
isotope peaks, and other ions not resulting from fragmentation of the selected precursor ion. Thus, "SIMS is applicable to the analysis of mixtures where one precursor ion after the other can be mass selected and collls1onally activated.For the sequencing of peptides and proteins, tandem mass
spectrometry has some distinct advantages over conventional methods.
Although DNA sequencing is nova routine procedure (20-21), it cannot provide any information concerning post translational modifications. The
same largely holds true for Edman sequencing, where a modified amino acid
will appear as a blank in an Bdman cycle, or the PTH-amino acid will have
completely on N-termlnally blocked peptides. Edman degradation also requires complete separation of peptldes, which Is time consuming and may
lead to a poor recovery of purified peptides. Although its best not to have very complex mixtures of peptides for "SIMS, there is no need to carry out extensive purification efforts. This 1s not to suggest that
the conventional methods should be abandoned, rather that tandem mass spectrometric sequencing 1s a complementary technique.
What follows are short discussions of various topics - FAD,
collisional activation, and 11nk£~ scans for double focusing mass spectrometers - that are relevant to the contents of this thesis, an
overview of the instrumentation and methods employed, and applications of these methods. In Section II the first such application deals with the confirmation of the amino acid sequences of both intracellular and extracellular invertases, as predicted from the published DNA sequence,
and the location of the attachment of carbohydrate chains to asparagines in the extracellular form of this enzyme. Studies on the fragmentation
of collisionally activated protonated peptides were made possible with
the installation of the JBOL
BXIIO/IIO
tandem mass spectrometer (SectionIII). In particular, three previously unreported ion types were
characterized, two of which allow for the differentiation of the isomeric amino acids leucine and isoleucine. Chemically stable positive charges, or highly basic moieties, were found to have a significant effect on the types of fragment ions observed in colilsionally activated derivatized peptides. Baving defined the types of fragment ions observed, Section IV describes tvo computer programs that aid in the interpretation of CID
23
spectra of unknown pept1des in terms of their amino acid sequence. The remaining sections provide examples of tandem mass spectrometric
sequencing of three bacterial and one mammalian thioredoxlns (small proteins of MY 12,000).
1.2 Past Atom Bombardment Ionization
The ionization technique usually referred to as fast atom
bombardment <I> has provided a fairly simple method for the ionization of large polar molecules. Samples are dlssol"~d in a liquid matrix, applied to a sample probe tip, and bombarded by neutral atoms of several keY translational energy. It is generally agreed, however, that there is no difference between mass spectra derived from bombardment ~ith ions or neutral atoms (22). Rather, the ~ost Sl~llficant aspect of FAD is the use of a liquid matrix, thus leadl~! to the use of alternative terms such as "liquid secondary ion mass spectrometry" (23). Since most practloners still U3e the term FAB, as originally coined, "FAB" will be used
throughout the work described here.
The general Batrix require. .nts for
FAB
are that the sample must besoluble in the matrix, the matrix must not react with the sample (at
least not in an
unpredictable
_anner), Ions from the matrixshould
be asunobtrusive as possible, the viscosity should be low enough to allow for
sample diffusion to the surface, and the matrix should be sufficiently
nonvolatile so as to provide a stable bo.bardment surface for the
requirementsp the optimum matrix choice is largely a matter of trial and
error. The most commonly used matrix used for peptides has been
glycerol, perhaps with addition of an acid, e.g~, acetic acid. Addition of thiols, such as th1og1ycerol or a eutectic mixture of dithiothreitol and dithioerythritol (OTT/DTE; 5:1) seems to increase the sensitivity for most peptides. Thioglycerol alone appears to be the best matrix for
larger molecules <)4000 u), but due to its greater volatility it 1s best
used with a coolable sample probe (26).
Although cations are no doubt simply desorbed by FAS, the mechanism for the formation of <M+8)+ ions is not yet clear. The most widely held
theory is that molecules are protonated within the liqUid bulk and then desorbed. Observations leading to this conclusion are that addition of
acids to the matrix enhances the abundance of the <H+8)+ ion (27-29>, and
that the bulk concentration of the protonated molecule in a number of
cases correlates with the abundance of the (M+8)+ ion observed in the
mass spectrometer (30-31). These observations are only correlations,
that do not refute an alternative mechanism where (H+8)+ ions are
proposed to occur In the gas phase or in a hot high pressure gas phase
region near the matrix surface. The formation of (M+8)+ in the gas phase
of the
10nsource 1s suggested
bythe similarities between FAB and
chemical ionization (el) mass ~pectra, calculations indicating similar
source pressure requirements (32), and , most significantlys experiments demonstrating that gas phase basicity is of more importance 1n ion
production than is solution basicity (33). There may veIl be more than one mechanism involved in the formation of (H+8)+ ions. Due to this
25
confusion, there is presently insufficient knowledge about the ionization
process to choose the optimum matrix on theoretical groundsg
There seems to be little doubt that surface activity has a
significant effect on the ability to ionize peptides by FAB. This was first suggested when it was noticed that the FAB mass spectrum of a tryptic digest of glucagon lacked a signal for the peptide encompassing the first twelve amino acids (34). This idea vas fu~the~ developed when correlations were made between the hydrophobicity scale of Bull and Breese (35) and the response of a peptide mixtu~e to FAB analysis (36). These results, in addition to observations made at HIT (37), support the conclusion that in peptide mixtures hydrophobic peptides, which
presumably tend to be expelled onto the matrix surface, give greater secondary 10n yields than hydrophilic peptldes dissolved within the matrix. It has been proposed (36) that this effect can be reduced in at
least tvo ways. First, the peptldes can be derivatlzed in a manner that
increases overall hydrophobicity; in particular, the carboxylate groups
can be converted to alkyl esters. Alternatively, peptide mixtures can be fractionated by reversed phase high performance liquid chromatography
CHPLe>,
thus creating fractions containing peptldes of similarhydrophobicity. Of course, reversed phase BPLC separates peptides based on both hydrophobicity and size, so such fractionation may not eliminate this problem completely. For instance, a late eluting fraction may
I.3 Collision Induced Dissociation
Although there are other means of 10n excitation, e.g., collision
with a surface (38), interaction with a laser beam (39), or with an
electron beam (40), the most frequently used method is collisional
activation (41-43). It is also the oldest method, since it was before 1913 that J. Jo Thomson observed the collision induced dissociation of H!- Ions (44). Not until much later In the late 1960's (45-46) did collisional activation become of interest to organic mass
spectrometrists, and not until very recently were peptide ions
coillsionally activated (47-49).
Ions with translational energies of several keY impinging on a
target atom have interaction tices on a time scale of about one
vibrational period, c~ 10-14 s. This leads to the conclusion that
ern
is a two step process - ion excitation, followed by dissociation. The dissociation step, being a unimolecular decomposition, therefore can be
described along the lines of the Qu&siequilibrium Theory <OET) (50),
which has as its basic assumption that the excess energy 1s redistributed
over all degrees of freedom prior to the slover dissociation reaction.
It is
generally
considered that collisional activation involves aninitial electron excitation, at least for smaller ions, tut it has also been suggested that much larger ions, e.g., peptide ("+8)+ ions, are
vibrationallyand rotationally excited (51-52>. Regardless of the
excitation mechanism, according to the QRT, the excited ion will undergo energy randomization, and eventual localization of the excess internal
27
energy into a bond leads to cleavage. In addition to ClD, interaction of
an incident ion with a neutral target will give rise to other processes. The ion can be deflected at an angle greater than the acceptance angle of
the mass spectrometer, and thus not be observed. Since the amount of scattering is proportional to (ao/v)2 where at Is the ion-target
interaction distance and v is the Ion velocity, scattering can be reduced
by increasing the ion velocity or decreasing the target gas size.
Another important process Is charge exchange, where the target gas (g) is ionized at the expense of the precursor ion (m+):
g + m+ ---) g+ + m
This reaction 1s inversely proportional to the ionization energy of the target gas, and will be discussed in more detail later. Other less important reactions are charge stripping:
m+ ---) mZ+ +
e-and charge inversion:
m+ + g ---) m- + g~
All of these alternative processes are in competition with ClD, thus reducing the efficiency of fragmentation.
Its generally known that fragmentation efficiency decreases with
increasing mass of the incident 10n.
The
reason for this can be dueeither to reduced ion excitation or to difficulties in the dissociation of larger Ions (CID Is a two step process). From theoretical
considerations, it has been proposed that very large molecules will primarily suffer the loss of small groups rather than undergo the more useful sequence specific fragmentations <53). Further support indicating
that dissociation dynamics are the primaI}· influence on CID efficiency comes from Derrick, et ale (51) who report large translational energy
losses <about 20 eV) for colllsionally activated peptide ions.
Translational energy loss (~B) is the difference in kinetic energy of the incident lon, m+, and the coillsionally activatEd ion, m+·. From
conservation of energy, ~E = 0 + E., where 0 1s the gain in ion internal energy and E. 1s the energy gained by the target gas. By making the common assumption that E. is negligible, it would seem as though a great deal of internal energy is available for fragmentation. The fact that larger ions do not fragment as easily would therefore indicate that the reduced CID efficiency is due to the dissociation process~ This
conclusion has been disputed by Russell, et ale <54) who show from a number of experiments that E. 1s not negligible, but accounts for 75 -90% of ~E. Apparently, a good deal of charge exchange occurs with keV ions. As an explanation, Russell suggests that the interaction time between the incident ion and the target atom is too short to allow the ion to necessarily maintain its charge. Given a long lived ~col11sion
complex", (m---g)+, the charge would predominantly be associated with m, since it would have the lover ionization potential; however, this may not be the case for a short lived complex. Thus, the suprl~ing
conclusion 1s that
low
translational energy Ions can rec1eve moreinternal energy as a result of decreased charge exchange during
collisional activation. In addition to the correlation between incident ion translational energy and charge exchange, Russell points to other work on simpler systems suggesting that charge exchange increases with
photodlssociat1on data and CID spectra he concludes that the average internal energy gained upon collisional activation is more on the order of 2.5 eVe
As discussed above, the major pathwAYs in competition with CIO are charge exchange and scattering& Reduction of the ion target size and increasing th~ 10n velocity reduces the latter process, thus He is most commonly used as the collision gas. Increasing the ion velocity requires higher accelerating voltages, magnets with large radial curvature, ~~d
high magnetic field strengths; the JEOL BXI10/110 has a maxl~ilm
accelerating voltage of 10 kV for ions up to 14,500 u. Theoretically, the accelerating voltage for this instrument could be increased at the expense of the mass range, since most peptides studied are of molecular
weight much b~low 14,000. This possibility has not been examined.
Charge exchange can be reduced by selecting a collision gas with high ionization potential, so He (IP a 24.6 eV) again 1s the best choice. If 1n fact charge exchange decreases with ion velocity, then it may be desirable to use slover precursor ions. This, however, would presumably lead to an increase in ion scatter, and there would be a trade off. Thls effect is not been examined here.
1.4 Linked Scans for Double Focusing Mass Spectrometers
FolloYing collision induced dissociation, the r2sulting product ions are mass analyzed. This can most siBply be accomplished by scanning the electric field follOWing the collision region. If the precursor Ion is
mass selected prior to collision then such scans are known as
mass-analyzed i~n kinetic energy spectrometry
(HIKES).
If
the fullyaccelerated precursor 10n m.+, dissociates to the product ion mz+, the
field strength, EI , required to pass 1D1+ 1s £1 III (m1/ml)K., where XI
is the field strensth required to pass ml+. Such scans have often been used with reversed Nler-Johnson instruments, where the magnet (B) selects with relatively low resolution the precursor ion, which undergoes
collisional activation in the collision cell (ee) positioned betveen the magnet and the electric sector (E). This scan is also used with three sector instruments of EB[cc]E geometry, which can select the precursor ion with higher resolution than a D~et alone. The problem with E-scans are two fold. First, the resolution Is loy <about 100>; second, the translational energy loss (~B) discussed previously may lead to incorrect <low) mass assignments.
A better method for the mass analysis of eIO fragment ions involves the simultaneous scanning of the magnetic and electric fields in such a manner that the ratio of their field strengths Is constant - the BIE
linked scan (for a review of i-scans and linked scans see chapter 9 of ref. 43). Since the velocities of both product and precursor Ions are the same, the ra t los m1/m1 and B1/Bz are equal. Fur thermore, s 1nce ml/mz
equals El/Bz (from the E-scan) then 81/E. and 82/82 have the same
constant value. The value of this constant 1s dependent on the mass of the chosen precursor 10n. The product ion resolution obtained in such scans can be quite high, 1000 or better, and the mass assignments are not
31
are carried out using only tvo sectors (8 ~nd B>, the precurscr ion
resolution is love This problem is eliminated if the p~ecucsoc ion 1s mass selected prior to collisional activation. Thus, with four sector instruments, the precursor ion Is selected with the first double
focussing mass Jpectrometer (M8-1, consisting of I. and 8.),
colllsionally activated after K5-1, and a BIB linked scan is carried out
with the second mass spectrometer ("5-2, consisting of 11 and 81) .
A second type of linked scan was also used in this work. The BllE
scan ·ransmits all ions that have been fully accelerated and which
decompose to a selected product Ion. This scan 1s complementary to the
BIB
scan in that it gives a spectrum of all parent ions that dissociateto the chosen product ion. If the product ion mz+ is formed from dissociation of ml+, and 1s trans.ltted at a magnetic field strength B. with a magnetic radius R and electric field E. of electric sector radius
r, then:
where e is the charge on the ion, and VI Is the veIoclty of el ther m'l+ or
Therefore the ratio 82/B is deter.lned by the mass of the chosen product
ion -2+. S1'~h scans have characterlst1~ally low resolution (c. <100> and employ only two sectors, B and I, for its operation.
These tvo linked scans - BIB ~ld 82/1 - can best be visualised by
conslder1ns the
a-I
plane sho~) in '1,.1.1.
In this example, an iOD.-.+.
of . .as 1000 dissociates to a product ion, .J+' of . .ss 500. The line I. indicates a nor. .l ...s spectrua where the ..,net B Is scanned at a constant electric field voltageB..
The diagonal line shows the values ofB
andB
th~t are scanned for a BIB scan where./z
1000Is
selected asthe precursor ion. Point X indicates the values of B and 8 for which the
CID
fr.,.ent ion ma+ • 500 Is trans.itted. The parabolic curve indicates the B2/1 scan of the daughter ion -2+. An ion signal detected when the B and B fields correspond to position I, indicates that the precursor Ion must be./z
1000.1.5 Alternative Instru.entation for HS/MS of Peptides
Despite the success of four sector mass spectromet~rs, as described herein. for the sequen~lng of peptides and proteins of unknown structure,
the cust of such instruments provides an incentive for the development of
less expensive mass spectromters that have the potential for HPTHS, as defined earlier. Discussion of such instrumentation 1s varr8fited here, since in principle the origin of the data Is not 1mportant as long as the quality of the data allows for the unambiguous structure determination of
0.5
Pigure 1.1:
B-1 plane
d1asraa 111uatratina tbe 11~~ ==sns BJ/B<parabolic curve) and BII (linear curve) :or the
hypotheticalcase of a precursor Ion
~+ (a/z1000) disloclatins to a product
ion ~+ (./z 500>.
success has been obtained using a triple quadrupole <000> m4sm
spectrometer (55), where the first quadrupole selects the precur50r ion,
the middle quadrupole serves as the collision regionp and the last
quadrupole mass filters the resulting product 10ns. In this study,
however, precursor ions were selected 80 as to pass a mass window 3 - 9 u
vide through the first quadrupole, and the largest precursor ion vas of mass 1486 u. Bence, despite the potential of triple quadrupole mass
spectrometers it remains to be seen whether they can attain the performance of four-sector instruments.
Fourier transform ion cyclotron resonance (FT-ICR), aore commonly
known as Fourier transform mass spectrometry (FTMS) , has also been used
for MS/MS studies of peptldes. Such instruments employ a cell located in
a fixed magnetic field. Pulsed excitation causes the ions to move In the cell in a ~ircular path perpendicular to the magnetic fleld~ This
motion, the frequency of which Is depend~~nt on the ion mass, induces an
oscillating voltage on a pair of detector plates. This signal is
recorded and Fourier transformed to give a mass spectrum. For "SiMS experiments, all ions except the precursor ions are pulsed out of the ion
cell, the remaining ions are collisionally activated, and the product
ions detected.
Amajor problem
withthis technique is that the low
pressures required for operation are incompatible with the prescence of the liquid matrix required for PAB ionization. Therefore, if Fp~ is to be used, the ions must be generated outside of the FTMS instrument and
injected into the low pressure Ion cell. This has been achieved using
35
superconductlng magnet throUlh the masnetlc field into the cell. There the precursor ions are mass selecte~ anJ, in this case, undergo laser ph~tudissoc1atlon(56-57). This arrange.ent 1s still 1n an experimental
staa-, and its capabilities have yet to be explored.
Alternatively, ions can be formed without. liquid aatrix and thus can be ,enerated within or near the ion cell. Laser desorption and secondary ion . .ss spectomtry (SIMS) without a liquid aatrix have bean used. The efficiency of such ionization is mueh less than for FAB uslns a liquid matrix, but since FTMS can store ~nns for several second. it is hoped that sufficient sensitivity can be obtained.
Por
ex. .ple,precursor ions generated by laser desorption and SIMS on solid samples of gramicidns D and S were BaSS selected (2 u mass window), collisionally
activated, and the product ions detected (58,59). The resulting spectra were, however, of such poor quality that they would probably not be
interpretable had they been derived from a compound of unknovn structure~ Despite these shortcomings, FTMS and 000 may in the future provide
spectra of equal quality to those obtained with four sector instruments,
and may eventually come under the catagory of
high performance tandemmass spectrometry.
1.6 Preparation of Peptides for Mass Spectral Analysis
The need for clean, salt-free samples cannot be overemphasized. The
presence of the ubiquitous sodium and postasslum cations, in particular,
(M-8+2I)+, etc., which complicates the spectrum. Furthermore, it
distributes the molecular Ion signal over several species, the
sensitivity decreases and for low saaple concentrations the molecular 1011
signals may not exceed the background chemical noise (15). Vith this in mind, vacuum distilled, or otherwise h11h1y purified, matrices were used. Sample purification generally involved reversed phase BPLC using Vaters Associates H6000A pumps and a 660 solvent programmer, a Rheodyne 7120 injector, and a B.~~an 160 UV absorption detector monitoring at 215 nm. Vaters wBondapack C-18 columns were generally used at a flow rate of 1.5 ml/min with a linear solvent gradient of B10/trifluoroacetlc acid (TFA) (1:0.0005) to CH)CN/B~O/TFA (1:1:0.00042) over 30 min. Distilled vater
further purified with a ftHl11i-Q~" system, Baker BPLC grade
acetonitrile, and Pierce Spectrograde TFA were used as HPLC solvents. Glassware vas cleaned using the phoshpate-free detergent, "RBS-pf",
obtained from Pierce Chemical Company, and rinsed repeatedly in "H1111-Q"
purified vater.
1.7 Instrumentation and Data Acquisition
The majority of the work discussed in this thesis involved work carried out on the JBOL 8X110/110 mass spectrometer consisting of tvo
N1er-Johnson double focusing instruments ("5-1 and M5-2) in tandem (Fig. 1.2>. A JBOL FAS gun operated at 6 KV using Xe as the FAS gas va~
recently replaced by an Antek ces1u~ ion gun (60). The cesium gun can be operated at a higher primary beam flux than the Xe gun, thus providing an increase in secondary ion emission. The ion optics of the JEOL BXIIO
37
Ea
tA/82
\ M . field ~~ --Detector1 Focul 18nl8l V:::lon Source (2) . field \ ,\"
\
ealliliancell(1 ) Ion1OUrc8(1) 02 . .(1) \ JI-.(U\1/
'~ l2'-litC1l
I
1/
'
01 . .(1)V
~8Ik
1spectroBeter employs vertical focusing by quadrupole lenses before and after the electric field, thus 1ncreQsing ion transmission as veIl as allowing for a smaller magnet ,ap, which provides an increase in field strength. The total vertical aagniflcat10n is about 3, and the taBge magnification <be. . width) 1. -0.5. Mas8 dispersion Is increased and image aberration decreased by non-perpendicular aagnetlc fl~ld incident and exit angles. Both "5-1 and "5-2 have mass ranges extending to 14,500 u at 10 kV accelerating volt.,e.. Off axis detectors <16 stage electron multipliers preceeded by 20 kV post-accelerating electrod2s) are located after the collector slits of M5-1 and MS-2, with an additional detector. located after the electric sector of "5-2, thus allowing for acquisition
of
MIKES
spectra. The distance betveen thecollector
slit of "8-1 andthe entrance slit of "8-2 is 35
C_,
and contains one of the off-axis detectors, as veIl as a lens system to focus the ion beam into the collslon cell. Also contained within this region is an ion source for M5-2, which has a built in box type collision cell. This ion source collision cell Is routinely used for the acquisition of CID spectra using all four sectors, but can be replaced by a stand-alone collision ~ellthat can be electrically floated up to 9.9 kV above ground. All of the HS/MS data described here vas obtained using the collision cell (kept at
ground potential) of ion source 2.
Calibration of "8-2 for BIB linked scans has been reported for this (61) and another four sector instrument (62). Without getting into the details of the alternate calibration method, it will suffice to say that calibration of the JEOL instrument Is considerably simpler, easier to
39
use, and provides -.as ass1gnaents of accuracy
10.3
u.
In this method, a
alxture of halide salts - CsI, RbI, KI, NaI, and LiC} - are ionl~ed in ion source 2. A nor. .l B-scan of "S-2 and subsequent asslgnaent of the masses observed provides a Ican tiBe vs. ..as calibration table. Vhen the reference voltage for the electric ••ctor 1. scanned 11nearly~ tho actual electric field also chanles linearly. This, however, 1s not the case for a aasnet1c sector where the field does not re.~nd linearly, as shown in Pig. 1.3. The calibration table is used to determine the reference voltage offset that
vould
allow for a linear B scan.Alternatively, the electric sector reference voltage can be offset by following the nonlinearity of the aarnet. In either case, the ratio BIE .ust be kept constant throughout the scan, otherwise ion transmission
through "S-2 drups and . .ss asslgnaent errors increase. In actual operation, a precursor ion . .ss is specified, and the JBOL DA5000 software calculates frOB the tiDe/aass table the proper B and B field
reference voltage scans.
The mass range
ofthe scan usually starts
around 50 u and extends to several tens of mass units above the specified
precursor ion.
PABMS using the JBOL inst~nt vas carried out using H8-1 at an
acceleratlol voltase of 10 kV.
S101le scans were typically acquired at a
rate to scan fro. m/z 200 to 3000 in about 2.5 .in with 100 Hz filtering. Saaples were dissolved in glycerol at a concentration of 0.5-2.0 nmol/~l,
and 0.5-1.0 ul of the solution vas applied to a stainless steel probe tip. One half microliter of 30% aqueous acetic acid alone or in
s·
Magnetic Field Reference Voltage (V)
'igure 1.3: The stra1aht line 1s the ideal case of a magnet responding linearly to a r.feren~e volt.,_, wherea. the curved
~lne indicates the actual ..,netic field (ex&IIerated) when the
41
the saaple on the probe tip. cesium iodide cluster ions (CsI)cCs+ -were used to calibrate MS-l.
PABMS/MS vas carried out using all four sectors of the BI110/110, with collision induced dissociation in the third field free region (between "5-1 and "5-2>. Bellu. vas used as the collision gas at a pressure sufficient to reduce the precursor ion signal by 50-70%. The spectra were recorded at 30 Hz filtering using the same scan rat~ as used for PAlMS. Scan rates tylce as fast were later found to prOVide spectra of equal quality 1f the filtering vas reduced to 100 Hz. The resolution of "5-1 vas typically adjusted to trans.it only the I~ species of the <"+8)+ ion, and M8-2 vas operated at a resolution of 1:1000. For precursor ions of lov abundance and/or high mass <)2000 u), the
resolutions of both M5-1 and M5-2 were decreased so as to increase ion transaission.
Precursor 10n scans (82/1) were obtained using "5-1, which for this
purpose vas calibrated using the alkali halide salt mixture. The source,
alpha, beta, and collector slits were positioned so that a normal magnet scan would operate at a resolution of 1:30008 However, since this type of scan does not have double focusslna properties, the actual precursor
Section I I
Verification of the DNA sequence of the gene coding for invertase
In Saccharomyces cerep;Ji." and location of the si tes of
N-glycosylatlon in external invertase
11.1 Introduction
The role of glycoprotelns in such diverse processes as cell
recognition, -etastasls, antigenic specificity, and .odulation of protein
r~ceptors has been the subject of auch investigation. As a .odel for glycoprotein synthesis, yeast has been recognized as prOViding a sl.pllfied alternative to ...llan syste-s (63). The s1.ilarlties between yeast and higher eukaryotlc N~llnked glycoprotein synthesis encoapasses tbe initial transfer of GleNAc~Glc)fro. the
dollchol-pyrophosphate carrier to asparaglnes in the protein, and the subsequent re.oval of three glucose and one mannose residues. In particular, the enzr-e invertase, which catalyzes the cleavage of sucrose, bas been used for studies on glycoprotein synthesis (64--66). The work discussed here vas carried out for the purpose of locating anrl quantitating the sites of glycosylatlon within this enzyme.
Invertase, isolated frOB the yeast Saccbaromyces cererisiae has two forms - a glycosylated excreted for. (external invertase) containing ~O% carbohydrate by -ass, and a non-glycosylated intracellular form (internal invertase) (67). Both are derived fro. the SUC2 gene, but fro. different
43
suff1c1entp requirement for N-llnked protein glycosylatlon is that the
~educing end of the oligosaccharide be attached to an asparagine located
within the sequence -Asn-Xxx-Ser(or Thr)-, where Xxx can be any amino acid except proline. The amino acid sequence of invertase as deduced from published DNA data (70), reveals fourteen such potential
glycosylation sites (sequons) per subunit. However, it was found thcLt excreted invertase contained on the average only nine to ten N-linked
oligosaccharide chains per subunit (71). Thus, it remained to locate those sequons containing carbohydrates and the extent of their
glycosy'~tion, as well as verify the DNA sequence on which the primary structure of the protein was based.
This goal vas accomplished by using two complementary methods -FABMS analysis of reversed phase HPLC peptide fractions, and more
traditional techniques involving Edman degradations, amino acid analysis,
and glucosam1ne analysis following acid hydrolysis of sequon containing peptides. To simplify the characterization of external invertase, the majority of the N-linked carbohydrate chains were removed using
endo-p-N-acetylglucosaminidase H (Bodo H), which leaves only one N-acetylglucosam1ne attached to asparagine (72). The amino acid
analysis,
Edmansequencing, and
glucosaalneanalysis was
carried out inthe laboratory of
Dr.
Frank
Haley at theNew
York Department of Healthin Albany, NY, as vas the isolation and purification of internal
invertase and Indo B treated external invertase. The confirmation of DNA sequences using FABHS, which has been descr1be~ in detail elsewhere (5), involves proteolytic or chemical cleavage of the g~ne product and
compa~ison of the observed molecular weights of the resulting peptldes
with those predicted from the DNA sequence. Errors in the DNA sequence or post translational modifications can be recognized on the basis of this
datae The N-terminal amino acids of the proteolytic peptldes can also be determined by comparing peptide molecular weights before and after manual Edman cycles carried out on each BPLC fraction, thus providing furth~r
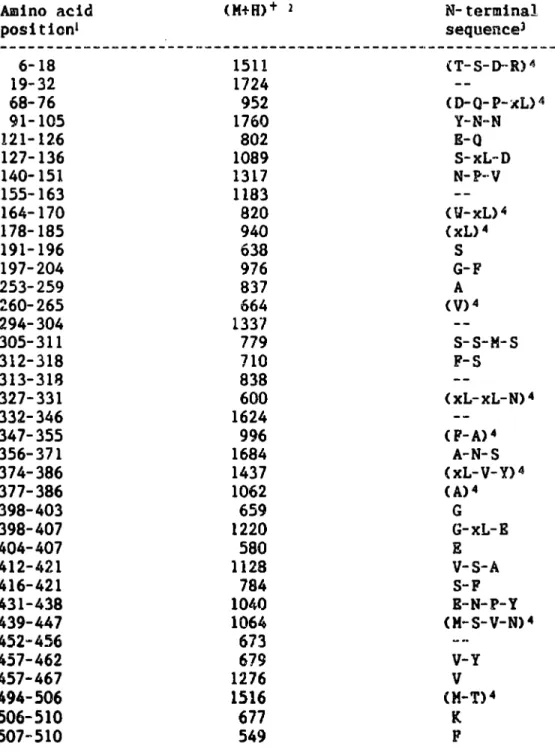
information. N-linked glycosylatlon sites were identified In Bndo B treated external invertase by the increase in mass corresponding to an attached N-acetylglucosamine (+203 u), or multiples thereof, in seq\lon containing peptlrl~s. FABMS analysis vas carried out on both
non-glycosylated intracellular invertase and Endo 8 treated external invertase. It was established that the published DNA sequence was essentially correct, vith the exception that proline was found in place of alanine at position 390 of the external invertase. This can be explained by a single base change (Gee --) eCC). Furthermore, thirteen of the fourteen sequons were found to be glycosylated to varying extent, and one sequon was not glycosylated.
11.2 Materials and Methods
Internal
invertase
andIndo
B treated external invertase were provided byDr.
Frank Maley at the New York Department of Health, Albany, NY. Internal invertase vas amplified in a!YRl
strain of yeastfrom a BindIII digest of the ~ gene and purified (71). External invertase was obtained fro. Boehringer-Hannhelm, purified by a
45
found to be homogeneous on SDS-gel electrophoresis. External invert85e vas deglycosylated by dissolving 27 mg of the purified enzyme in 11 ml water and denatured in a boiling water bath for 6 min. After cooling, 0.5 M sodium citrate buffer (pH 5.5) vas added to give a final
concentration of 0.05 M. indo B (110 .U) vas added and the reaction mixture vas incubated at 37
oc.
After 9 hours more indo B <gO .U) vas added. After a total of 16 h incubation, the precipitated deglycosylated protein was collected by centrifugation.Approximataly 20 nmo] ~f internal invertase vas suspended in 0.5 ml of 0.1 M NB4BCOJ and 0.1 aM caC12 and digested with
N-tosyl-L-phenylalanine chloro.ethyl ketone (TPCKJ treated trypsin (50:1
substrate/enzyme) at pH 805 and 37 OC for six hours. The digest was brought to d~ess on a Savant Speed-Vac vacuum centrifuge, and redissolved in 0.5 .1 of 50 aM sodl~ phosphate buffer (pH 7.8) and digested further with Staphylococcus aurcus (strain V8) protease (50:1 substrate/en~e) at 37 OC for eight hours. Twenty nmol of Indo B
treated external invertase vas digested similarly. Another 20 nmol of
Indo H treated external invertase vas digested with ~-chyaotrypsin <100:1 substrate/enzyme) at pH 8.5 and 37 OC in 0.5 .1 of 0.1 MNB~BCO) and 0.1
mH caC1J
for
30min.
Bach of these
d1sestswere
partiallyseparated
byreversed phase HPLC as described In section
I.
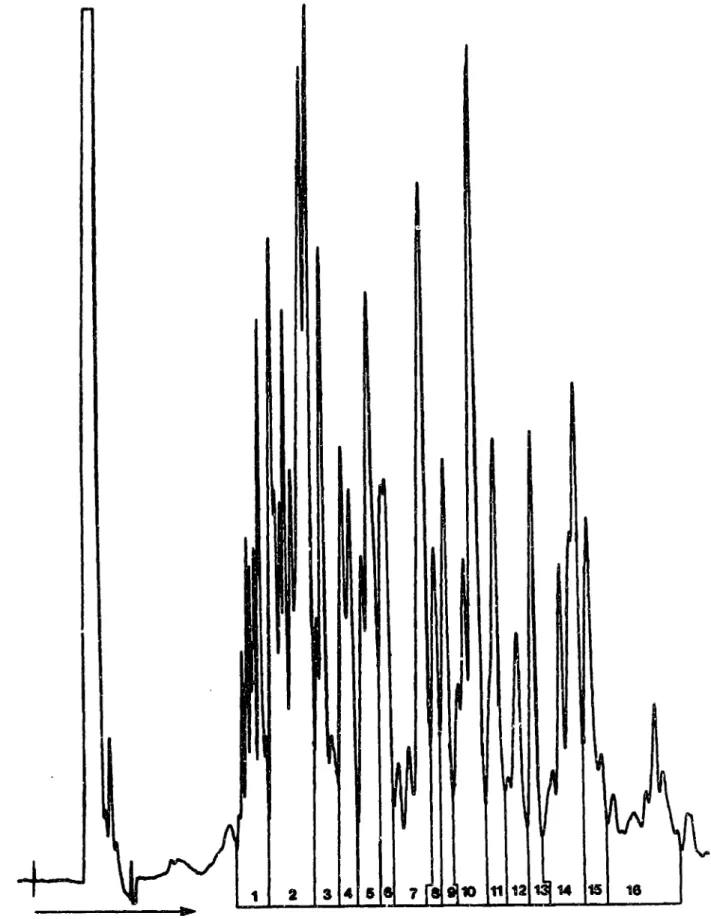
The BPLC traces,including the fraction cutoffs, are shown in Figs. II.l-!Ie3.
The molecular weights of the partially fractionated peptldes were
~
I
,
!
~
~~~
\
~
~I
V
~
ulA
u
1 2 3 4 5e
7 Ia
10-P1pre 11.1: BPLC chro. .tolr. . of .~. allreua (.train VB) proterbse digestion of
a tryptic di,est of internal invertase. The . .rklnas lndlcat~ collected fractions.
..
1 2 3 • IS I ., 8 I 104.7
Plpre 11.2: BPLC cJlroutogr. . of S. aurea, (strain VB) protease di.eation of • tryptic dlS. .t of Bodo 8 treated external inv.rt.... The -.rklDlS indicate collected fractlona.
..
.... II
~~I
~
I "
~
"
IM
l
T-
1 2 3 4 5 :8 7r
I S~1O 11 12 't~14 15 16 Figure 11.3: BPLC ebro. .toar" of an .-c.h,.otryptlc d1, ••t of Indo Btreated external invert.... The . .rklD1I ln~lcat. collected
,4~
spectrometer of Mattauch-Herzog geometry that had been fitted with an Ion
Tech saddle field ~AB gun (15,27). This instrument has a mass range extending up to 2000 u at 8 kV accelerating voltage. The neutral x~ beam produced by the PAD gun had a translational energy of 6-8 keY ~1th an equivalen: ion current of 30-4~ ~A. Spectra were recorded with an oscillograph on UV-sens1tive paper. Use of glycerol as the FAB matrix provides cluster ions of known mass every 92 u starting at mass 93 and
extending in some cases beyond 1000 u, with low abundance ions at every
mass between the clusters. Nominal mass assignments were made by
manually counting up from one of the glycerol cluster ions. The q~mples were typically dissolved in glycerol at a concentrat~on of 0.5-1.0
nmol/NI. One half to one ~1 of this solution vas mixed with 0.5 ~l of
30% aqueous acetic acid and placed on the probe tip. For peptldes of
molecular weights exceeding the mass range of the Varian-MAT 731 mass spectrometer (m/z 2000), FAB mass spectra were obtained as described in
section I using the JROL BXIIO/BXIIO mass spectrometer.
Up to four manual Bdman degradation cycles were carried out on each HPLC fraction with the molecular weights of the shortened peptides
determined by FABHS after each cycle, thdS identifying successive
N-tera1nal amino acids.
Reaction of the i-aa1no group of lysine with
phenyllsothlocyanate during the first Edman cycle results in the addition
of 135 u to the truncated peptide and allows the nuaber of lysines in a peptide to be determined. The manual Bdaan procedure was carried out using the method of Tarr (74) .adifled for use in conjunction with FASMS. Ten to twenty nmol of proteolytic peptides were reacted with 10 ~1 of