HAL Id: hal-02965048
https://hal.inrae.fr/hal-02965048
Preprint submitted on 12 Oct 2020
HAL is a multi-disciplinary open access archive for the deposit and dissemination of sci-entific research documents, whether they are pub-lished or not. The documents may come from teaching and research institutions in France or abroad, or from public or private research centers.
L’archive ouverte pluridisciplinaire HAL, est destinée au dépôt et à la diffusion de documents scientifiques de niveau recherche, publiés ou non, émanant des établissements d’enseignement et de recherche français ou étrangers, des laboratoires publics ou privés.
Distributed under a Creative Commons Attribution| 4.0 International License
methodology and application to the maize 50k array
Mariangela Arca
Mariangela Arca, Tristan Mary-Huard, Cyril Bauland, Brigitte Gouesnard,
Aurélie Berard, Valérie Combes, Delphine Madur, Alain Charcosset, Stephane
Nicolas
To cite this version:
Mariangela Arca, Tristan Mary-Huard, Cyril Bauland, Brigitte Gouesnard, Aurélie Berard, et al.. Deciphering the genetic diversity of landraces with high-throughput SNP genotyping of DNA bulks: methodology and application to the maize 50k array Mariangela Arca. 2020. �hal-02965048�
1
Deciphering the genetic diversity of landraces with
high-1
throughput SNP genotyping of DNA bulks: methodology and
2
application to the maize 50k array
3 4
Mariangela Arca1, Tristan Mary-Huard 1, Brigitte Gouesnard2, Aurélie Bérard3, Cyril 5
Bauland1, Valérie Combes1, Delphine Madur1, Alain Charcosset1, Stéphane D. Nicolas1
6
Author’s affiliations : 7
1 Université Paris-Saclay, INRAE, CNRS, AgroParisTech, GQE - Le Moulon, 91190, 8
Gif-sur-Yvette, France 9
2 Amélioration Génétique et Adaptation des Plantes méditéranéennes et tropicales, Univ 10
Montpellier, CIRAD, INRAE, Institut Agro, F-34090 Montpellier, France 11
3 Université Paris-Saclay, INRAE, Etude du Polymorphisme des Génomes Végétaux, 12
91000, Evry-Courcouronnes, France 13
Corresponding authors: stephane.nicolas@inrae.fr 14
2
ABSTRACT
16
Genebanks harbor original landraces carrying many original favorable alleles for 17
mitigating biotic and abiotic stresses. Their genetic diversity remains however poorly 18
characterized due to their large within genetic diversity. We developed a high-throughput, 19
cheap and labor saving DNA bulk approach based on SNP Illumina Infinium HD array to 20
genotype landraces. Samples were gathered for each landrace by mixing equal weights from 21
young leaves, from which DNA was extracted. We then estimated allelic frequencies in each 22
DNA bulk based on fluorescent intensity ratio (FIR) between two alleles at each SNP using a 23
two step-approach. We first tested either whether the DNA bulk was monomorphic or 24
polymorphic according to the two FIR distributions of individuals homozygous for allele A or 25
B, respectively. If the DNA bulk was polymorphic, we estimated its allelic frequency by using 26
a predictive equation calibrated on FIR from DNA bulks with known allelic frequencies. Our 27
approach: (i) gives accurate allelic frequency estimations that are highly reproducible across 28
laboratories, (ii) protects against false detection of allele fixation within landraces. We 29
estimated allelic frequencies of 23,412 SNPs in 156 landraces representing American and 30
European maize diversity. Modified Roger's genetic Distance between 156 landraces estimated 31
from 23,412 SNPs and 17 SSRs using the same DNA bulks were highly correlated, suggesting 32
that the ascertainment bias is low. Our approach is affordable, easy to implement and does not 33
require specific bioinformatics support and laboratory equipment, and therefore should be 34
highly relevant for large-scale characterization of genebanks for a wide range of species. 35
Keywords: Landraces, DNA pooling, Genetic diversity, 50K Illumina Infinium HD Zea 36
mays L., Allelotyping , genebanks 37
3
INTRODUCTION
38
Genetic resources maintained in situ or ex situ in genebanks represent a vast reservoir 39
of traits/alleles for future genetic progress and an insurance against unforeseen threats to 40
agricultural production (Tanksley 1997; Hoisington et al. 1999; Kilian and Graner 2012; 41
McCouch et al. 2012). Due to their local adaptation to various agro-climatic conditions and 42
human uses, landraces are particularly relevant to address climate change and the requirements 43
of low input agriculture (Fernie et al. 2006; McCouch et al. 2012; Mascher et al. 2019). For 44
instance, maize displays considerable genetic variability, but less than 5 % of this variability 45
has been exploited in elite breeding pools, according to (Hoisington et al. 1999). However, 46
landraces are used to a very limited extent, if any, in modern plant breeding programs, because 47
they are poorly characterized, genetically heterogeneous and exhibit poor agronomic 48
performance compared to elite material (Kilian and Graner 2012; Strigens et al. 2013; Brauner 49
et al. 2019; Mascher et al. 2019; Hölker et al. 2019). Use of molecular techniques for
50
characterizing genetic diversity of landraces and their relation with the elite germplasm is 51
essential for a better management and preservation of genetic resources and for a more efficient 52
use of these germplasms in breeding programs (Hoisington et al. 1999; Mascher et al. 2019). 53
The genetic diversity of landraces conserved ex situ or in situ has been extensively studied 54
using various types of molecular markers such as restriction fragment length polymorphism 55
(RFLP) or simple sequence repeat (SSR) in maize (Dubreuil and Charcosset 1998; Dubreuil et 56
al. 1999; Rebourg et al. 1999, 2001; Gauthier et al. 2002; Rebourg et al. 2003; Reif et al. 2005b;
57
Vigouroux et al. 2005; Reif et al. 2005a; Camus-Kulandaivelu 2006; Dubreuil et al. 2006; 58
Eschholz et al. 2010; Mir et al. 2013), in Pearl Millet (Bhattacharjee et al. 2002), cabbage (Dias 59
et al. 1991; Divaret et al. 1999), Barley (Parzies et al. 2000; Backes et al. 2003; Hagenblad et
60
al. 2012), pea (Hagenblad et al. 2012), oat (Hagenblad et al. 2012), rice (Ford-Lloyd et al.
61
2001; McCouch et al. 2012), Alfalfa (Pupilli et al. 2000; Segovia-Lerma et al. 2003) and fonio 62
millet (Adoukonou-Sagbadja et al. 2007). SSRs have proven to be markers of choice for 63
analyzing diversity in different plant species and breeding research, because of their variability, 64
ease of use, accessibility of detection and reproducibility (Liu et al. 2003; Reif et al. 2006; Yang 65
et al. 2011). Nevertheless, the development of SSR markers requires a substantial investment
66
of time and money. Allele coding is also difficult to standardize across genotyping platforms 67
and laboratories, a major drawback in a genetic resources characterization context. SNPs have 68
become the marker of choice for various crop species such as maize (Ganal et al. 2011), rice 69
(McCouch et al. 2010), barley (Moragues et al. 2010) and soybean (Lam et al. 2010). They are 70
4 the most abundant class of sequence variation in the genome, co-dominantly inherited, 71
genetically stable and appropriate to high-throughput automated analysis (Rafalski 2002). For 72
instance, maize arrays with approx. 50,000 and 600,000 SNP markers are available since 2010 73
(Illumina MaizeSNP50 array, Ganal et al. 2011) and 2013 (600K Affymetrix Axiom, Unterseer 74
et al., 2013), respectively. SNP arrays may however lead to some ascertainment bias notably 75
when diversity analysis was performed on a plant germplasm distantly related from those that 76
have been used to discover SNP put on the array (Nielsen 2004; Clark et al. 2005; Hamblin 77
et al. 2007; Inghelandt et al. 2011; Frascaroli et al. 2013). Properties of SNP array regarding
78
diversity analysis have to be carefully investigated to evaluate ascertainment biais. For maize 79
50K Infinium SNP array, only “PZE” prefixed SNPs (so called later PZE SNPs in this study) 80
give consistent results for diversity analysis as compared with previous studies based on SSR 81
markers and are therefore suitable for assessing genetic variability (Inghelandt et al. 2011; 82
Ganal et al. 2011; Bouchet et al. 2013; Frascaroli et al. 2013). 50K Infinium SNP array has 83
been used successfully to decipher genetic diversity of inbred lines (van Heerwaarden et al. 84
2011; Bouchet et al. 2013; Frascaroli et al. 2013; Rincent et al. 2014), landraces using either 85
doubled haploids (Strigens et al. 2013) or a single individual per accession (van Heerwaarden 86
et al. 2011; Arteaga et al. 2016), or teosinte with few individuals per accession (Aguirre‐
87
Liguori et al. 2017). 88
Due to high diversity within accessions, characterization of landraces from allogamous 89
species such as maize or alfalfa should be performed based on representative sets of individuals 90
(Reyes-Valdés et al. 2013, Segovia-Lerma et al., 2002, Dubreuil and Charcosset., 1998). 91
Despite the recent technical advances, genotyping large numbers of individuals remains very 92
expensive for many research groups. To bring costs down, estimating allele frequencies from 93
pooled genomic DNA (also called “allelotyping”) has been suggested as a convenient 94
alternative to individual genotyping using high-throughput SNP arrays (Sham et al. 2002; 95
Teumer et al. 2013) or using Next Generation Sequencing (Schlötterer et al. 2014). It was 96
successfully used to decipher global genetic diversity within maize landraces using RFLPs 97
(Dubreuil and Charcosset 1998; Dubreuil et al. 1999; Rebourg et al. 2001, 2003; Gauthier et 98
al. 2002) and SSR markers (Reif et al. 2005a; Camus-Kulandaivelu 2006; Dubreuil et al. 2006;
99
Yao et al. 2007; Mir et al. 2013). Various methods for estimating gene frequencies in pooled 100
DNA have been developed for RFLP (Dubreuil and Charcosset 1998), SSR (LeDuc et al. 1995; 101
Perlin et al. 1995; Daniels et al. 1998; Lipkin et al. 1998; Breen et al. 1999) and SNP marker 102
arrays in human and animal species (Hoogendoorn et al. 2000; Craig et al. 2005; Brohede 2005; 103
5 Teumer et al. 2013; Gautier et al. 2013). These methods have been successfully used to detect 104
QTL (Lipkin et al. 1998), to decipher genetic diversity (Segovia-Lerma et al. 2003; Dubreuil 105
et al. 2006; Pervaiz et al. 2010; Johnston et al. 2013; Ozerov et al. 2013), to perform genome
106
wide association studies (Barcellos et al. 1997; Sham et al. 2002; Baum et al. 2007), to identify 107
selective sweep (Elferink et al. 2012) or to identify causal mutation in tilling bank (Abe et al. 108
2012). Genotyping DNA bulks of individuals from landraces with SNP arrays could therefore 109
be interesting to characterize and manage genetic diversity in plant germplasm. SNP arrays 110
could be notably a valuable tool to identify selective sweep between landraces depending on 111
their origin, to manage plant germplasm collection at worldwide level (e.g. identify duplicate), 112
to identify landraces poorly used so far in breeding programs or to identify genomic regions 113
where diversity has been lost during the transition from landraces to inbred lines (Arca et al., in 114
prep).
115
In this study, we developed a new DNA bulk method to estimate allelic frequencies at SNPs 116
based on Fluorescent Intensity data produced by the maize 50K Illumina SNP array (Ganal et 117
al. 2011). Contrary to previous methods that have been mostly developed for QTL detection
118
purposes, our approach is dedicated to genome-wide diversity analysis in plant germplasm since 119
it protects against false detection of alleles. Additionally, calibration of equations for predicting 120
allelic frequencies of DNA bulks for each SNP is based on controlled pools with variable allelic 121
frequencies rather than only heterozygous genotypes as in previous methods (Hoogendoorn et 122
al. 2000; Brohede 2005; Peiris et al. 2011; Teumer et al. 2013). As a proof of concept, we
123
applied our new approach to maize by estimating allelic frequencies of 23,412 SNPs in 156 124
maize landraces representative of European and American diversity present in genebanks 125
(Arca et al., in prep). To our knowledge, it is the first time that a DNA bulk approach was used 126
on 50K maize high-throughput SNP array to study genetic diversity within maize landraces 127
germplasm. 128
RESULTS
129
We developed a new method to estimate allelic frequencies of SNPs within pools of 130
individuals using the fluorescent intensity ratio (FIR) between A and B alleles from Illumina 131
MaizeSNP50 array. Briefly, allelic frequencies at SNPs belonging to MaizeSNP50 array were 132
estimated within 156 maize landraces by pooling randomly 15 individuals per population and 133
by calibrating a predictive two-step model (Figure 1). We considered only the subsample of 134
32,788 prefixed PZE markers (so called PZE SNPs) that have proven suitable for diversity 135
6 analyses (Ganal et al. 2011). Among these SNPs, we selected 23,412 SNPs that passed weighted 136
deviation (wd) quality criteria (wd>50). This removed SNPs for which estimated allelic 137
frequency deviated strongly from expected allelic frequency (Figure. S1 A, B, C, D, E, F and 138
G for the threshold choice and validation). 139
Accuracy of allelic frequency prediction and detection of allele fixation
140
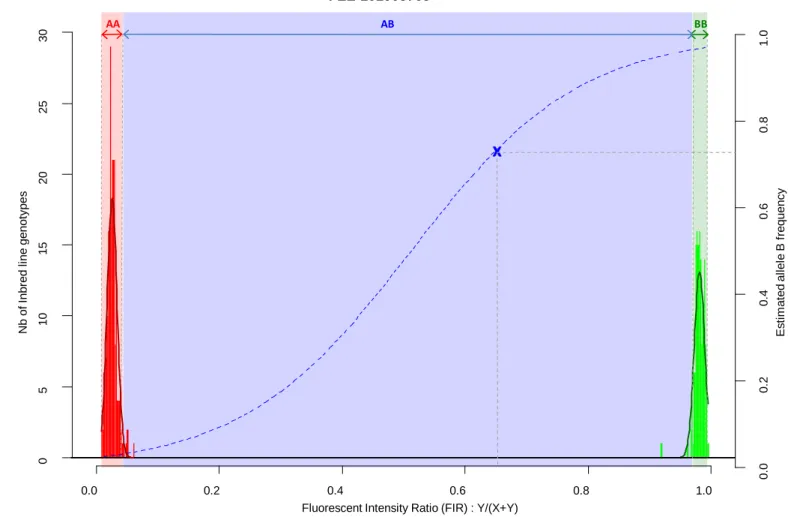
In order to prevent erroneous detection of alleles within landraces, we first tested for each 141
landrace whether allele A or allele B was fixed at a given SNP locus (Figure 1). We tested for 142
each SNP whether the FIR of the landrace was included within one the two Gaussian 143
distributions drawn from mean and variance of FIR of genotypes AA and BB within the inbred 144
line panel (Figure 1). For landraces that were considered polymorphic after this first step (allele 145
fixation rejected for both alleles), we estimated allelic frequency based on FIR by using a unique 146
logistic regression model for the 23,412 SNPs, calibrated with a sample of 1,000 SNPs (Figure 147
1). Parameters of the logistic model were adjusted on these 1,000 SNPs using FIR of two series 148
of controlled pools whose allelic frequencies were known (Figure S2). We obtained these pools 149
by mixing various proportion of two series of three inbred lines with known genotypes (Table 150
1). The1,000 SNPs were selected to maximize the allelic frequency range within controlled 151
pools (Table 1). The logistic regression was calibrated on 1,000 SNPs taken together rather than 152
for each SNP individually to avoid the ascertainment bias that would be generated by selecting 153
only SNPs polymorphic in the controlled pools (Figure S3) and to reduce loss of accuracy in 154
prediction for SNPs displaying limited allelic frequency range in two controlled pools (Figure 155
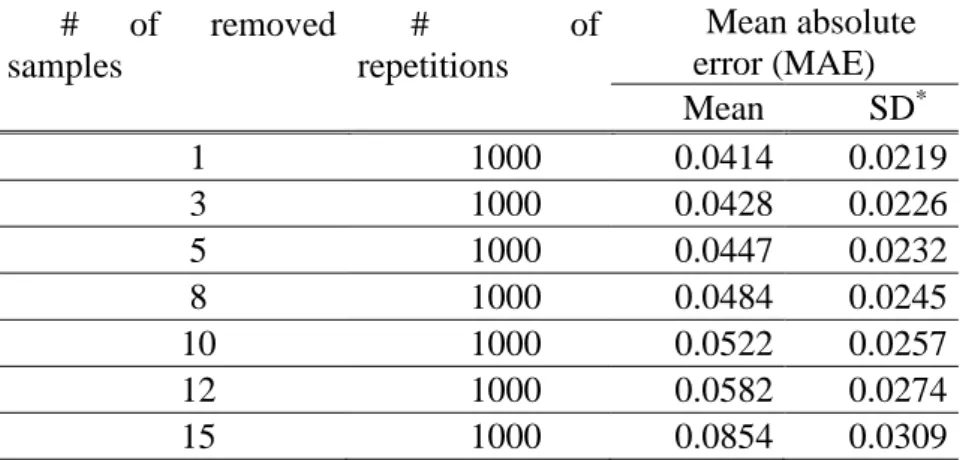
S4). To investigate the loss of accuracy of the prediction curve due to a reduction in allelic 156
frequency ranges in controlled pool, we progressively removed at random from one to 15 157
samples from the calibration set of the 1000 above described SNPs. The mean absolute error 158
(MAE) between 1000 replications increased significantly from 4.14 % to 8.54 % when 159
removing more samples (Table 2). For comparison, MAE was 7.19 % using a cross-validation 160
approach in which the predictive equation was calibrated with a random subsample of 800 out 161
of 1000 SNPs, and then applied to estimate allelic frequencies for the remaining 200 SNPs 162
(Table S1). Calibrating the logistic regression between FIR and allelic frequency in controlled 163
pool based on 1000 SNPs therefore appears well adapted to prevent ascertainment bias while 164
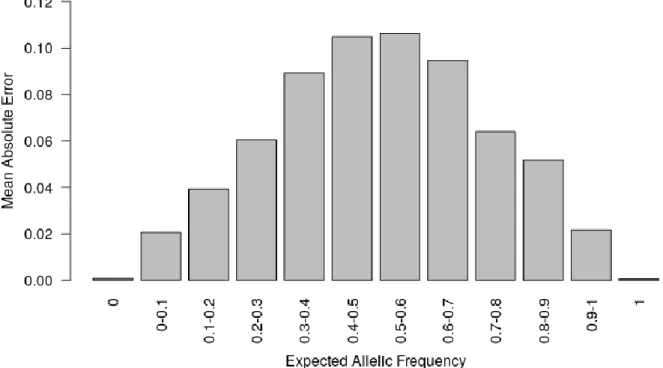
increasing globally prediction accuracy (Figure S4). Finally, we observed that MAE was higher 165
for balanced allelic frequencies than for almost fixed allelic frequencies (Figure 2 and Tables 166
S2). Accordingly, the dispersion of predicted frequencies were larger for expected allelic 167
frequencies near 0.5 than for fixed alleles (Table S2). 168
7
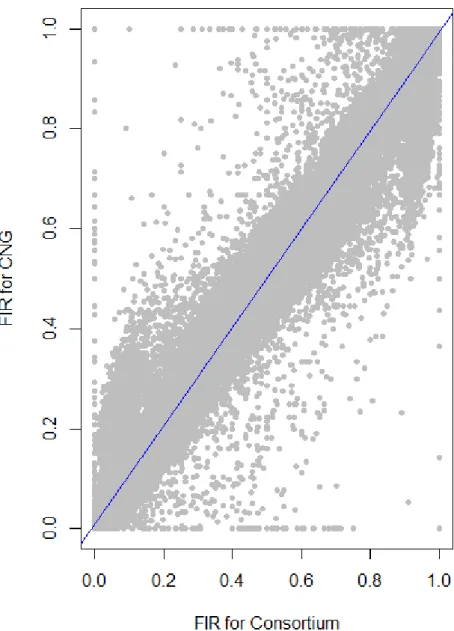
Reproducibility of frequency across laboratories and samples
169
We evaluated the reproducibility of the method across laboratories by comparing FIR of 170
one series of controlled pools from two different laboratories using all PZE SNPs or 23,412 171
SNPs selected using wd criterion (Figure 3). The correlation between the two different 172
laboratories for controlled pools was very high (r2>0.98) whether we selected the SNPs based
173
on wd criterion or not. Beyond reproducibility across laboratories, the precision of frequency 174
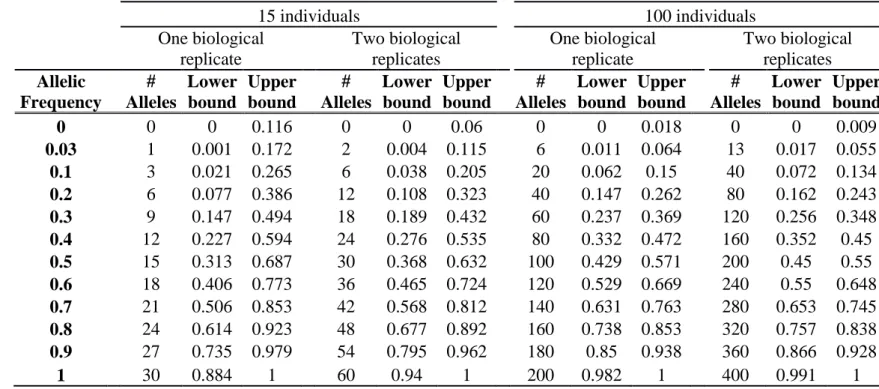
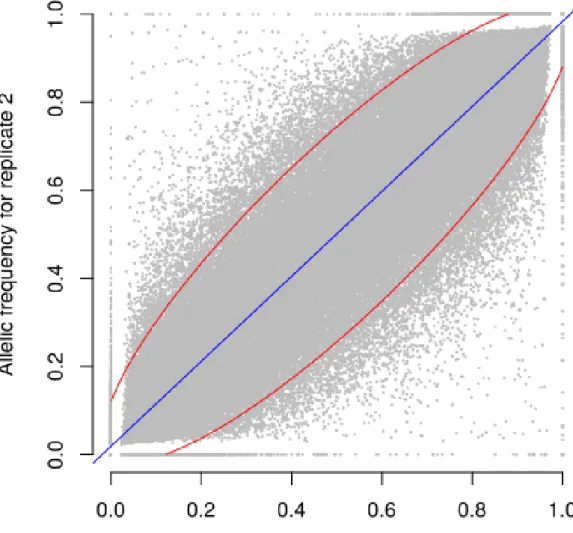
estimation depends on the sampling of individuals within landraces (Table 3). The precision of 175
frequency estimation was addressed both by numerical calculation and by the independent 176
sampling of 15 different individuals (30 different gametes) within 10 landraces (biological 177
replicate). For both numerical calculations and biological replicates, the sampling error was 178
higher for loci with balanced allelic frequencies than for loci that are close to fixation (Table 3, 179
Figure 4). Sampling error also decreased as the number of sampled individuals increased (Table 180
3). Considering a true frequency of 50% within landraces, we expect that 95% of frequency 181
estimates lie between 31.30% and 68.70% when sampling 15 individuals per landrace and 42.9 182
to 57.13% when sampling 100 individuals per landrace (Table 3). Considering biological 183
replicates, allelic frequencies of the two biological replicates over 23,412 SNPs were highly 184
correlated except for population Pol3 (Table S3). When excluding Pol3, 94.5% of points were 185
located within the 95% confidence limits accounting for the effect of sampling alone, 186
suggesting that the error inherent to the frequency estimation for DNA pools was very low 187
compared to the sampling error (Figure 4). Over nine populations with replicates (excluding 188
Pol3), we observed only four situations among 23,412 loci where two different alleles were 189
fixed in the two replicates (Figure 4). Loci for which an allele was fixed in one replicate was 190
either fixed or displayed a high frequency (above 88%) for the same allele in the other replicate 191
in 98% of cases. Moreover, we estimated pairwise roger’s genetic distance (MRD) based on 192
23,412 SNPs between the two independent pools from the same landraces. Excluding 193
Population Pol3 (MRD = 0.208), this distance ranged from 0.087 to 0,120 (Table S3). These 194
values provide a reference to decide whether two populations can be considered different or 195
not. 196
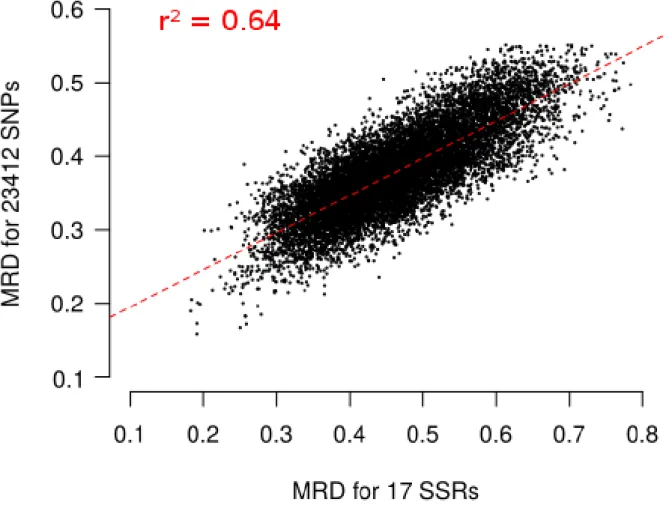
Effect of SNP number and wd on the relationship of genetic distance
197
estimated with SNP and SSR
198
Finally, we evaluated the possible ascertainment bias due to SNP selection with our filtering 199
based on wd criterion. MRD obtained with 17 SSR markers (MRDSSR) and MRD based on
8 different set of SNP markers (MRDSNP) were highly correlated (Figure 5), indicating a low
201
ascertainment bias. The selection of SNPs based on wd quality criterion strongly increased the 202
coefficient of determination (r²) between MRDSNP and MRDSSR, from 0.587 to 0.639 (Figure
203
S6). We attempted to define the minimal SNP number required to correctly describe the 204
relationship between maize landraces. While increasing the number of SNPs from 500 to 2500 205
slightly increased r2 between MRDSNP and MRDSSRfrom 0.606 to 0.638 (Figure S6 D,E,F), we
206
observed no further increase beyond 2500 SNPs (Figure S6 A, B, C) suggesting that 2,500 207
SNPs are enough to obtain a correct picture of landrace relationships. 208
9
DISCUSSION
209
A molecular approach for diversity analysis of landraces needs to answer several criteria 210
(i) an accurate estimation of allelic frequency in each population, (ii) a robust and reproducible 211
measurement of allelic frequency across laboratories in order to facilitate comparison of genetic 212
diversity of accessions across genebanks, (iii) a reliable estimate of genetic distance between 213
landraces with no or little ascertainment bias (iv) an affordable, high-throughput and labor 214
efficient method, due to both strong financial and human constraints in plant genebanks. Four 215
main sources of errors affect the accuracy of allelic frequency estimation of a locus in a 216
population using a DNA pooling approach: (i) the sampling of individuals (so called “sampling” 217
errors), (ii) the procedure to mix DNA from individuals (so called “DNA mixing” errors) (iii) 218
the imprecision of quantitative measurement used by the model for the prediction (so called 219
“experimental” errors) and (iv) the predictive equation used to predict allelic frequency in a 220
population (so called “approximation” errors). 221
A two-step model to protect against erroneous detection of
222
polymorphism and predict accurately allelic frequencies in DNA bulk
223
Approximation errors due to predictive equation depend on (i) the model used to predict 224
allelic frequencies and (ii) the set of individuals and SNPs used to calibrate the predictive 225
equation. In this study, we used a two-step modeling using inbred lines and controlled pools as 226
sets of calibration to test for polymorphism and then predict allelic frequency for polymorphic 227
markers. Detection of allele fixation in a population is an important issue for deciphering 228
and managing genetic diversity within plant and animal germplasm. We used two Student 229
tests based on fluorescent intensity ratio (FIR) distribution of lines homozygous for allele 230
A and B to determine polymorphism of a SNP in a given landrace (Figure 1). In this first 231
step, we preferred a method based on FIR distribution rather than the clustering 232
approach implemented in genome studio because it is possible to control the type I risk 233
of false allele detection (at 5% in our study). Using this two-step approach reduces 234
strongly the erroneous detection of polymorphisms in a population compared to previous 235
methods: MAE for fixed locus <0.1% in our approach (Table S2) vs ~2-3% using PPC 236
method (Brohede 2005) or ~2-8% using different k correction from (Peiris et al. 2011). 237
This is not surprising as previous methods focused on an accurate estimation of the 238
difference in allele frequencies between DNA bulks of individuals contrasted for a 239
10 quantitative trait of interest (Sham et al. 2002; Craig et al. 2005; Kirov et al. 2006; Teumer 240
et al. 2013) and did not focus specifically on protecting again false detection of alleles.
241
For loci that were detected as polymorphic, we predicted allelic frequencies from 242
FIR in landrace DNA pools by using a unique logistic regression for 23,412 SNPs passing 243
wd quality criterion. The relationship between FIR and allelic frequency was modelled
244
using a quasi-logistic regression for different reasons. First, the logistic function ensures 245
that the predicted frequencies take value in (0,1), a property that is not satisfied by 246
polynomial regression (PPC) or tan transformation (Brohede 2005; Teumer et al. 2013). 247
Second, one could observe that the relationship between the fluorescent intensity ratio 248
and allelic frequencies within controlled pools was not linear (Figure S2). 249
This two-step approach led to a low global error rate in allelic frequency prediction 250
(MAE = 3% for polymorphic and monomorphic loci considered jointly; Figure 2, Table S2). 251
It is comparable to the most accurate previous pooling DNA methods for SNP array that 252
used a specific model for each SNP: (i) MAE ranging from 3 to 8 % (Peiris et al., 2011) or 253
5-8% (Brohede et al., 2005) depending of k-correction applied (ii) MAE ~ 3% for PPC 254
correction (Brohede et al., 2005; Teumer et al., 2013) (iii) MAE ~ 1% for tan-correction 255
(Teumer et al., 2013). Several factors can explain this relative good global accuracy of our 256
approach. First, almost half of the loci were fixed on average in each landrace, which 257
contributed positively to global accuracy since our method over-performed previous 258
methods for fixed locus (see above). Second, wd quality criterion removed SNPs for which 259
allelic frequencies were poorly predicted using FIR. We observed indeed that increasing 260
the threshold for wd quality criterion led to a global increase in accuracy at both steps 261
(Figure S1). While 90% of SNPs have a MAE<2% for wd criterion >10, only 50% of SNPs 262
have a MAE<2% for wd criterion <10. Taking into account differential hybridization by 263
using a specific logistic regression for each SNP could be a promising way to further 264
improve the accuracy of allelic frequencies prediction, notably for balanced allelic 265
frequencies (Brohede et al., 2005, Peiris et al., 2011, Teumer et al., 2013). To limit possible 266
ascertainment bias and errors in allelic frequency estimation, it requires however to 267
genotype additional series of controlled pools for SNPs for which current controlled pools 268
were monomorphic or have a limited range of allelic frequency (Figure S3 and S4). 269
11 To estimate the parameters of the logistic regression, we used two series of controlled 270
pools rather than heterozygous individuals for both technical and practical reasons. 271
Controlled pools cover more homogenously the frequency variation range than 272
heterozygous and homozygous individuals only, which therefore limits the risk of 273
inaccurate estimation of logistic model parameters. Different studies showed that 274
accuracy of allelic frequency estimation strongly depends on accuracy of FIR estimation 275
for heterozygous individual and therefore the number of heterozygous individuals (Le 276
Hellard et al. 2002; Simpson 2005; Jawaid and Sham 2009). Between 8 and 16 277
heterozygous individuals are recommended to correctly estimate FIR mean for 278
heterozygous individuals, depending on FIR variance (Le Hellard et al. 2002). In maize, 279
we can obtain heterozygote genotypes either by crossing inbred lines to produce F1 280
hybrids, by planting seeds from maize landraces, or by using residual heterozygosity of 281
inbred lines. Using residual heterozygosity to calibrate model is not possible since half 282
SNPs show no heterozygous genotype in the 327 inbred lines of our study. Obtaining at 283
least 16 heterozygous individuals for each SNP therefore requires to genotype a few 284
dozens of F1 hybrids or individuals from landraces considering that expected 285
heterozygosity in a landrace is comprised between 3 and 28% (Arca et al., in prep). This 286
represents additional costs since maize researchers and breeders genotyped 287
preferentially inbred lines to access directly haplotypes without phasing and because 288
genotypes of F1 hybrids can be deduced of that of their parental inbred lines. Beyond 289
allogamous species as maize, genotyping heterozygous individuals could be time 290
demanding and very costly in autogamous cultivated plant species for which genotyped 291
individuals are mostly homozygotes (wheat, tomato, rapeseed). On the contrary, one can 292
easily produce controlled pools whatever the reproductive system, either by mixing DNA 293
or equal mass of plant materials, which allows producing a wide range of allelic 294
frequencies. 295
Effect of DNA mixing procedure on accuracy allelic frequency estimation
296
There are two main errors coming from DNA mixing procedure: (i) the “sampling error” 297
that is directly connected to the number of individuals sampled in each population (Table 3), 298
and (ii) the “bulking error” associated with the laboratory procedure to mix equal DNA amounts 299
of sampled individuals. 300
12 We evaluated sampling and bulking errors by comparing 10 independent biological 301
replicates from 10 different landraces obtained by independently sampling and mixing 302
equal leaf areas of young leaves of 15 individuals. Allelic frequencies estimated for both 303
biological replicates from a same landrace were highly correlated. Excluding Pol3, 94.5% 304
of difference of allelic frequencies between replicates was of included within 95% 305
confidence limits originated from sampling effect only Figure 4). This suggests that the 306
“bulking error” is low compared to the “sampling error”. Consistently, Dubreuil et al., 307
(1999) observed a low “bulking error” for RFLP markers using the same DNA pooling 308
method, with a coefficient of determination of 0.99 between allelic frequencies based on 309
individual genotyping of plants and those predicted using DNA bulks. Several studies also 310
showed that the effect of bulking errors on allelic frequencies measured by comparing 311
DNA pool and individual genotyping of plant of this DNA pool is very low compared with 312
other sources of errors (Le Hellard et al. 2002; Jawaid and Sham 2009). Additionally, the 313
mixing procedure starting from leaf samples strongly reduced the number of DNA 314
extractions for each DNA bulk as compared to first extracting DNA from each individual, 315
and then mixing by pipetting each DNA samples to obtain an equimolar DNA mix (“post-316
extraction” approach). Since the cost of DNA extraction becomes non-negligible when the 317
number of individual increases, mixing plant material based on their mass before 318
extraction is highly relevant to save time and money. This can be done without losing 319
accuracy as shown in this study for SNP array and previously for RFLP by Dubreuil et al., 320
(1999). 321
We highlighted the critical importance of the number of individuals sampled per 322
landrace on allelic frequency estimation (Table 3). By using DNA pooling, accuracy can be 323
gained with very little additional cost by increasing number of sampled individuals. 324
Whereas a high accuracy of allelic frequency estimation within landraces is required to 325
scan genome for selective sweeps, it is less important to estimate global genetic distance, 326
due to the large number of SNPs analyzed. Sampling fifteen plants per population (30 327
gametes) appears convenient to obtain an accurate estimation of frequencies in a 328
population and analyze genetic diversity (Reyes-Valdés et al. 2013). 329
A low ascertainment bias to estimate genetic distance between landraces
13 There are two possible sources of ascertainment bias using a DNA pooling approach on a 331
SNP array. The first one relates to the design of array because the set of lines to discover SNPs 332
may not well represent genetic diversity and a threshold in allelic frequency was possibly 333
applied to select SNPs. The second one relates to the selection of a subset of SNPs from the 334
array regarding the genetic diversity of samples in calibration set used to predict allelic 335
frequencies. 336
To avoid risk of ascertainment bias due to selection of markers genotyped by the 337
array, the logistic regression model was adjusted on 1,000 SNPs with the largest allelic 338
frequency range rather than for each of the 23,412 PZE SNPs individually. Using a specific 339
model for each SNP would indeed conduct to discard markers monomorphic in controlled 340
pools and therefore select only markers polymorphic between parents of controlled pool. 341
Note that the same issue would be raised by using heterozygous individuals since 8 to 16 342
heterozygotes were recommended to adjust a logistic regression. Using heterozygous 343
individuals and SNP specific equations could lead to systematically counter-select SNPs 344
with low diversity. It could also lead to systematically remove SNPs that are differentially 345
fixed between isolated genetic groups, because no or very few heterozygote individuals 346
are available. 347
We also evaluated ascertainment bias by comparing Modified Roger’s Distance (MRD) 348
between the 156 landraces obtained using SNPs (MRDSNP) and SSRs (MRDSSR)
(Camus-349
Kulandaivelu 2006; Mir et al. 2013), which display no or limited ascertainment bias. 350
MRDSNP was highly correlated with MRDSSR (r2 = 0.64; Figure 5). This correlation is high
351
considering that SSR and SNP markers evolve very differently (mutation rate higher for 352
SSRs than SNPs, multiallelic vs biallelic), that the number of SSR markers used to estimate 353
genetic distance is low and that errors in allelic frequency prediction occur for both SNPs 354
and SSRs. For comparison, correlation was lower than between Identity By State 355
estimated with 94 SSRs and 30k SNPs in a diversity panel of 337 inbred lines (r2 = 0.41) 356
, although very few genotyping errors are expected in inbred lines (Bouchet et al. 2013). 357
Using the wd criterion significantly increased the correlation between MRDSNP and MRDSSR
358
markers for 156 landraces (Figure S5). It suggests that the wd criterion removes SNP 359
markers that blurred the relationships between landraces. We can therefore define a 360
subset of 23,412 SNPs to analyze global genetic diversity in landraces. This is in 361
14 agreement with previous studies in inbred lines showing that PZE SNPs are suitable to 362
analyze the genetic diversity in inbred lines (Inghelandt et al. 2011; Ganal et al. 2011; 363
Bouchet et al. 2013; Frascaroli et al. 2013). These studies showed that diversity analysis 364
based on PZE SNPs give consistent results with previous studies based on SSR markers 365
(Inghelandt et al. 2011; Bouchet et al. 2013; Frascaroli et al. 2013). 366
The DNA pooled-sampling approach therefore provides a reliable picture of the 367
genetic relatedness among populations that display a large range of genetic divergence 368
and opens a way to explore genome-wide diversity along the genome. 369
An affordable, high-throughput, labor-efficient and robust method
370
compared to SSR / RFLP markers and sequencing approaches
371
Using SNP arrays instead of SSR/RFLP marker systems or sequencing approaches 372
has several advantages. First, SNP genotyping using arrays is very affordable compared 373
to SSR/RFLP or resequencing approaches because it is highly automatable, high-374
throughput, labor-efficient and cost effective (currently 30-80€ / individual depending of 375
array). Obtaining accurate estimations of allelic frequencies using a whole genome 376
sequencing (WGS) approach requires high depth and coverage for each individual 377
because of the need of counting reads (Schlötterer et al. 2014). To estimate allelic 378
frequency in DNA bulks, WGS remains costly compared to SNP arrays for large and 379
complex genomes of plant species as maize. Different sequencing approaches based either 380
on restriction enzyme or sequence capture make it possible to target some genomic 381
regions and multiplex individuals, reducing the cost of library preparation and 382
sequencing while increasing the depth for the selected regions (Glaubitz et al. 2014). 383
However, these sequencing approaches remain more expensive than SNP arrays and 384
require laboratory equipment to prepare DNA libraries and strong bioinformatics skills 385
to analyze sequencing data. These skills are not always available in all genebanks. With 386
the maize 50K array, FIR measurement used to predict allelic frequencies were highly 387
reproducible both across laboratories and batches (r2 = 0.987; Figure 3). We can 388
therefore consistently predict allelic frequencies using 50K array in new DNA pools 389
genotyped in other laboratories, by applying the same parameters of presence /absence 390
test and logistic regression as in this study. This will greatly facilitate the comparison of 391
accessions across collections and laboratories. This is a strong advantage over SSRs for 392
15 which a strong laboratory effect has been observed for the definition of alleles, leading to 393
difficulties for comparing genetic diversity across seedbanks and laboratories (Mir et al. 394
2013). Similarly, one can expect some laboratory effect for sequencing approaches due to 395
preparation of library and bioinformatics analysis. However, there is some disadvantage 396
to use SNP arrays instead of SSR markers or sequencing approach. First, SNP marker are 397
bi-allelic whereas SSRs are multi-allelic. At a constant number of markers, using SNPs 398
rather than SSRs therefore leads to less discriminative power (Laval et al. 2002; Hamblin 399
et al. 2007). This disadvantage is largely compensated by the higher number of SNPs and
400
the fact that SNPs are more frequent and more regularly spread along the genome than 401
SSR/RFLP, allowing genome wide diversity analyses. Second, contrary to SSR / RFLP 402
markers and sequencing approach, SNP array does not allow one to discover new 403
polymorphisms, which may lead to ascertainment bias for diversity analysis of new 404
genetic groups (Nielsen 2004; Clark et al. 2005; Hamblin et al. 2007; Inghelandt et al. 405
2011; Frascaroli et al. 2013). Comparison with SSRs results showed that PZE SNPs 406
provide reliable genetic distances between landraces, suggesting a low ascertainment 407
bias for a global portrayal of genetic diversity (see above). Sequencing techniques may be 408
interesting in a second step to identify, among preselected accessions, those which show 409
an enrichment in new alleles. 410
The number of SNPs affects the estimates of relationship between landraces and 411
population structure (Moragues et al. 2010). In our study, the correlation coefficient 412
between MRDSNP and MRDSSR increased with increasing number of SNPs and reached a
413
plateau for 2,500 SNPs (Figure S6). This suggests that increasing the number of SNPs 414
above 2,500 does not provide further improvement in precision to estimate relationships 415
between landraces as compared to 17 SSRs. Our approach could therefore be made further 416
cost efficient by selecting less loci for studying global genetic relationships and genetic 417
diversity. For maize, a customizable 15K Illumina genotyping array has been developed that 418
includes 3,000 PZE SNPs selected for studying essential derivation (Rousselle et al. 2015) and 419
12,000 others selected for genetic applications such as genomic selection. Alternatively, the 420
same approach could be applied to other genotyping arrays with higher density as the 600K 421
Affymetrix Axiom Array (Unterseer et al., 2013) to gain precision in detection of selective 422
footprints. 423
16
CONCLUSION
424
The DNA pooling approach we propose overcomes specific issues for genetic diversity 425
analysis and plant germplasm management purposes that were not or partially addressed by 426
previous methods which were mostly focused on QTL analysis and genome wide association 427
studies (Hoogendoorn et al. 2000; Craig et al. 2005; Brohede 2005; Teumer et al. 2013). As 428
proof of concept, we used the DNA pooling approach to estimate allelic frequencies in maize 429
landraces in order to identify original maize landraces in germplasm for pre-breeding 430
purposes and selective footprints between geographic and/or admixture groups of 431
landraces cultivated in contrasted agro-climatic conditions (Arca et al., in prep). Our 432
approach could be very interesting for studying plant germplasm since time, money and 433
molecular skills can be limiting factors to study and compare large collections of landraces 434
maintained in seedbank (Mir et al. 2013). Applications could be expanded to QTL 435
identification in pools (Gallais et al. 2007), detecting signatures of selection in multi-generation 436
experiments, or detection of illegitimate seed-lots during multiplication in genebanks. The DNA 437
pooling approach could be easily applied to decipher organization of genetic diversity in 438
other plant germplasm since Infinium Illumina HD array have been developed for several 439
cultivated plant species, including soybean, grapevine, potato, sweet cherry, tomato, 440
sunflower, wheat, oat, brassica crops but also animal species. 441
MATERIALS AND METHODS
442
Plant material
443
Landraces
444
A total of 156 landrace populations (Table S4) were sampled among a panel of 413 445
landraces capturing a large proportion of European and American diversity and analyzed in 446
previous studies using RFLP (Dubreuil and Charcosset 1998; Rebourg et al. 1999, 2001, 2003; 447
Gauthier et al. 2002) and SSR markers (Camus-Kulandaivelu 2006; Dubreuil et al. 2006; Mir 448
et al. 2013).
449
Each population were represented by a bulk of DNA from 15 individual plants, mixed in 450
equal amounts as described in Reif et al. (2005) and Dubreuil et al. (2006). In order to analyze 451
17 the effect of individual sampling on allelic frequency estimation (see below), ten populations 452
were represented by two DNA bulks of 15 plants sampled independently (Table 3). 453
Controlled DNA Pools
454
To calibrate a prediction model for SNP allelic frequencies in populations, we considered 455
two series of nine controlled pools derived from the mixing of two sets of three parental inbred 456
lines: EP1 – F2 – LO3 (European Flint inbred lines) and NYS302– EA1433 – M37W (Tropical 457
inbred lines). 458
For each set of three parental lines, we prepared nine controlled pools by varying the 459
proportion of each line in the mix (Table 1), measured as the number of leaf disks with equal 460
size according to Dubreuil et al., (1999). The proportion of lines 2 and 3 (EA1433 and M37W 461
or F2 and LO3) varies similarly whereas line 1 (EP1 or NYS302) varies inversely. The genotype 462
of the inbred lines and the proportion of each inbred line in each pool give the expected allelic 463
frequencies as shown in Table 1. Combination of genotypes in parental lines can conduct either 464
to monomorphic or polymorphic controlled pools if the genotypes of 3 parental lines are the 465
same or not, respectively. If we exclude monomorphic controlled pools and heterozygote SNPs 466
in parental lines, these different combinations conduct to four different polymorphic 467
configurations in the 9 controlled pools, corresponding to four ranges of allelic frequencies: 1-468
33% (R1), 33-50% (R2), 51-67% (R3), 67-99% (R4), (Table 1). Combination of R1 and R4 469
configurations in two series of controlled pools displayed the largest allelic frequencies range 470
(1% to 99%) while combination of R2 and R3 displayed a more reduced allelic frequency range 471
(33% to 67%). 472
Inbred lines
473
To test for allele fixation within landraces, we used a panel of 333 inbred maize lines 474
representing the worldwide diversity well characterized in previous studies (Camus-475
Kulandaivelu 2006; Bouchet et al. 2013) (Table S5). This panel includes the six inbred lines 476
used to build two series of controlled pools. 477
Genotyping
478
We used the 50K Illumina Infinium HD array (Ganal et al. 2011) to genotype (i) 166 DNA 479
bulks representing 156 landraces (ii) 18 DNA bulks representing 2 series of controlled DNA 480
pools (iii) 333 inbred lines. 50K genotyping was performed according to the manufacturer's 481
instructions using the MaizeSNP50 array (IlluminaInc, San Diego, CA). The genotype results 482
18 were produced with GenomeStudio Genotyping Module software (v2010.2, IlluminaInc) using 483
the cluster file MaizeSNP50_B.egt available from Illumina. The array contains 49,585 SNPs 484
passing quality criteria defined in (Ganal et al. 2011). 485
We also used 17 SSRs genotyping data from 145 and 11 landraces analyzed by Camus et 486
al. (2006) and Mir et al. (2013), respectively. 487
Measurement variable: fluorescence intensities ratio
488
The MaizeSNP50 array has been developed into allele-specific single base extension using 489
two colors labeling with the Cy3 and Cy5 fluorescent dyes. The fluorescent signal on each spot 490
is digitized using GenomeStudio software. Data consist of two normalized intensity values (x, 491
y) for each SNP, with one intensity for each of the fluorescent dyes associated with the two 492
alleles of the SNP. The alleles measured by the x intensity value (Cy5 dye) are arbitrary, with 493
respect to haplotypes, are called the A alleles, whereas the alleles measured by the y intensity 494
value (Cy3 dye) are called the B alleles. 495
We assumed that the strength of the fluorescent signal of each spot is representative of the 496
amount of labeled probe associated with that spot. The amount of labeled probes at each spot 497
relies upon the frequency of the corresponding alleles of PCR product immobilized on it. Based 498
on this assumption, the fluorescent intensity ratio (FIR) of each spot (y/(x+y)) can be employed 499
to estimate the allele frequency of DNA bulk immobilized on it. 500
To test the reproducibility of the measurement the controlled pool of European lines was 501
genotyped twice in two platforms, at CNG Genotyping National Center, Evry 91, France, and 502
at Trait Genetics. 503
SNP filtering and quality control
504
For the purpose of this study, we used only the subset of 32,788 markers contributed by the 505
Panzea project (http://www.panzea.org/), so called PZE SNPs, developed on the basis of US 506
NAM founders (Zhao 2006). These SNPs represent a comprehensive sample of the maize 507
germplasm and are therefore suitable for diversity analysis (Ganal et al. 2011). 508
The following equation (1) was then used to create a rank score (weighted deviation, wd) 509
for each SNP in order to identify and remove those of poor quality, 510 𝑤𝑑 = |µAA ‐µBB| √𝑁AA∙𝜎AA2+𝑁BB∙𝜎BB2 𝑁AA +𝑁BB (1) 511
19 where µAA and σAA and µBB and σBB are the mean and the standard deviation for the
512
fluorescence intensity ratios of AA and BB genotypes for the 327 inbred lines panel and NAA
513
and NBB is the number of inbred lines with genotype AA or genotype BB respectively. To avoid
514
selection bias, loci which were monomorphic within the reference inbred lines population were 515
selected using the wd equations (1), assuming µAA=0 and σAA=0 for monomorphic BB SNPs
516
or assuming µBB=1 and σBB=0 for monomorphic AA SNPs.
517
This criterion removes from analysis those SNPs for which distributions of fluorescence 518
signal ratios for AA and BB genotypes of 327 inbred lines panel overlap or have large variances. 519
To analyze genetic diversity, we first selected 23,656 with wd above 50 among 32,788 PZE 520
SNPs. This threshold removed SNPs displaying high error rate in allelic frequency prediction 521
(Figure S1). In addition, we removed 244 SNPs that were heterozygous in one of parental lines 522
of controlled pools and that displayed high error rate in allelic frequency prediction (data not 523
shown). 524
Alleles detection and allele frequency estimation
525
Allele frequency estimation within DNA pools was implemented as a two-step process. We 526
first determined the fixation of alleles A and/or B by comparing the fluorescent ratio of DNA 527
pools at a given SNP locus with the distribution of the fluorescent signal of inbred lines (see 528
above) which have AA or BB genotypes at the same locus. We assumed Gaussian distributions 529
for the fluorescent intensities and tested for fixation using a Student’s t-tests with a 5% type I 530
nominal level. 531
In second step, for each SNP for which alleles A and B were both declared present, the 532
allelic frequency fB of allele B was inferred using the following generalized linear model: 533
𝑔(𝑓B) = ∝ +𝛽x+y𝑦 (2) 534
where x and y are the fluorescent intensities at SNPfor alleles A and B respectively, α and 535
β are the parameters of a logistic curve, calibrated on fluorescent ratio data from controlled 536
pools for 1000 SNPs and εi is a noise term. As allele B frequency is a binomial variable, GLM
537
was set with a logit link function (R, version 3.0.3). 538
The calibration sample of 1,000 SNPs consists in 250 randomly selected SNPs for each 539
possible configuration (R1, R2, R3, R4 defined in Table 1). It was preferred to a calibration 540
sample of all SNPs or to a specific prediction curve for each SNPs, in order to have a 541
homogeneous distribution of observations into each class of expected frequency. Calibrating 542
20 the model for each SNP would lead to high error in allelic frequency prediction, notably for 543
monomorphic controlled pools as exemplified by Figure S3 and S4. Calibrating model for all 544
SNPs would give strong weight to fixed allele in calibration due to large number of 545
monomorphic controlled pools that are homozygous either for allele A or B. 546
Accuracy of allelic frequency estimation
547
We assessed the accuracy of allele frequency estimates from pooled DNA samples by 548
calculating the absolute difference between allelic frequencies of the B allele predicted by our 549
two-step model and those expected for controlled pools from the genotype of their six parental 550
lines. We obtained expected allelic frequencies for two series of controlled pools by weighting 551
the allelic frequency of each parental line (0 or 1) by their relative mass in the mix (Table 1). 552
We obtained genotypes of inbred lines from clustering by genome studio. This absolute 553
difference was averaged over SNPs and samples in order to obtain mean absolute error (MAE). 554
We first evaluated the mean absolute error for 23,412 SNPs in the two series of controlled 555
pools (Table S2, Figure 2). In order to estimate the effect of the calibration set of individuals 556
and SNPs on the accuracy of allelic frequency prediction, we applied two cross-validation 557
approaches on the 1000 SNPs and the two series of controlled pools and six parental inbred 558
lines (24 samples) used to calibrate parameters of the common logistic regression. In order to 559
evaluate the effect of SNP calibration set (Table S1), we repeated five time a K-fold approach 560
in which 1000 SNPs were split randomly in a training set of 800 SNPs on which we calibrated 561
our two-step model and a validation set of 200 SNPs on which we predicted allelic frequency 562
using this model in same two series controlled pools and estimated MAE. In order to evaluate 563
the effect calibration samples (Table 2), we repeated 1000 times a K-fold approach on 1000 564
SNPs in which 1, 3, 5, 8, 10, 15 samples among 18 from controlled pools were randomly 565
removed from the calibration set. We used the remaining samples to estimate parameters of the 566
logistic regression, and then predicted allelic frequencies using this predictive equation in these 567
K removed samples (Table 2). 568
To estimate sampling error (Table 3), we estimated the 95% confidence interval of the 569
allelic frequency in the population considering various observed allelic frequency obtained by 570
sampling either 15, 30, 100 or 200 individuals from this population. To obtain the lower and 571
upper bound of the 95% confidence interval for allelic frequency in the population, we 572
considered the binomial probability to obtain various number of allele B in 15, 30, 100, 200 573
individuals (estimated allelic frequencies) from a population (true allelic frequencies) by using 574
21 binom.confint function implemented in R package “binom”. We used the following parameters: 575
binom.confint(x = number of alleles observed, n = 2*number of individuals, conf.level=95%, 576
methods = exact) with x = number of successes and n = number of trial in the binomial 577
experiment. 578
Comparison of genetic distance between SNP and SSR markers
579
We calculated the modified Roger’s distance (MRD) (Rogers 1972) based on allelic 580
frequency data between landraces using different sets of markers to analyze the effect of the wd 581
criterion (Figure S5) and of the number of markers (Figure S6) on the estimation of relatedness. 582
To analyze the effect of wd criterion, we selected four random sets of 2,000 SNPs with different 583
wd ranges (0-20, 20-40, 40-60, 60-80) among 32,788 PZE SNPs. To analyze the effect of SNP
584
number, we selected six random sets of SNPs with various number of SNPs (15,000, 10,000, 585
5000, 2500, 1000, 500) among 23,412 SNPs with wd above 50. In order to test if the genetic 586
distance is robust when changing the type and the number of markers, we compared MRD 587
between landraces estimated with different SNP datasets with that estimated with 17 SSR 588
markers (Figure 5, Figure S5 and Figure S6). Missing allele frequencies within accession were 589
replaced by corresponding average frequencies within the whole set of accessions before 590
running this analysis. Allelic frequencies of two samples for replicated landraces were averaged 591
before estimating MRD distance except for Pol3 for which one of two samples was removed 592
(WG0109808-DNAH04). 593
Coefficient of determination between the distance matrices based on different subsets of 594
SNP (MRDSNP) and 17 SSR markers (MRDSSR) was determined by using linear regression.
22 596
Acknowledgements
597
This study was funded by l’Association pour l’étude et l’amélioration du mais (PROmais) in 598
the project “Diversity Zea” and French National Research Agencies in project Investissement 599
d’Avenir Amaizing, (ANR-10-BTBR-01). We acknowledge greatly the French maize 600
Biological Ressources Center,PROmais, and INRAE experimental units of St Martin de Hinx 601
and Mauguio for collecting and maintaining Landraces and Inbred lines collection. We greatly 602
acknowledge the colleagues who initially collected these landraces and André Gallais for 603
having initiated these research programs. We also greatly acknowledge Pierre Dubreuil, Letizia 604
Camus-Kulandaivelu, Cecile Rebourg, Céline Mir, Domenica Maniccaci that conducted 605
previous study on these landraces using DNA pooling approach with SSR and RFLP markers. 606
The Infinium genotyping work was supported by CEA-CNG, by giving the INRAE-EPGV 607
group access to its DNA and cell bank service for DNA quality control and to their Illumina 608
genotyping platform. Thanks respectively to Anne Boland and Marie-Thérèse Bihoreau and 609
their staff. We acknowledge the EPGV group, Dominique Brunel, Marie-Christine Le Paslier, 610
Aurélie Chauveau for the discussion and management of the Illumina genotyping. 611
Author’s contribution
612
S.D.N, A.C and B.G designed and supervised the study and selected the plant material 613
M.A, S.D.N, A.C drafted and corrected the manuscript 614
D.M, V.C and A.B extracted DNA and managed genotyping of landraces and inbred lines 615
C.B, B.G and A.C collected, maintained landraces, and inbred lines collection 616
S.D.N, M.A, A.C and T.M-H developed the statistical methods and scripts for predicting 617
allelic frequency from fluorescent data 618
M.A, B.G and S.D.N analyzed genetic diversity of landraces panel. 619
All authors read and approved the manuscript. 620
Data availability
23 R scripts and fluorescent intensity data of 327 inbred lines and two series of controlled pools 622
used for predicting allelic frequency in DNA bulks of maize landraces by our two-step 623
approaches are available at https://doi.org/10.15454/GANJ7J. Fluorescent Intensity data and 624
allelic frequencies of 20 samples corresponding to 10 duplicated landraces were also available 625
at https://doi.org/10.15454/GANJ7J. Allelic frequencies of new DNA bulks for new maize 626
populations genotyped by maize 50K array could be predicted by using these datasets with R 627
scripts. Note that these datasets and R scripts will become available when the publication would 628
be accepted in a peer review journal. 629
Conflicts of interest
630 No 631 63224
REFERENCES
633
Abe, A., S. Kosugi, K. Yoshida, S. Natsume, H. Takagi et al., 2012 Genome sequencing reveals 634
agronomically important loci in rice using MutMap. Nat Biotech 30: 174–178. 635
Adoukonou-Sagbadja, H., C. Wagner, A. Dansi, J. Ahlemeyer, O. Daïnou et al., 2007 Genetic 636
diversity and population differentiation of traditional fonio millet (Digitaria spp.) 637
landraces from different agro-ecological zones of West Africa. Theor. Appl. Genet. 115: 638
917–931. 639
Aguirre‐Liguori, J. A., M. I. Tenaillon, A. Vázquez‐Lobo, B. S. Gaut, J. P. Jaramillo‐Correa et 640
al., 2017 Connecting genomic patterns of local adaptation and niche suitability in
641
teosintes. Mol. Ecol. 26: 4226–4240. 642
Arteaga, M. C., A. Moreno-Letelier, A. Mastretta-Yanes, A. Vázquez-Lobo, A. Breña-Ochoa 643
et al., 2016 Genomic variation in recently collected maize landraces from Mexico.
644
Genomics Data 7: 38–45. 645
Backes, G., B. Hatz, A. Jahoor, and G. Fischbeck, 2003 RFLP diversity within and between 646
major groups of barley in Europe. Plant Breed. 122: 291–299. 647
Barcellos, L. F., W. Klitz, L. L. Field, R. Tobias, A. M. Bowcock et al., 1997 Association 648
Mapping of Disease Loci, by Use of a Pooled DNA Genomic Screen. Am. J. Hum. 649
Genet. 61: 734–747. 650
Baum, A. E., N. Akula, M. Cabanero, I. Cardona, W. Corona et al., 2007 A genome-wide 651
association study implicates diacylglycerol kinase eta (DGKH) and several other genes 652
in the etiology of bipolar disorder. Mol. Psychiatry 13: 197–207. 653
Bhattacharjee, R., P. Bramel, C. Hash, M. Kolesnikova-Allen, and I. Khairwal, 2002 654
Assessment of genetic diversity within and between pearl millet landraces. Theor. Appl. 655
Genet. 105: 666–673. 656
Bouchet, S., B. Servin, P. Bertin, D. Madur, V. Combes et al., 2013 Adaptation of maize to 657
temperate climates: mid-density genome-wide association genetics and diversity 658
patterns reveal key genomic regions, with a major contribution of the Vgt2 (ZCN8) 659
locus. PloS One 8: e71377. 660
Brauner, P. C., W. Schipprack, H. F. Utz, E. Bauer, M. Mayer et al., 2019 Testcross 661
performance of doubled haploid lines from European flint maize landraces is promising 662
for broadening the genetic base of elite germplasm. Theor. Appl. Genet. 132: 1897– 663
1908. 664
Breen, G., P. Sham, T. Li, D. Shaw, D. A. Collier et al., 1999 Accuracy and sensitivity of DNA 665
pooling with microsatellite repeats using capillary electrophoresis. Mol. Cell. Probes 666
13: 359–365. 667
25 Brohede, J., 2005 PPC: an algorithm for accurate estimation of SNP allele frequencies in small 668
equimolar pools of DNA using data from high density microarrays. Nucleic Acids Res. 669
33: e142–e142. 670
Camus-Kulandaivelu, L., 2006 Maize Adaptation to Temperate Climate: Relationship Between 671
Population Structure and Polymorphism in the Dwarf8 Gene. Genetics 172: 2449–2463. 672
Clark, A. G., M. J. Hubisz, C. D. Bustamante, S. H. Williamson, and R. Nielsen, 2005 673
Ascertainment bias in studies of human genome-wide polymorphism. Genome Res. 15: 674
1496–1502. 675
Craig, D. W., M. J. Huentelman, D. Hu-Lince, V. L. Zismann, M. C. Kruer et al., 2005 676
Identification of disease causing loci using an array-based genotyping approach on 677
pooled DNA. BMC Genomics 6: 138. 678
Daniels, J., P. Holmans, N. Williams, D. Turic, P. McGuffin et al., 1998 A simple method for 679
analyzing microsatellite allele image patterns generated from DNA pools and its 680
application to allelic association studies. Am. J. Hum. Genet. 62: 1189–1197. 681
Dias, J. S., M. B. Lima, K. M. Song, A. A. Monteiro, P. H. Williams et al., 1991 Molecular 682
taxonomy of Portuguese tronchuda cabbage and kale landraces using nuclear RFLPs. 683
Euphytica 58: 221–229. 684
Divaret, I., E. Margalé, and G. Thomas, 1999 RAPD markers on seed bulks efficiently assess 685
the genetic diversity of a Brassica oleracea L. collection: Theor. Appl. Genet. 98: 1029– 686
1035. 687
Dubreuil, P., and A. Charcosset, 1998 Genetic diversity within and among maize populations: 688
a comparison between isozyme and nuclear RFLP loci. Theor. Appl. Genet. 96: 577– 689
587. 690
Dubreuil, P., C. Rebourg, M. Merlino, and A. Charcosset, 1999 Evaluation of a DNA pooled-691
sampling strategy for estimating the RFLP diversity of maize populations. Plant Mol 692
Biol Rep 17: 123–138. 693
Dubreuil, P., M. Warburton, M. Chastanet, D. Hoisington, and A. Charcosset, 2006 More on 694
the introduction of temperate maize into Europe: Large-scale bulk SSR genotyping and 695
new historical elements. Maydica 51: 281–291. 696
Elferink, M. G., H.-J. Megens, A. Vereijken, X. Hu, R. P. M. A. Crooijmans et al., 2012 697
Signatures of Selection in the Genomes of Commercial and Non-Commercial Chicken 698
Breeds (T. Shioda, Ed.). PLoS ONE 7: e32720. 699
Eschholz, T. W., P. Stamp, R. Peter, J. Leipner, and A. Hund, 2010 Genetic structure and history 700
of Swiss maize (Zea mays L. ssp. mays) landraces. Genet. Resour. Crop Evol. 57: 71– 701
84. 702
Fernie, A. R., Y. Tadmor, and D. Zamir, 2006 Natural genetic variation for improving crop 703
quality. Curr. Opin. Plant Biol. 9: 196–202. 704
26 Ford-Lloyd, B. V., H. J. Newbury, M. T. Jackson, and P. S. Virk, 2001 Genetic basis for co-705
adaptive gene complexes in rice (Oryza sativa L.) landraces. Heredity 87: 530–536. 706
Frascaroli, E., T. A. Schrag, and A. E. Melchinger, 2013 Genetic diversity analysis of elite 707
European maize (Zea mays L.) inbred lines using AFLP, SSR, and SNP markers reveals 708
ascertainment bias for a subset of SNPs. Theor. Appl. Genet. 126: 133–141. 709
Gallais, A., L. Moreau, and A. Charcosset, 2007 Detection of marker–QTL associations by 710
studying change in marker frequencies with selection. Theor. Appl. Genet. 114: 669– 711
681. 712
Ganal, M. W., G. Durstewitz, A. Polley, A. Bérard, E. S. Buckler et al., 2011 A Large Maize 713
(Zea mays L.) SNP Genotyping Array: Development and Germplasm Genotyping, and 714
Genetic Mapping to Compare with the B73 Reference Genome (L. Lukens, Ed.). PLoS 715
ONE 6: e28334. 716
Gauthier, P., B. Gouesnard, J. Dallard, R. Redaelli, C. Rebourg et al., 2002 RFLP diversity and 717
relationships among traditional European maize populations. Theor Appl Genet 105: 718
Gautier, M., J. Foucaud, K. Gharbi, T. Cézard, M. Galan et al., 2013 Estimation of population 719
allele frequencies from next-generation sequencing data: pool-versus individual-based 720
genotyping. Mol. Ecol. 22: 3766–3779. 721
Glaubitz, J. C., T. M. Casstevens, F. Lu, J. Harriman, R. J. Elshire et al., 2014 TASSEL-GBS: 722
A High Capacity Genotyping by Sequencing Analysis Pipeline (N. A. Tinker, Ed.). 723
PLoS ONE 9: e90346. 724
Hagenblad, J., J. Zie, and M. W. Leino, 2012 Exploring the population genetics of genebank 725
and historical landrace varieties. Genet. Resour. Crop Evol. 59: 1185–1199. 726
Hamblin, M. T., M. L. Warburton, and E. S. Buckler, 2007 Empirical Comparison of Simple 727
Sequence Repeats and Single Nucleotide Polymorphisms in Assessment of Maize 728
Diversity and Relatedness (H. Ellegren, Ed.). PLoS ONE 2: e1367. 729
van Heerwaarden, J., J. Doebley, W. H. Briggs, J. C. Glaubitz, M. M. Goodman et al., 2011 730
Genetic signals of origin, spread, and introgression in a large sample of maize landraces. 731
Proc. Natl. Acad. Sci. 108: 1088–1092. 732
Hoisington, D., M. Khairallah, T. Reeves, J.-M. Ribaut, B. Skovmand et al., 1999 Plant genetic 733
resources: What can they contribute toward increased crop productivity? Proc. Natl. 734
Acad. Sci. 96: 5937–5943. 735
Hölker, A. C., M. Mayer, T. Presterl, T. Bolduan, E. Bauer et al., 2019 European maize 736
landraces made accessible for plant breeding and genome-based studies. Theor. Appl. 737
Genet. 132: 3333–3345. 738
Hoogendoorn, B., N. Norton, G. Kirov, N. Williams, M. Hamshere et al., 2000 Cheap, accurate 739
and rapid allele frequency estimation of single nucleotide polymorphisms by primer 740
extension and DHPLC in DNA pools. Hum. Genet. 107: 488–493. 741