SCRS/2008/196
APPLICATION OF THE PROCEAN MODEL TO THE EASTERN ATLANTIC
SKIPJACK (KATSUWONUS PELAMIS) TUNA FISHERY
Emmanuel Chassot1, John F. Walter III2, Daniel Gaertner1
SUMMARY
The PROCEAN (PRoduction Catch / Effort ANalysis) model is a multi-fleet biomass dynamic model developed in a Bayesian framework to conduct stock assessments based on catch and effort time series data. PROCEAN was applied to the eastern component of the Atlantic skipjack (Katsuwonus pelamis) to assess the current status of the stock and provide reference points to fishery managers. Data included 8 time series of catch and effort data spanning from 1969 to 2006 and mostly standardised based on generalized linear modelling techniques. Informative priors and constraints for some parameters were used to allow the model to converge. Model fits were generally good but indicated increasing trends in the residuals for some fishing fleets. Results suggested that the eastern Atlantic skipjack stock would be underexploited, with a biomass in 2006 equal to 1.8 times the biomass at the maximum sustainable yield (MSY) and a fishing mortality in 2006 equal to 30% of the fishing mortality at MSY (FMSY). A sensitivity analysis performed to account for uncertainty in some input
parameters showed that FMSY estimates were robust to parameter changes while MSY estimates
were sensitive to the prior distribution for MSY. Based on the different model runs, the MSY was estimated to be comprised between 152,000 and 185,000 t. The use of random walks on catchability was useful for tracking changes in catchability and associated increasing fishing power for some baitboat fishing fleets targeting skipjack.
KEYWORDS:
Bait fishing, fishing mortality, purse seining, skipjack, stock assessment,
surplus production model, tuna fisheries
1
Institut de Recherche pour le Développement, CRH, UMR 212 EME, Avenue Jean Monnet, BP 171, 34203 Sète cedex, France. Email: emmanuel.chassot@ird.fr
2
2
1. IntroductionThe PROCEAN (PRoduction Catch / Effort ANalysis) model is a multi-fleet non-equilibrium biomass dynamic model developed in a Bayesian framework to conduct stock assessments based on catch and effort time series data (Maury 2000, 2001). PROCEAN expands classical biomass dynamic models by including several statistical refinements that allow addressing issues related to temporal variation in catchability associated with changes in fishing power, technological improvements or fishing methodology. PROCEAN has been applied to several tuna stocks both in the Indian and Atlantic Oceans (Maury 2001, 2002, Maury and Nordström 2002) and tested through an age-structured simulation operating model (Maury and Chassot 2001). Given that many changes in fleet composition, fishing technology and methodology have occurred in the major fisheries for Atlantic skipjack tuna, PROCEAN offers a flexible modelling approach capable of handling these complex effects with the production modelling framework. No Atlantic skipjack (Katsuwonus pelamis) stock assessment has been carried out since 1999. In the present analysis, PROCEAN was applied to the eastern Atlantic skipjack tuna fishery to assess the current status of the stock and provide reference points to fishery managers.
2. Materials and methods
2.1 Data
2.1.1 Data sources
Catch and effort data were extracted from the ICCAT task 1 statistics database for the eastern Atlantic stock of skipjack tuna (i.e. east of 30° West including some small catch (< 200 t per year) in the Mediterranean). Catch data include quantities caught and landed for food purposes, including estimates of landing of “faux poisson” in local fish markets for 1981-2006 (Amon Kothias et al. 1994, 1996, N'Da et al. 2007, Chassot et al. in press), but excluding discards. The stock assessment was conducted for the period 1969-2006.
2.1.2 Fishing fleet selection
Fishing fleets considered relevant for assessing the changes in abundance for the eastern Atlantic skipjack were selected on the basis of their average total catch, fishing ground area, and length of catch and effort time series data: the Ghanaian bait boats during 1969-1982 (GHN-BB), the Spanish-Canarian bait boats during 1980-1991 (CAN1-BB) and 1992-2006 (CAN2-BB), the Portuguese-Azorean bait boats during 1970-2006 (POR-BB), the European Dakar-based and Senegalese bait boats during 1969-1983 (EUDKR1-BB) and 1984-2006 (EUDKR2), the European purse seiners fishing on fishing aggregating devices (FADs) mainly in equatorial areas during 1991-2006 (EC-PS-FAD), and the European purse seiners targeting free schools of skipjack off Senegal during the second quarter of the year during 1980-2006 (EUDKR-PS). Two distinct periods were considered for the bait boats in the Senegalese waters; an early period (1965-1983) prior to the development of a fishing technique where the bait boat is used to aggregate the tunas ('associated-school' fishing; Fonteneau and Diouf 1994) and a later period (1984-2006) reflecting the widespread adoption of this practice. This technique was adopted in the early 1990s in the Canarian waters (Delgado de Molina pers com).
2.1.3 Effort standardisation
Nominal fishing efforts were expressed in number of fishing days for both bait boats and purse seiners. Nominal catch and effort data were used for the Ghanaian (Wise 1986) and the Spanish-Canarian bait boats. For the other fishing fleets, a standardisation procedure was performed to correct effort data for spatial and seasonal effects, changes in targeting practice from one species to another, and some fleet characteristics such as holding capacity and flag, depending on the fleet of interest (e.g. for the EC purse seiners, Soto et al. in press). To account for the increase in purse seiner catchability associated with technological improvements, an annual constant correction factor of 3% was applied to the effort time series of EC-PS-FAD and EUDKR-PS, consistent with expert knowledge for these fisheries (e.g. Gascuel et al. 1993).
In addition, a standardized combined times series of catch per unit of effort (CPUE) was computed during the working group based on the eight time series available after effort standardisation (see above). To account for the spatial expansion/contraction experienced by the different fleets over time, each series has been weighted by the annual geographic distribution of the fishing fleet expressed in statistical rectangles of 5° in latitude and 5° in longitude (Fig. 1). The indices were then re-scaled so that they would add up to 1.0 each year.
2.2.1 PROCEAN
The PROCEAN model is a biomass dynamics model based on the generalized surplus production model of Pella and Tomlinson (1969) that links the stock biomass B with the fishing effort E and allows separation the different fishing fleets targeting the stock (Maury 2001, 2002). In PROCEAN, a semi-implicit numerical scheme is used to integrate the ordinary differential equation of Pella and Tomlinson (1969) and the catches are predicted (Fournier 1996). Definitions of estimated parameters and observed variables as well as process and observation equations are given in Tables 1 and 2, respectively.
2.2.2 Stochastic processes and penalties
Observed annual fleet-specific catches were assumed to be lognormally distributed about their model-predicted counterparts with some standard deviation σ (Table 4, S1). Variability in stock carrying capacity and in the catchability of individual fleets were considered to be process errors and modelled as lognormal random walk processes to represent small permanent changes through time (e.g. Fournier et al. 1998) (Table 4, S2-S3). In the present analysis, no temporal variability was considered for the stock carrying capacity and fluctuations of the stock surface were assumed to have only effects on fleet catchability. In addition, a process error was used to model large transient deviations in the effort-fishing mortality relationship. To reduce the influence of outliers that can bias estimates of model parameters, a two-component mixture distribution composed of a normal and a fat-tailed t-distribution was used for the catchabilities (Fournier et al. 1998, Chen and Fournier 1999, Chen et al. 2000, Chen et al. 2003) (Table 4, S4). The fat-tail distribution is a desirable alternative to the normal distribution as it allows higher probabilities of events occurring in the tails of the distribution and is parameterized by the proportion of data (p) subject to atypical errors in the fat-tailed likelihood and the size of the tail (e). Parameters were set to p = 0.05 and e = 3, following recommendations from Fournier (1996) and Chen and Fournier (1999) for a fat-tailed t-distribution with a few degrees of freedom (Table 5, L4).
To allow a separation between observation errors and process stochasticity, the ratio between the variance of the random walk process assumed to operate for temporal changes in catchability and the variance of observation errors was fixed to 0.4. The ratio between the variance in the effort-fishing mortality relationship and variance of observation errors was set to 0.2.
2.2.3 Estimation procedure
Computations were performed using AD Model Builder (Fournier 1996), a flexible, stable and efficient tool adapted for estimating non-linear model parameters (Maunder 2000, 2004), based on automatic differentiation (Griewank and Corliss 1991). Parameters were estimated based on the method of the maximum of posterior distribution (Bard 1974) by minimizing the total objective function, which includes the negative log-likelihood components (Table 5) and the prior probability contributions (see below). Posterior distributions of the model parameters can also be estimated using a Markov Chain Monte Carlo (MCMC) simulation approach starting from the parameters at the mode of the posterior distribution. In this case, the Hastings–Metropolis algorithm implemented in AD Model Builder is used. Confidence statements about parameters were here inferred from the estimates of the Hessian matrix at the mode of the posterior distribution (Fournier 1996).
2.3 Prior specification
Based on preliminary runs, insufficient information existed in the data to simultaneously estimate the model parameters and reconcile both increasing catches during the development of the eastern Atlantic fishery and the increasing trend in the combined standardised CPUE index (Fig. 1). As a consequence, extra information was provided to facilitate the convergence of the model through the specification of prior distributions for some parameters.
2.3.1 Growth rate parameter
A prior distribution was used for the intrinsic growth rate parameter r based on demographic methods (McAllister et al. 2001) using information from a meta-analysis of skipjack tuna populations (Anon 2008). A prior distribution for r was obtained through Monte Carlo sampling from distributions of basic life history inputs and then numerically solving the Euler-Lotka population growth equation (McAllister et al. 2001, McAllister and Carruthers 2007).
Inputs into the Euler-Lotka equation take the form of a standard life table representing age-specific rates of fecundity, maturity and natural mortality, and mean values of length and weight-at-age (Table 6).
Maturity-at-4
age for skipjack was assumed to be 50% at age 2 and 100% at age 3 based on an assumed size at first maturity of either 41 cm in the entire Atlantic (Cayré and Farrugio 1986) or 51 cm in the Southwestern Atlantic (Vilela and Castello 1993). The vector of mortality-at-age was assumed to be constant at 0.8 for all ages (Anon 1984) which is close to the value (0.77) estimated by Vilela and Castello (1993) using the equation of Rikhter and Efanov (1976). For the sake of simplicity, each mortality-at-age value was assumed to be normally distributed with a fixed variance of 0.04, assuming an additive error with age. Length and weight-at-age were derived from resampling in skipjack tuna growth parameters obtained from a meta-analysis (Gaertner et al. 2008) and a fixed length-weight relationship (Cayré and Laloë 1986). A Beverton-Holt stock recruitment relationship was assumed to estimate the number of age 1 female offspring expected to be produced per female of age a. Based upon the prior distribution for steepness used in the Western Pacific skipjack tuna assessments (Hampton 2002, Langley et al. 2003) but allowing a greater density towards lower values, a beta distribution on steepness with parameters 18 and 4 was used.Estimates of r were obtained by numerically solving 1,000 random combinations of steepness, natural mortality, and Von Bertalanffy growth rate parameters. The mean and standard deviation were estimated at 1.17 and 0.26, respectively and the histogram for r was considered to be closely approximated by a normal probability density function (Fig. 2).
2.3.2 Maximum sustainable yield (MSY)
In absence of informative prior distribution for MSY, initial runs based on several parameter sets showed that maximum posterior estimates (MPE) of MSY reached very large and inconsistent values of about 3.9e8-1.1e10 t. Based on preliminary analyses (Gaertner et al. 2001, 2008) a normal prior distribution was assumed for the MSY with mean 150,000 t and standard deviation 20,000 t. A sensitivity analysis to these values was performed to assess the impact on the MSY and fishing mortality at MSY (FMSY) MPEs (see below).
2.4. PROCEAN runs
2.4.1 Base case run
In a first step, the model was run without process error using catch and effort time series for the 8 fishing fleets. For this base case run, the shape parameter m was fixed at a value of 1.2 and prior distributions were considered for r and MSY (see above). The initial biomass of the stock in 1969 (B0) was difficult to estimate and assumed equal to a fixed proportion of the carrying capacity, i.e. a pristine biomass. For the standard run, a value of 0.9 was considered because skipjack were caught since the late 1940s by the baitboat fishery in Azores, Portugal. For the base case run, the parameter space to estimate then included 18 parameters from 159 observations: the growth rate parameter (r), the carrying capacity (K), the catchability coefficients of the 8 fishing fleets (qi), and
the variance of observation for each fishing fleet (σi).
2.4.2. Sensitivity analysis
The sensitivities of MSY and FMSY were examined by independently varying the shape parameter m, the
proportion of carrying capacity for the stock biomass in 1969, and the prior distributions for the shape parameter, r and MSY from the base case run values. A value of 1.7 was considered for the shape parameter to explore potential production curves between an exponential (Fox 1970) and a logistic model (Schaefer 1954). A value of 0.7 was considered for the ratio between the pristine biomass and the stock biomass in 1969, i.e. assuming the stock was 30% depleted in the early 1970s. Finally, the sensitivity of the priors was assessed by increasing the standard deviation of the prior on r to 0.7 and by assigning values of 130,000 and 170,000 to the mean of the prior distribution of MSY.
In a second step, the model was run by considering a process error on catchability to estimate potential changes of catchability in time for the different fishing fleets. A similar run with process error on catchability was conducted for a dataset where the indices for the Canarian and Dakar-based baitboat fleets were aggregated for the periods 1969-2006 and 1980-2006, respectively. The objective was to check the ability of PROCEAN to track the changes in these fleets with the introduction and development of associated-school fishing in the early 1980s for the Dakar-based baitboats (Fonteneau and Diouf 1994) and mid-1990s for the Canarian baitboats. Finally, a run was performed with the combined abundance index weighted by fishery area using the random walk process error on catchability for comparative purposes with the multi-fleet run.
3.1 Base case run
3.1.1 Quality of the fit
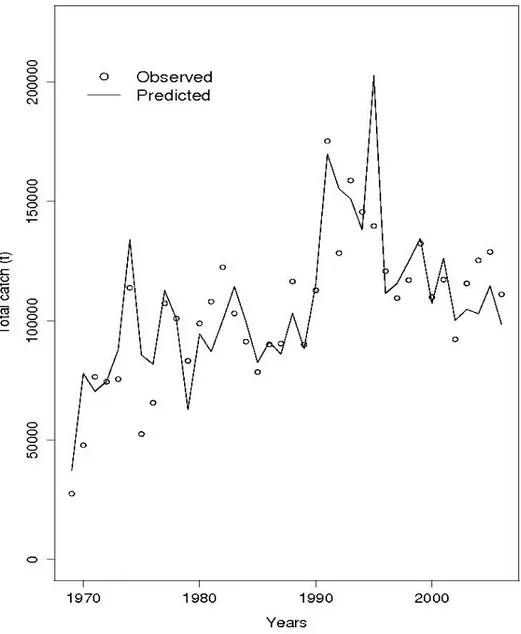
The base case run model fit the individual fleet catches reasonably well (Fig. 3), however the catch residuals showed increasing trends with time for the combined European and Senegalese bait boats (EURDKR.BB) and for the European purse seiners operating off Senegal, violating the assumption of lognormal error. The model fit for the total catch was good, the residuals showing no clear trend (Fig. 4).
3.1.2 Parameter estimates
MPEs indicated that the growth rate parameter (r = 1.169) was very close to the mean of its prior distribution while the MPE for the MSY of 170,200 t was higher than the mean assigned to the prior distribution (Table 7). MPEs of the catchability coefficients for the 2 time series of Canarian baitboats were very close (about 0.003) while the catchability of the Dakar based baitboat fishery was estimated to have increased of 35% between 1969-83 and 1984-06.
The uncertainty on the catchability coefficients assessed through the coefficients of variation (CV) was about 30% for all fishing fleets and lower for the growth rate (23%) and MSY (10%) (Table 7). The uncertainty on initial biomass was low (2%), indicative of good confidence in the carrying capacity estimate. The posterior distribution for the MSY was close to the prior distribution but slightly narrower, indicating that information in the data was used for updating the prior.
3.1.3 Stock status
The total catches observed in time were located along the equilibrium production curve derived from the MPE of the parameters r, K and the fixed value of m (Fig. 5). This might be due to the relative high intrinsic rate of population growth and short time span of the skipjack that recruit to the fishery at age 1 yr, mature at ages 2-3 yr, and are mainly caught between age 1-4 so that long lags would not be expected in the population's response to changing effort. Based on the standard run, the stock appeared underexploited in 2006 with the fishing mortality below the fishing mortality at MSY, i.e. F/FMSY = 0.32 in 2006, and the biomass above the biomass at MSY, i.e.
B/BMSY = 1.79 (Fig. 6). Biomass estimates were associated with a large uncertainty and showed a decreasing
trend through time (Fig. 7).
3.2. Sensitivity analysis
The sensitivity analysis showed that the MSY was insensitive to a change in the shape parameter m and the initial biomass in 1969 (Table 7). The fishing mortality at MSY was affected by setting the shape parameter m, to 1.7, i.e. 152% greater relative to the base case run. This parameter modifies the shape of the equilibrium production curve and hence FMSY expressed in the model as r(m-1)/m. This change in FMSY did not change the conclusions
about the status of the stock. The MSY estimates were quite sensitive to a change in the mean of the prior normal distribution for MSY, a decrease in the mean value decreasing the MSY estimated (Table 7). The FMSY was
unaffected by a change in the parameters of the prior distribution for MSY. Increasing the variance for the r prior (i.e. down-weighting the information provided to r) did not affect the model results and conclusions on the stock status (Table 7).
Considering a process error for the catchability improved the fit of the model and accorded better to the assumption of a lognormal distribution for the observed catch (results not shown). The MSY (~153,000 t) estimated was similar independent of the number of fishing fleets considered (1, 6 or 8) and was close to the mean of the prior distribution (Table 7).
3.3. Tracking the changes in catchability
Estimates of relative catchability based on process error modelled as a lognormal random walk showed a decreasing trend in catchability through the 1980s for the Spanish-Canarian baitboats followed by a strong increase during 1995-1998 (Fig. 8a). The catchability then decreased through the 2000s. This major increase in apparent catchability could be related to the introduction of the “associated fishing school” method. The European-Senegalese baitboats showed a small increase in catchability in the early 1980s at the period of introduction of “associated-school fishing” method. The relative catchability showed thereafter a strong and steady increase from 3 to almost 10 in the mid-2000s (Fig. 8b).
6
4. Discussion4.2 From nominal effort to fishing mortality
Several catch and effort time series collected from the major fishing fleets targeting skipjack were used to capture the dynamics of the eastern Atlantic fishery. The estimation of an effective fishing effort (i.e. depicting fishing mortality) from purse-seine effort data is a challenging task, mainly because of the strong dependence between nominal effort such as searching time and technological equipment and human skills that are highly variable in time and space (Fonteneau et al. 1999, Gaertner and Pallares 2002). The multispecies character of tropical tuna fisheries also complicates the CPUE-abundance relationship as changes in fish targeting through time according to tuna availability and international market prices are difficult to account for in effort standardisation (Fonteneau et al. 1999).
In the present analysis, purse seine fishing effort was standardised to account for some factors such as holding capacity and seasonal effects but no information on changes in technical equipment (electronic equipment, FAD, sonar, satellite imagery, etc.) was included in the standardisation process. Technological improvements have also occurred in the bait boat fisheries operating off Senegal and off Canaries, but to a lesser extent. In addition, the development of FAD-associated fishing since the mid-1990s might also blur the notion of fishing effort as the fishing sets mainly depend on the ability to detect the FADs that are now equipped with radio range beacons or satellite transmitters (Fonteneau et al. 1999, Gaertner and Pallares 2002). In the same way, the development of the fishing method of 'associated-school fishing' by the bait boat fishing fleets has led to strong changes in fishing efficiency and hence catchability, affecting eventually the derivation of abundance indices from CPUE data (Fonteneau and Diouf 1994). In all cases, the constant and non-linear dynamics of fishing efficiency through time have certainly resulted in wide fluctuations of the fishing power and overall fishing capacity of the bait boat and purse seine fleets over time. In absence of accurate information on such dynamics, the statistical approach implemented in PROCEAN in the form of random walk structures seems to be a useful tool to tack temporal changes in catchability.
4.2 Assessing the status of skipjack
Several aspects of their biology and ecology make the application of age-structured models to assess the status of skipjack stocks difficult. In particular, skipjack spawn opportunistically throughout the year in vast areas of the ocean, which makes it difficult to identify and monitor individual cohorts (Cayré and Farrugio 1986). In addition, the apparent variable growth between areas might impair the interpretation of size distributions and their conversion to ages (Bard and Antoine 1986, Gaertner et al. 2008). Complex integrated age-structured models including tagging data (MULTIFAN-CL; Fournier et al. 1998) have recently been applied to assess the state of the tropical Pacific skipjack stock (Hampton 2002, Langley et al. 2003) and more recently the western Atlantic skipjack stock (Restrepo and De Bruyn in press). An application of MULTIFAN-CL to the eastern Atlantic tuna stock has been tentatively done during the last ICCAT session on 'Yellowfin and skipjack stock assessments' but did not provide consistent results mainly due to inconsistencies in tagging datasets available. As an alternative to age-structured approaches, surplus production models are robust tools to assess the dynamic response of fish populations to exploitation and eventually provide a scientific advice on the state of the stocks (Ludwig and Walters 1985, Hilborn and Walters 1992). The application of biomass dynamics models to tuna stocks might, however, be limited by some large pelagic fishery-specific factors such as the geographic expansion of the fishing area in time (Laloë 1989), the temporal changes in catchability related to increasing fishing power (e.g. Gascuel et al. 1993), and the changes in targeting in response to market incentives that can affect the estimation of effective fishing efforts. PROCEAN has been developed to address these complex issues within the production modelling framework (Maury 2001, Maury and Chassot 2001).
A major difficulty with the use of surplus production models is the simultaneous estimation of model parameters due to the often lack of information in the data (Hilborn and Walters 1992). A method to improve model estimation is the addition of auxiliary information to constrain some parameters values (Hoenig et al. 1994, Fournier 1996, McAllister et al. 2001). In the case of eastern Atlantic skipjack, catch and effort data time series were quite uninformative and auxiliary information was provided through the use of prior distributions for the growth rate parameter r and the MSY. Demographic methods based on a meta-analysis of skipjack life history traits were used to construct a prior distribution for r through a Monte Carlo framework. Such methods rely on a theoretical basis and have been shown to be useful to integrate age-structured demographic information for improving parameter estimation (McAllister et al. 2001, McAllister and Carruthers 2007). Posterior estimates of r were generally close to the prior mean when no process error on catchability was considered, indicating that the
auxiliary information was used in the fitting process. Down-weighting the information provided to r by increasing the prior variance did not affect the results of the model. Posterior estimates of r however departed from prior mean when random walk structures were used to model slow temporal changes in catchabilities, suggesting that information in the data was then used to update the prior.
Auxiliary information was also provided to the model through a MSY prior distribution to improve the empirical basis for parameter estimation (Hoenig et al. 1994). Using a prior distribution for a parameter relevant to management such as the MSY might seem tautological, i.e. an expected result of the model is a priori constrained. Nevertheless, this is fully equivalent to adding prior information on the other parameters (the growth rate r, the carrying capacity K, and the shape parameter m) since the MSY can be analytically expressed as a function of these model parameters. An interesting aspect of this approach is that information on MSY can be available from empirical models or values of yield per unit area (Hoenig et al. 1994). Here, extra-information on MSY was derived from an empirical method based on changes in yearly relative rates of catch (Gaertner et al. 2001).
Despite the sensitivity of PROCEAN results to the prior for MSY derived from a method based on catch data, all scenarios accorded to the results of the other assessment methods, leading to the conclusion that the eastern Atlantic skipjack did not show any clear sign of overfishing during the entire time series. The MSY estimates of 152-185,000 t were higher than estimated in the early 1980s (about 100,000 t) based on surplus production models and virtual population analysis (Fonteneau 1986). This could be due to the geographic expansion of the fishery (Lalöe 1989) and the temporal changes in fishing pattern associated with the development of the FAD-fishing activity. Skipjack catches observed during the early to mid-1990s were close to PROCEAN estimates of MSY while they decreased thereafter to reach about 115,000 t in the recent years. The high catch levels of the mid-1990s corresponded to a period characterized by an intense FAD-fishing activity in the Eastern tropical Atlantic, particularly in the productive South Sherbro area (0–5° N and 10–20° W) where tuna prey such as Vinciguerria nimbaria concentrate in relation to particular oceanographic features (Lebourges et al. 2000). The decline in skipjack catch could be explained by the decrease in fishing effort in the Atlantic ocean associated with the decrease in the number of fishing vessels (e.g. Pianet et al. in press) and the implementation of the Atlantic tuna protection plan (moratorium on log-school fishing) during the months of November, December, and January in the area delimited by 4°S and 5°N, and east of the African coast as far as 20° W. In addition to decreasing skipjack catches, the moratorium was intended to reduce harvests of bigeye and yellowfin juveniles and avoid growth overfishing. The recent adoption of a new moratorium based on a closure for the surface fishing in a smaller area (0º-5ºN, 10ºW-20ºW) and only during the month of November in the Gulf of Guinea might benefit in the future to skipjack catches but affect at the same time bigeye and yellowfin yield-per-recruit values (Anon 2008).
5. Conclusion
Although our findings could suggest a certain sustainability of the current catch levels of eastern Atlantic skipjack, they should be considered with caution regarding the strong assumptions made about the MSY and r prior distributions and major difficulties associated with the use of commercial CPUE to derive abundance indices (e.g. Fonteneau et al. 1999).
Acknowledgements. We are grateful to all technicians from IRD and IEO involved in data collection and thank Maria Soto Ruiz (IEO) and Pilar Pallares (ICCAT) for standardizing some CPUE data. Many thanks to Guillermo Diaz (NMFS) for computing the combined index of abundance during the working group. Olivier Maury (IRD) kindly provided us with the ADMB code for PROCEAN. Alain Fonteneau (IRD) made useful comments on an earlier draft of the manuscript.
8
ReferencesAMON KOTHIAS, J., A. Hervé, F.X. Bard. 1994. Update of quantities of minor tunas (Auxis, Euthynnus) and small tunas (skipjack, yellowfin, bigeye) landed as market fish in Abidjan, 1981-1993. Col. Vol. Sci. Pap. ICCAT 42:377-380
AMON KOTHIAS, J., A. Hervé, F.X. Bard. 1996. Mise a jour des quantités de ”faux poissons” débarqués par les senneurs a Abidjan. Col. Vol. Sci. Pap. ICCAT 45:227-228
ANON. 1984. Report of the Juvenile Tropical Tuna Working Group. ICCAT, Col. Vol. Sci. Pap., Vol. XXI (1):1-180
ANON. 2008 Report of the 2008 ICCAT Yellowfin and Skipjack stock assessment meeting. Florianópolis, Brazil. July 21 to 29, 2008
BARD, F.X. and L. Antoine. 1986. Croissance du listao dans l'Atlantique Est. In: Symons P.E.K., P.M. Miyake and G.T. Sakagawa (Eds.). Proc. ICCAT conference on the international skipjack year program, pp 301-308 CAYRE, P. and F. Laloë. 1986. Relation poids-longueur du listao (Katsuwonus pelamis) de l’Océan Atlantique. In: Proceedings of the ICCAT conference on the international skipjack year program. Symons, P.E.K., Miyake, P.M. and Sakagawa, G.T. (eds.), p. 335-340
CAYRE, P. and H. Faruggio. 1986. Biologie de la reproduction du listao (Katsuwonus pelamis) de l’Océan Atlantique. In: Proceedings of the ICCAT conference on the international skipjack year program. Symons, P.E.K., Miyake, P.M. and Sakagawa, G.T. (eds.), p. 252-272
CHASSOT, E., M.J. Amandè, P. Chavance, R. Pianet, R.G. Dédo. In press. Some preliminary results on tuna discards and bycatch in the French purse seine fishery of the eastern Atlantic Ocean. SCRS/2008/117
CHEN, Y., P.A. Breen and N.L. Andrew. 2000. Impacts of outliers and mis-specification of priors on Bayesian fisheries-stock assessment. Can. J. Fish. Aquat. Sci 57: 2293-2305
CHEN, Y. and D. Fournier. 1999. Impacts of atypical data on Bayesian inference and robust Bayesian approach in fisheries. Can. J. Fish. Aquat. Sci. 56: 1525-1533
CHEN, Y., Y. Jiao and L. Chen. 2003. Developing robust frequentist and Bayesian fish stock assessment methods. Fish Fisher. 4:105-120
FONTENEAU, A. 1986. Etat des stocks de listao de l'Atlantique par analyse des cohortes, analyse de production par recrue et par le modèle global. In: Symons P.E.K., P.M. Miyake and G.T. Sakagawa (Eds.). Proc. ICCAT conference on the international skipjack year program, pp 208-233
FONTENEAU, A. and T. Diouf. 1994. An efficient way of bait-fishing for tunas recently developed in Senegal. Aquat. Liv. Res., 7: 139-151
FONTENEAU, A., D. Gaertner, V. Nordström. 1999. An overview of problems in the CPUE-abundance relationship for the tropical purse seine fisheries. Col. Vol. Sci. Pap. 49(3):259-276
FOURNIER, D. 1996. An introduction to AD Model Builder for use in nonlinear modeling and statistics. Otter Research, Nanaimo, British Columbia, Canada
FOURNIER, D.A., J. Hampton and J.R. Sibert. 1998. MULTIFAN-CL: a length-based, age-structured model for fisheries stock assessment, with application to South Pacific albacore, Thunnus alalunga. Can. J. Fish. Aquat Sci. 55: 2105-2116
FOX, W. 1970. An exponential surplus yield model for optimizing exploited fish populations Trans. Amer. Fish. Soc. 99: 80-88
GAERTNER, D., A. Delgado de Molina, J. Ariz, R. Pianet and J.-P. Hallier. 2008. Variability of the growth parameters of the skipjack tuna (Katsuwonus pelamis) among areas in the eastern Atlantic: analysis from tagging data within a meta-analysis approach. Aquat. Living Resour. 21(4):349-356
GAERTNER, D., P. Pallares. 2002. Efficacité des senneurs thoniers et efforts réels (ESTHER). Prog. n° 98/061. Union Européenne, DG “Fisheries” (DG XIV), Bruxelles (Belgique). Rapport scientifique, 187p
GASCUEL, D., A. Fonteneau, E. Foucher. 1993. Analyse de l'évolution des puissances de pêche par l'analyse des cohortes : application aux senneurs exploitant l'albacore (Thunnus albacares) dans l'Atlantique Est. Aquat. Living Resour. 6: 15-30
GRIEWANK, A. and G.F. Corliss. 1991. Automatic differentiation algorithms: theory, practice and application. SIAM, Philadelphia
HAMPTON, J. 2002. Stock assessment of skipjack tuna in the western and central Pacific Ocean. SCTB15 Working Paper
HILBORN, R. and C.J. Walters. 1992. Quantitative fisheries stock assessment. Choice, dynamics and uncertainty. Chapman and Hall, New York, USA
HOENIG, J.M., W.G. Warren and M. Stocker. 1994.
Bayesian and related approaches to fitting surplus
production models. Can. J. Fish. Aquat. Sci. 51:1823-1831
LALOE, F. 1989. Un modèle global avec quantité de biomasse inaccessible dépendant de la surface de pêche. Application aux données de la pêche d'alabacores (Thunnus albacares) de l'Atlantique Est. Aquat. Living Res. 2:231-239
LANGLEY, A., M. Ogura and J. Hampton. 2003. Stock assessment of skipjack tuna in the western and central Pacific Ocean SCTB16 Working Paper
LEBOURGES-DHAUSSY, A., E. Marchal, C. Menkès, G. Champalbert, and B. Biessy. 2000. Vinciguerria nimbaria (micronekton), environment and tuna: their relationships in the eastern tropical area. Oceanol. Acta 23: 515-528
LUDWIG, D. and C.J. Walters. 1985. Are age structured models appropriate for catch-effort data? Can. J. Fish. Aquat. Sci. 46:1066-1072
MAUNDER, M.N. 2000. Software review: AD Model Builder. AFSCUS 14(2): 10-14
MAUNDER, M.N. 2004. Population viability analysis based on combining Bayesian, integrated, and hierarchical analyses. Acta Oecolog. 85:85–94
MAURY, O. 2000. Multi-fleet non-equilibrium production models including stock surface to estimate catchability trends and fishery dynamics in a Bayesian context. Application to the skipjack tuna’s fishery (Katsuwonus pelamis) in the Atlantic Ocean. ICCAT meeting on assessment methods, Madrid 8-11/05/00. ICCAT SCRS/00/37
MAURY, O. 2001. PROCEAN: a production catch/effort analysis framework to estimate catchability trends and fishery dynamics in a Bayesian context. IOTC Proceedings, 4: 228-231
MAURY, O. 2002. Application of the PROCEAN model to the Indian Ocean yellowfin tuna (Thunnus albacares) fishery. IOTC Proceedings 5:361-367
MAURY, O. and E. Chassot. 2001. A simulation framework for testing the PROCEAN model and developing Bayesian priors. IOTC Proceedings 4:544-554
MAURY, O. and V. Nordström. 2002. Application of the PROCEAN model to the Indian Ocean yellowfin tuna (Thunnus albacares) fishery. IOTC working party on tropical tunas, Shanghai 3-11/06/2002
1
0
MCALLISTER, M.K. and T. Carruthers. 2007. 2007 stock assessment and projections for western Atlantic Bluefin tuna using a BSP and other SRA methodology. Coll. Vol. Sci. Pap. 62(4):1206-1270MCALLISTER, M.K., Pikitch, E.K. and E.A. Babcock. 2001. Using demographic methods to construct Bayesian priors for the intrinsic rate of increase in the Schaefer model and implications for stock rebuilding. Can. J. Fish. Aquat. Sci. 58:1871-1890
N’DA, K., R. Dédo, A. Hervé. 2007. Le débarquement des “faux thons” ou ”faux poissons” au port de pêche d'Abidjan : Phénomène en résurgence dans les données ICCAT en CÔte d’Ivoire. Col. Vol. Sci. Pap. ICCAT 60: 180-184
PELLA, J.J. and P.K. Tomlinson. 1969. A Generalized Stock Production Model. Bull. Inter. Am. Trop. Tuna. Com 13: 420-496
PIANET, R., V. Nordström, P. Dewals, A. Delgado de Molina, J. Ariz, R. Saralde, R.G. Dédo, Y. Diatta. In press. Statistiques de la pêcherie thonière européenne et assimilée durant la période 1991-2007. Col. Vol. Sci. Pap. ICCAT. SCRS/2008/124
RESTREPO, V. and P. de Bruyn. In press.
RIKHTER, V.A. and V.N. Efanov. 1976. On one of the approaches to estimation of natural mortality of fish populations. ICNAF Res. Doc. 76/VI/8:1-12
SCHAEFER, M.B. (1954). Some aspects of the dynamics of populations important for the management of the commercial marine fisheries. Bull. Inter-Amer. Trop. Tuna Com. 1: 27-56
SOTO, M., P. Pallarés, A. Delgado de Molina, D. Gaertner. In press. Standardized CPUE for juveniles yellowfin, skipjack and bigeye tuna from the european purse Seine fleet in the Atlantic ocean from 1991 to 2006. SCRS/2008/116
VILELA, M.J. and Castello, J.P. 1993 Dinamica poblacional del barrilete (Katsuwonus pelamis) explotado en la region sudeste-sur del Brasil en el periodo 1980-1986. Frente Maritimo, Montevideo, 14:111-124
WISE, J.P. 1986. The baitboat fishery for skipjack in the Gulf of Guinea, 1969-1982. Proc. ICCAT Intl. Skipjack Yr. Prog. 111-117
Table 1. Parameters and variables used in PROCEAN. NS = not shown
Notation Definition Origin Value Equation
B Biomass (t) Calculated Fig. 7 D1,D3
r Intrinsic growth rate (y-1) Estimated Table 7 D1
K Stock carrying capacity (t) Estimated Table 7 D1
m Shape parameter Fixed 1.2 D1
Y Catch for effort non documented fleets (t) Fixed NS D1
q Catchability Estimated Table 7 D2
E Fishing effort Fixed NS D2
F Fishing mortality Calculated NS D2-D3
C Catch (t) Calculated Fig. 3 D1,D3
Table 2. Deterministic process and observation equations in the PROCEAN model. i and t index fleet and year, respectively. Notations are given in Table 1.
Process equation
1 1 1 1 1 1 n = i t i, m t t t + t C + K B r + Y r + B = B D1 State moment t i, t i, t i, = q E F D2 Observation equation t t i, t i, = F B C D3Table 3. Parameters and variables used in the stochastic equations and likelihood components.
Notation Definition Equation
T Total number of years of observations L1
n Number of fishing fleets L1,L3-L4
C* Observed catch L1
C Predicted catch L1
σ Standard deviation of the observation error L1
γ Standard deviation of the carrying capacity process error L2
ti Initial year of observation for the fleet i L3
Ti Final year of observation for the fleet i L3
δi Standard deviation of the catchability process error for the fleet i L3
F Fishing mortality L4
p Proportion of data subject to atypical errors L4
e Parameter of the fat-tailed probability distribution L4
1
2
Table 4. Definitions to extend the deterministic model in Table 2 to a stochastic model. The generic notation Θrepresents the set of parameters to estimate. ~: distributed as; N: normal distribution; t-Dist: t-distribution function Model Notation
2
log ~ log Ci,t N Ci,t θ ,ζi S1
2
t t N K ,γ K ~ log 1 log S2
2
i t i, t i, N q ,δ q ~ log 1 log S3
2
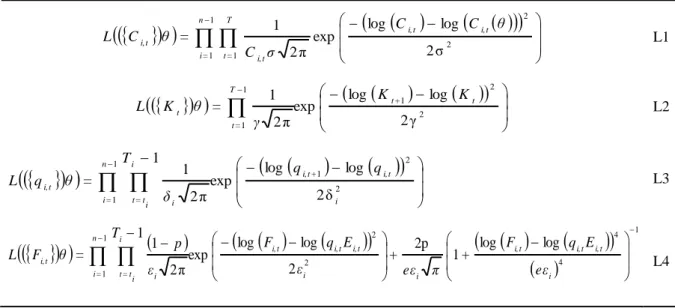
i t i, t i, 2 i t i, t i, t i, p N q E ,ε + p t Dist q E ,ε F ~ 1 log log log S4Table 5. Likelihood components of the PROCEAN model.
1 1 1 2 2 2 σ log log exp 2 π 1 n = i T = t t i, t i, t i, t i, θ C C ζ C = θ C L L1
2 2 1 1 1 2 γ log log exp 2 π 1 t+ t T = t t K K γ = θ K L L2
2 2 1 1 1 2 δ log log exp 1 2 π 1 i t i, + t i, n = i i i t = t i t i, q q T δ = θ q L L3
1 4 4 2 2 1 1 log log 1 2p 2 log log exp 1 2π 1
i t i, t i, t i, i i t i, t i, t i, n = i i i t = t i t i, eε E q F + π eε + ε E q F T ε p = θ F L L4Table 6. Life table analysis for the prior specification of the growth rate parameter r
Age Maturity Mortality (y-1) Survival Survivorship Length (cm) Weight (kg)
1 0 0.8 0.449 1.000 23.2 0.21 2 0.5 0.8 0.449 0.449 40.5 1.26 3 1 0.8 0.449 0.202 53.3 3.1 4 1 0.8 0.449 0.091 62.9 5.31 5 1 0.8 0.449 0.041 70.1 7.53 6 1 0.8 0.449 0.018 75.5 9.56 7 1 0.8 0.449 0.008 79.4 11.3 8 1 0.8 0.449 0.004 82.3 12.7 9 1 0.8 0.449 0.002 84.6 13.87 10 1 0.8 0.449 0.001 86.2 14.76
Table 7. Maximum posterior estimates (MPE) and coefficient of variation (CV) derived from the Hessian matrix in the base case scenario. BB = baitboats; PS = purse seiners; FAD = fishing aggregating device; SD = standard deviation.
Parameter Name MPE CV
log_B0 Log initial biomass (1969) 14.49 2%
r Intrinsic growth rate 1.17 23%
m Shape parameter 1.20 -
MSY Maximum sustainable yield 170,200 10%
FMSY Fishing mortality at MSY 0.19 23%
q SKJ-GHN-BB Catchability Ghanaian BB 0.0165 28%
q SKJ-CAN1-BB Catchability Spanish-Canarian BB 1980-91 0.0032 35%
q SKJ-CAN2-BB Catchability Spanish-Canarian BB 1992-06 0.0031 38%
q SKJ-POR-BB Catchability Portuguese-Azorean BB 0.0042 32%
q SKJ-EUDKR1-BB Catchability French-Senegalese BB 1969-83 0.0020 29%
q SKJ-EUDKR2-BB Catchability French-Senegalese BB 1984-06 0.0027 30%
q SKJ-EC-PS-FAD Catchability European PS using FAD 0.0337 29%
q SKJ-EUDKR-PS Catchability European PS targeting free schools 0.0023 30%
σ SKJ-GHN-BB SD catch Ghanaian BB 0.36 19%
σ SKJ-CAN1-BB SD catch Spanish-Canarian BB 1980-91 0.82 20%
σ SKJ-CAN2-BB SD catch Spanish-Canarian BB 1992-06 1 < 0.1%
σ SKJ-POR-BB SD catch Portuguese-Azorean BB 1 < 0.1%
σ SKJ-EUDKR1-BB SD catch French-Senegalese BB 1969-83 0.49 18%
σ SKJ-EUDKR2-BB SD catch French-Senegalese BB 1984-06 0.61 15%
σ SKJ-EC-PS-FAD SD catch European PS using FAD 0.24 18%
1
4
Table 8. Sensitivity analysis for the the MSY and FMSY maximum posterior estimates. SD = standard deviationm r B0/K K (t) MSY (t) FMSY (y
-1
)
Base case run 1.2 1.169 0.9 2,173,530 170,200 0.19
Sensitivity to m 1.7 1.174 0.9 740,914 167,798 0.48
Sensitivity to B0/K 1.2 1.114 0.7 2,265,240 169,055 0.19
Sensitivity to the r prior (SD = 0.7) 1.2 1.161 0.9 2,189,580 170,195 0.19
Sensitivity to the MSY prior (MeanMSY = 130,000 t)
1.2 1.164 0.9 2,020,000 157,090 0.19
Sensitivity to the MSY prior (MeanMSY = 170,000 t)
1.2 1.172 0.9 2,360,080 185,192 0.2
Catchability process error 1.2 1.23 0.9 1,863,115 153,986 0.21
Catchability process error (6 fleets) 1.2 1.64 0.9 1,384,920 152,256 0.27
Figure captions
Fig. 1. Catch (t) of the eastern Atlantic skipjack tuna fishery during 1950-2006 and standardized index of catch per unit of effort index during 1969-2006
Fig. 2. Histogram of prior distribution for the growth rate parameter r for skipjack obtained from demographic analysis
Fig. 3. Catch observed (circles) and predicted (solid line) for the 8 fishing fleets considered in the base case run. GHN.BB = Ghanaian baitboats; CAN.BB = Canarian baitboats; POR.BB = Portuguese-Azorean baitboats; EUDKR.BB = European and Senegalese baitboats; EC.PS.FAD = European purse seiners fishing on fishing aggregating devices; EUDKR.PS = European purse seiners fishing off Senegal
Fig. 4. Total catch observed (circles) and predicted (solid line) in the base case run
Fig. 5. Total catch observed (circles) and equilibrium production curve (thick solid line) estimated in the base case run
Fig. 6. Phase diagram representing the evolution of the annual fishing mortality relative to the fishing mortality at MSY (F/FMSY) as a function of the annual biomass relative to the biomass at MSY (B/BMSY
)
Fig. 7. Trajectory of the biomass relative to the initial year 1969 (B/B0). The shaded area indicates standard
deviation derived from the Hessian matrix
Fig. 8. Estimated trends in relative catchability modelled as a lognormal random walk process for (a) the Spanish-Canarian baitboat fishing fleet (CAN-BB) and (b) the European-Senegalese baitboat fishing fleet (EURDKR-BB)
1
6
Fig. 1. Catch (t) of the eastern Atlantic skipjack tuna fishery during 1950-2006 (histograms) and standardized index of catch per unit of effort (solid line with diamonds) during 1969-2006 (see text for details)Fig. 2. Histogram of prior distribution for the growth rate parameter r for skipjack obtained from demographic analysis and kernel density estimate (thick solid line) to illustrate the approximation of the histogram by a normal probability density function
1
8
Figure 3. Catch observed (circles) and predicted (solid line) for the 8 fishing fleets considered in the standard run. GHN.BB = Ghanaian baitboats; CAN.BB = Canarian baitboats; POR.BB = Portuguese-Azorean baitboats; EUDKR.BB = European and Senegalese baitboats; EC.PS.FAD = European purse seiners fishing on fishing aggregating devices; EUDKR.PS = European purse seiners fishing off Senegal2
0
Fig. 5. Total catch observed (circles) and equilibrium production curve (thick solid line) estimated in the base case runFig. 6. Phase diagram representing the evolution of the annual fishing mortality relative to the fishing mortality at MSY (F/FMSY) as a function of the annual biomass relative to the biomass at MSY (B/BMSY)
2
2
Fig. 7. Trajectory of the biomass relative to the initial year 1969 (B/B0). The shaded area indicates standardFig. 8. Estimated trends in relative catchability modelled as a lognormal random walk process for (a) the Spanish-Canarian baitboat fishing fleet (CAN-BB) and (b) the European-Senegalese baitboat fishing fleet (EURDKR-BB)