HAL Id: hal-00700116
https://hal.archives-ouvertes.fr/hal-00700116
Submitted on 22 May 2012
HAL is a multi-disciplinary open access
archive for the deposit and dissemination of
sci-entific research documents, whether they are
pub-lished or not. The documents may come from
teaching and research institutions in France or
abroad, or from public or private research centers.
L’archive ouverte pluridisciplinaire HAL, est
destinée au dépôt et à la diffusion de documents
scientifiques de niveau recherche, publiés ou non,
émanant des établissements d’enseignement et de
recherche français ou étrangers, des laboratoires
publics ou privés.
Crozet Basin during austral summer 1999.
Michel Fiala, B. Delille, Catherine-Marie Dubreuil, E. Kopcynska, Karine
Leblanc, J. Morvan, Bernard Queguiner, P. Cailliau, Pascal Conan, Rudolph
Corvaisier, et al.
To cite this version:
Michel Fiala, B. Delille, Catherine-Marie Dubreuil, E. Kopcynska, Karine Leblanc, et al.. Mesoscale
surface distribution of biogeochemical characteristics associated with a frontal system in the Crozet
Basin during austral summer 1999.. Marine Ecology Progress Series, Inter Research, 2003, 249,
pp.1-14. �10.3354/meps249001�. �hal-00700116�
INTRODUCTION
The Southern Ocean is characterized by the occur-rence of several permanent circumpolar frontal
sys-tems that form the eastward flowing Antarctic Circum-polar Current (ACC). The Subtropical Front (STF) rep-resents the northern border of the ACC. It separates the warm and saline subtropical waters from the cool
© Inter-Research 2003 · www.int-res.com *Email: mfiala@obs-banyuls.fr
Mesoscale surface distribution of biogeochemical
characteristics in the Crozet Basin frontal zones
(South Indian Ocean)
M. Fiala
1,*, B. Delille
2, C. Dubreuil
3, E. Kopczynska
4, K. Leblanc
3, J. Morvan
5,
B. Quéguiner
3, S. Blain
6, C. Cailliau
6, P. Conan
1, R. Corvaisier
6, M. Denis
3,
M. Frankignoulle
2, L. Oriol
1, S. Roy
31Laboratoire Arago, Université P & M Curie, UMR-CNRS 7621, 66651 Banyuls-sur-mer Cedex, France 2Unité d’Océanographie Chimique, Institut de Physique, Université de Liège, 4000 Sart Tilman, Belgium
3Laboratoire d’Océanographie et de Biogéochimie, Université de la Méditerranée, UMR-CNRS 6535, Parc Scientifique et
Technologique de Luminy, Case 901, 13288 Marseille Cedex 9, France
4Department of Antarctic Biology, Polish Academy of Sciences, Ustrzycka 10, 02141 Warszawa, Poland 5Ecole Normale Supérieure de Chimie de Rennes, Avenue du Général Leclerc, 35700 Rennes-Beaulieu, France 6Laboratoire des Sciences de l’Environnement Marin, Institut Universitaire Européen de la Mer, Université de Bretagne
Occidentale, UMR-CNRS 6539, 29280 Plouzané, France
ABSTRACT: A mesoscale study was conducted in January and February 1999 in the Crozet Basin frontal zones (43° 50’ to 45° 20’ S, 61° 00’ to 64° 30’ E) within the southernmost and easternmost con-vergence area of the Antarctic Circumpolar Current (ACC) and the Agulhas Return Current (ARC). Distribution of biogeochemical parameters was strongly linked to the merged Subtropical (STF) and Subantarctic (SAF) Fronts which mark the border between the cold and less saline subantarctic waters and the warm and more saline subtropical waters. This survey took place during a post-bloom period. Chlorophyll a concentrations were low throughout the study area ranging from 0.2 µg l–1in the Polar Frontal Zone (PFZ) to 0.4 µg l–1in the Subtropical Zone (STZ). Maximum chlorophyll a val-ues (0.8 µg l–1) associated with an increase in biogenic silica concentration (from 0.03 to 0.34 µM) and a diatom peak (1.2 ×10⁵cells l–1) were encountered in the northeastern part of the STF edge. Despite northwardly decreasing concentrations of nitrates from 14 µM in the PFZ to 6 µM in the STZ, they were not the main factor limiting phytoplankton growth. Low silicic acid (mean = 0.6 µM) could have limited diatom development in the PFZ and the STZ where diatom numbers were low. In STZ waters, where average diatom numbers were highest, various species of Nitzschia and Thalassiothrix were common, but Pseudonitzschia spp. were dominant. Throughout the survey area, pico- and nano-sized cells dominated the phytoplankton assemblage, and their number was the highest in the STZ. Cyanobacteria, only present in subtropical waters >12.5°C, were the major component of the picoplankton size-fraction. While dinoflagellate numbers were low in the Subantarctic Zone (SAZ), their abundance and species numbers increased in the STZ, where Oxytoxum laticeps became dom-inant and several further large-size species of Prorocentrum, Ceratium and Gymnodinium appeared in addition to those at the STF. The distribution of different biogeochemical parameters suggests that the Crozet Basin frontal region is a non-exporting system at the end of summer. During this post-bloom period, biological activity is low and phytoplankton growth severely limited. This is evidenced by the weak dependence of the partial pressure of carbon dioxide (pCO2) on biological activity and the importance of the air-sea exchange in maintaining pCO2close to saturation.
KEY WORDS: Frontal zones · Nutrients · Biogenic silica · Chlorophyll a · pCO2· Phytoplankton · Bacteria
and less saline subantarctic waters. Southwards, the Subantarctic Front (SAF) and the Polar Front (PF) mark the transition between subantarctic and Antarctic waters. The fronts mark the boundaries between dif-ferent zones of the ACC: the Subantarctic Zone (SAZ) between the STF and the SAF, and the Polar Frontal Zone (PFZ) between the SAF and PF (Nowlin & Klinck 1986). Although this structure is circumpolar, the posi-tion of the different fronts is determined by the spatial pattern of the wind field, bottom topography and sea-sonal variability (Deacon 1982, Gamberoni et al. 1982, Piola et al. 1987). The Crozet Basin shows a complex circulation pattern in contrast to other frontal regions of the ACC. Due to the northwards bend of the ACC across the Crozet Plateau, the SAF and STF are tightly coalesced and form a concentrated jet merging with the Agulhas Return Current (ARC) (Park et al. 1991, 1993).
The Southern Ocean is considered, together with the subarctic and equatorial Pacific Ocean, to be a high-nutrient, low-chlorophyll (HNLC) region. However, in
situ studies and satellite observations indicate higher
productivity and chlorophyll biomass in a variety of dis-parate regions. Phytoplankton blooms have been ob-served in the marginal ice zone (Smith & Nelson 1990, Sullivan et al. 1993), around islands (Perissinotto et al. 1992, 2000, Pakhomov & Froneman 1999, Blain et al. 2001) and along frontal zones (Laubscher et al. 1993, Bathmann et al. 1997). Fronts are regions of strong hor-izontal temperature and/or salinity gradients that may occur in lakes, rivers and oceans (Franks 1992). Phyto-plankton blooms are closely related to fronts in the oceans. Like other oceanic frontal regions, the Crozet Basin exhibits high levels of chlorophyll concentration during summer (Weeks & Shillington 1996, Metzl et al. 1991). The biomass enhancement is generally associated with low pCO2values (Metzl et al. 1999). This strong sink of atmospheric CO2, considered one of the most impor-tant in the Southern Ocean, may result from physical mechanisms and biological processes (Metzl et al. 1998). Previous studies have mainly focused on the PF (El-Sayed & Weber 1982, Fiala et al. 1998a,b, Hense et al. 2000). In contrast, little is known about the STF in spite of its importance as an efficient hydrodynamical bar-rier for various organisms (Clementson et al. 1998, Bradford-Grieve et al. 1999, Froneman et al. 1999). The STF is characterized by a sharp horizontal gradient in temperature and salinity which separates water masses of different physico-chemical properties. It exhibits dramatic changes in the diversity and distrib-ution of phytoplankton, zooplankton (Furuya et al. 1986, Froneman et al. 1995, Barange et al. 1998), fishes (Roberts 1980) and birds (Pakhomov & McQuaid 1996). The STF also exhibits biomass and production enhancements (Weeks & Shillington 1996, Gall &
Hawes 1999, Read et al. 2000). Because of its large cir-cumpolar extension, it is a major contributor to the global ocean production (Dower & Lucas 1993). Sev-eral factors could explain the biomass enhancement in the vicinity of fronts, including increased in situ pro-duction resulting from strong water stratification due to the mixing of the warm subtropical water with the cold subantarctic water (Laubscher et al. 1993, Brad-ford-Grieve et al. 1997) and a passive transport of cells (Van Ballegooyen et al. 1994). Biomass enhancement can also result from the formation of eddies that move across the STF transporting heat, salt and nutrients into the surrounding environment (Froneman et al. 1999, Read et al. 2000). The Crozet Basin frontal zone corresponds to one of the strongest eddy activity areas of the Southern Ocean. SeaWiFS images have revealed the omnipresence of isolated eddies each side of the Agulhas Front (AF) (Park et al. 2002).
The present study focused on the fine spatial distrib-ution of a large set of parameters in the surface waters of the Crozet Basin in an area crossed by the ACC and encompassing the transition from cold subantarctic to warm subtropical waters. Our purpose was to gain information about the influence of hydrological fronts on the distribution of the biogeochemical parameters and the phytoplankton community during late austral summer.
MATERIALS AND METHODS
Study area.A mesoscale study was conducted over 15 d (22 January to 5 February 1999) in the Crozet Basin frontal zone during the ‘Antares 4’ cruise on board the RV ‘Marion Dufresne 2’. The survey area lay within the southernmost and easternmost convergence zone of the ACC and the ARC. The investigated region was delimited by a fine grid bounded by a parallelo-gram of 1.5° latitude × 2° longitude (~200 × 200 km) between 43° 50’ and 45° 20’ S and between 61° 00’ and 64° 30’ E. The grid was composed of 9 SW-NE parallel transects separated by distances of ~20 km (see Fig. 1).
Sampling. Surface seawater was sampled from the ship’s continuous flow-through system (~7 m depth bow inlet) during the deployment of an undulating TowYo vehicle (Prieur & Sournia 1994). The vehicle was towed at ~4 knots and surface samples were col-lected along the grid from the flow-through system at regular intervals: 7.4 km for partial pressure of carbon dioxide (pCO2), nutrients concentration and flow cyto-metry measurements, 14.8 km for chlorophyll a (chl a) concentration and 29.6 km for optical microscopy cell counting.
Methods. Salinity and temperature were recorded at 7.4 km intervals using a Seabird thermosalinograph
and a Falmouth Scientific Instruments temperature sensor.
Nitrate and silicic acid were determined on board via a standard automated method (Tréguer & Le Corre 1975).
For particulate silica analysis, 1 l samples were fil-tered onto 0.6 µm Nuclepore polycarbonate filters. Fil-ters were then oven-dried (60°C) on board, stored in plastic petri dishes, and returned to the laboratory for further analysis. Biogenic silica (BSi) was measured by the hot NaOH digestion method of Paasche (1973) as modified by Nelson et al. (1989) (blanks: 0.006 ± 0.005 µm; precision: <±10% in the range 0 to 20 µm). After NaOH extraction, filters were assayed for litho-genic silica (LSi) by fluorhydric acid addition accord-ing to the method described by Ragueneau & Tréguer (1994) (blanks: 0.011 ± 0.006 µm; precision: <±10% in the range 0 to 20 µm).
pCO2 was measured using an equilibrator coupled to a non-dispersive infrared gas analyzer (Li-Cor, LI-6262). The equilibrator consists of a Plexiglas cylin-der (height: 80 cm; diameter: 10 cm) filled with marbles to increase the exchange surface area (Frankignoulle et al. 2001). Seawater runs (3 l min–1) from the top to the bottom of the equilibrator and air is pumped upward (3 l min–1). The temperature at the outlet of the equilibrator was monitored using a platinum resis-tance thermometer (Metrohm). pCO2values were cor-rected for the temperature difference between sea-water in situ and in the equilibrator using the algorithm proposed by Copin-Montégut (1988, 1989). The Li-Cor analyzer was calibrated once a day with 2 gas standards of 0 and 345.4 ppm, respectively.
Chl a concentrations were measured on board after filtration of 1 l seawater onto a 47 mm Whatman GF/F glass-fibre filter at a vacuum differential of < 20 cm Hg. Filters were ground manually in 100% acetone (water retention in the filter brought the final concentration to 90%) and extraction was carried out in the dark for 24 h at 5°C. The fluorescence of the acetone extract was measured on a Perkin Elmer MPF 66 spectro-fluorometer (Neveux & Panouse 1987).
For flow cytometry analysis, prefiltered samples (100 µm mesh-size net) were fixed with 2% para-formaldehyde (Trousselier et al. 1995) and frozen in liquid nitrogen until later analysis in the laboratory. Just before analysis, samples were rapidly thawed in a 30°C water bath and fluorescent beads of 1 or 10 µm diameter were added to normalize the flow cytometer setting and to provide a reference for concentration cal-culations. Samples were analysed using a Cytoron Ab-solute (Ortho Diagnostic Systems) flow cytometer, with a 488 nm air-cooled argon laser. Each cell was charac-terized by 5 optical parameters: forward-scatter (linked to cell size) and right-angle scatter (linked to cell
struc-ture) and red (> 620 nm), orange (565 to 592 nm) and green (515 to 530 nm) fluorescences. Counting varied by < 3.7% SD (n = 23) over a range of concentrations covering 1 order of magnitude. Data were collected and stored in list-mode with the Immunocount software (Ortho Diagnostic Systems). Analyses were run with the Winlist software (Verity Software House). The flow cytometric analysis was restricted to <10 µm phyto-planktonic cells. Heterotrophic bacteria were counted after staining. For this purpose, 1 ml of seawater was supplemented with 10 µl SybrGreen II (from the mol-ecular probes solution diluted 10×) and incubated for 10 min in the dark before analysis.
Aliquots of 100 ml seawater were sampled for taxo-nomic analysis and enumeration of phytoplankton communities. They were preserved with formalin (final concentration 0.4%) and stored in the dark at room temperature until laboratory analysis. Cells were counted using an Olympus inverted microscope according to procedures described by Utermöhl (1958). Due to sample preservation and optical resolution, the inverted microscope counting technique underesti-mates the pico-size species.
Statistical analysis.To determine the importance of hydrological features in structuring the planktonic community, we used 2 connected statistical methods. In a first step, ordination by principal components ana-lysis (PCA; Statgraphics Plus software) was used to define hydrographic regions based on similarities in temperature, salinity, pCO2and nutrients (nitrates and silicates). The values of the variables were standard-ised by subtracting their means and dividing by their standard deviations. In a second step, hierarchical cluster analysis in the space of the first principal com-ponents was used to gather hydrologically similar stations. The dissimilarity between clusters was calcu-lated using average values. The average distance was calculated from the distance between each point in a cluster and all other points in another cluster. Euclid-ean distances between values were measured.
RESULTS
Frontal structure within area investigated
The different front locations (Fig. 1) were deter-mined using temperature and salinity measurements from 200 m depth (Park et al. 2002). These fronts can be considered representative of the surface hydrologi-cal structure although some slight deviations occur (i.e. the more southwards direction of the SAF/STF in the eastern part of the survey area). A detailed description of the large-scale frontal circulation within the entire Crozet Basin during this cruise has been given by Park
et al. (2002), but can be summarized thus: at the entrance to the Crozet Basin at 50°E, the ACC and ARC merged to form a frontal system composed of the SAF, STF and AF. Moving eastwards the SAF and STF shifted southwards. They reconverged most strongly at 63° 30’ E, due to a sharp meandering northwards (Fig. 1). A number of mesoscale meanders and eddies were superimposed on the main basin circulation. Meanders show an irregular configuration, continually evolving with time. Cyclonic and anticyclonic eddies with a diameter of 150 to 200 km were present at reg-ular intervals of 300 to 500 km. The survey grid was bordered by the edge of 2 cyclonic eddies in its south-western and eastern corners and by the southern edge of an anticyclonic eddy to the north (Park et al. 2002). The northern part of the survey grid intercepted the AF, whereas its south-east domain encompassed the SAF and STF (Fig. 1). The fronts defined the boundaries between 3 relatively homogeneous zones: (1) the PFZ located southwards, between the SAF and PF; (2) the STZ located north of the STF and AF; (3) the SAZ which was reduced to a narrow band in the investigated re-gion due to the coalescence of the SAF and STF.
Surface temperature and salinity distributions
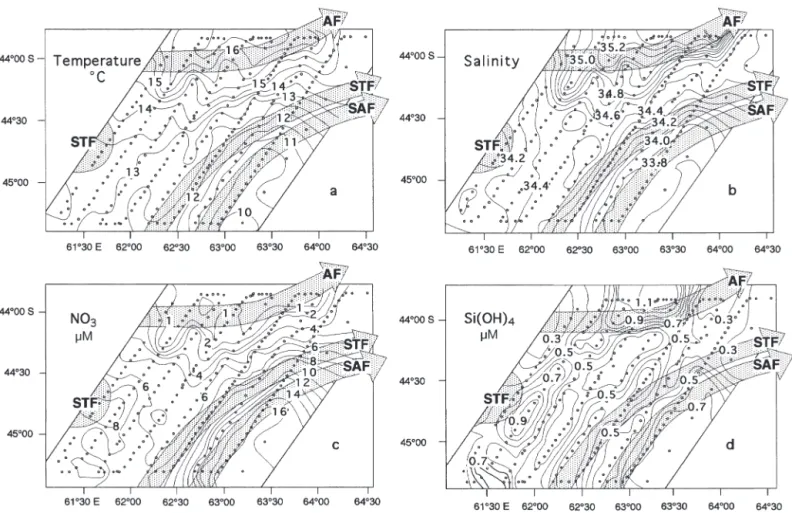
The SE-NW transition between the PFZ and STZ was marked by a sharp increase in temperature and salin-ity. Temperature (T) of the surface water increased from 10 to 16.5°C over a distance of 170 km and salin-ity (S) increased from 33.8 to 35.2 over the same dis-tance (Fig. 2a,b). The PFZ surface water, south of the SAF-STF, was colder (11.2°C) and less saline (< 33.8) than the northern subtropical surface water (12.5°C < T < 15.5°C and 34.3 < S < 35.0) (Table 1).
Surface nutrient distribution
Nitrate concentrations mirrored the frontal structure. They followed a negative gradient from south to north, decreasing sharply from 16 µM in the southeast to <1 µM in the northwest (Fig. 2c). Nitrate values were >16 µM in PFZ waters and between 2 and 9 µM in STZ waters. The frontal region (SAF/STF) exhibited con-centrations between 7 and 15 µM. North of the AF, sur-face waters showed nitrate depletion (Table 1).
In contrast, silicic acid concentrations did not show a well-defined gradient (Fig. 2d). The concentrations were low over the study area, with val-ues from 0.1 to 1.4 µM. South of the AF the surface concentrations were between 0.2 and 0.9 µM; north of the AF, the val-ues increased slightly, with a maximum of >1 µM.
Biogenic and lithogenic silica distribution
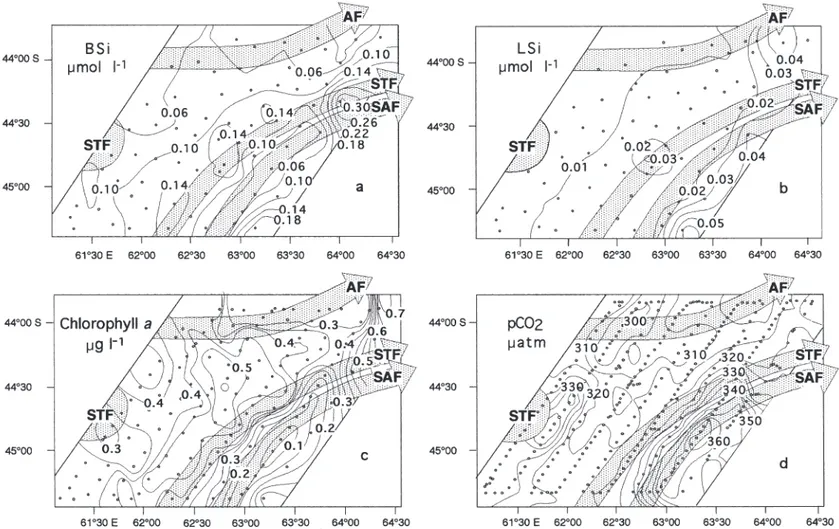
Biogenic silica (BSi) concentrations were low throughout the study area (Fig. 3a). BSi distribution more or less matched the position of the frontal struc-ture. Very low values (0.02 to 0.15 µmol l–1) were observed in the northern area that corresponded to the occurrence of warmer and more saline subtropical waters. In the subantarctic waters, BSi concentrations increased northwards from 0.02 to 0.34 µmol l–1(Table 1). The maxi-mum value was recorded at the eastern boundary of the study area in the coales-cent SAF and STF.
Lithogenic silica (LSi) was less abun-dant than BSi in the whole study area. The distribution pattern was also closely related to the frontal structure (Fig. 3b). LSi values were at the detection limit in
Fig. 1. Location of survey grid (9 parallel SW-NE transects) along which sur-face-water samples were collected during Cruise ‘Antares 4’ (January to Feb-ruary 1999). Positions of the different fronts are shown (identified at 200 m depth: Park et al. 2002). SAF: Subantarctic Front; STF: Subtropical front;
Fig. 2. Surface distribution of (a) temperature, (b) salinity, (c) nitrate concentration and (d) silicic acid concentration in the Crozet Basin during late summer. Here and in Figs. 3 to 5, sampling stations are indicated by dots, and abbreviations are as in Fig. 1;
shaded arrows indicate direction of fronts
Cluster Temperature Salinity Nitrate Si BSi LSi Chl a pCO2
(°C) (µM) (µM) (µmol l–1) (µmol l–1) (µg l–1) (µatm)
Cluster 1 (PFZ) Mean (± SD) 11.22 ± 0.59 33.80 ± 0.06 14.42 ± 1.90 0.58 ± 0.18 0.06 ± 0.07 0.02 ± 0.02 0.17 ± 0.08 351.5 ± 12.5 Range 9.87–12.6 33.76–33.98 10.4–17.1 0.2–0.9 0.02–0.30 0.00–0.07 0.08–0.37 329.0–371.3 Sample no. 39 39 39 39 13 13 22 39 Cluster 2 (STZ) Mean (± SD) 13.81 ± 0.85 34.38 ± 0.14 6.11 ± 1.66 0.55 ± 0.19 0.11 ± 0.05 0.02 ± 0.01 0.41 ± 0.10 318.7 ± 7.2 Range 12.51–15.85 34.09–34.70 2.4–9.4 0.2–1.0 0.03–0.34 0.00–0.06 0.2–0.81 305.3–344.7 Sample no. 170 170 170 170 44 44 90 170 Cluster 3 (AF) Mean (± SD) 16.47 ± 0.51 35.05 ± 0.16 0.62 ± 0.94 0.43 ± 0.19 0.07 ± 0.02 0.01 ± 0.01 0.38 ± 0.12 304.3 ± 3.8 Range 14.98–16.96 34.72–35.28 0.00–3.40 0.1–0.8 0.04–0.10 0.00–0.02 0.21–0.65 298.9–313.5 Sample no. 34 34 34 34 10 10 17 34
Cluster 4 (North AF)
Mean (± SD) 17.03 ± 0.39 ± 0.12 0.33 ± 0.45 1.12 ± 0.14 0.05 ± 0.01 0.10 ± 0.0 0.27 ± 0.05 310.9 ± 4.6
Range 16.06–17.37 35.00–35.43 0.0–1.7 0.9–1.4 0.05–0.06 0.00–0.01 0.19–0.34 303.3–315.7
Sample no. 18 18 18 18 4 4 8 18
Table 1. Temperature, salinity, nitrate, silicic acid (Si), biogenic silica (BSi), lithogenic silica (LSi), chlorophyll a (chl a) and pCO2in the 4 hydro-chemical clusters determined by statistical analysis. PFZ: Polar Frontal Zone; STZ: Subtropical Zone; AF: Agulhas Front
western subtropical waters. Higher values were observed in eastern subantarctic waters, but they did not exceed 0.07 µmol l–1(Table 1).
Chl a distribution
Like other parameters, chl a distribution was strongly influenced by the frontal structure. The southern waters of the PFZ were poor in chl a, with concentrations of < 0.4 µg l–1 (Fig. 3c). Northwards, the concentrations increased to 0.30–0.50 µg chl a l–1 in the central part of STZ (Table 1). At the northeast-ern border of the STF, chl a values reached a maxi-mum of 0.81 µg l–1.
pCO2distribution
Over the study area, surface-water pCO2 ranged from a slight supersaturation (> 360 µatm, the equi-librium value) to a net undersaturation (< 300 µatm).
The pCO2 distribution was closely related to the frontal structure (Fig. 3d). The merged SAF and STF marked the boundary between the saturated PFZ waters (360 to 370 µatm) and the northern undersaturated STZ waters (310 to 330 µatm). The lowest values (~300 µatm) were observed in the warm and saline subtropical waters (Table 1). In the southeastern part of the grid, the pCO2increase was associated with the STF mean-der covered by the grid.
Phytoplankton abundance determined by flow cytometry (FCM)
Three phytoplankton groups were identified by FCM analysis with regard to size and fluorescence cha-racteristics (Li 1994): picoeukaryotes (< 3 µm), nano-eukaryotes (3 to 10 µm) and cyanobacteria (<1.5 µm).
Picophytoplankton cells were present throughout the area investigated (Fig. 4a). The highest abundance was observed in the STZ (from 4 to 10 ×106cells l–1) with a peak (12 ×106cells l–1) in the southwestern part. At the
STF, picoplankton cells were also abundant (6 to 10 ×106 cells l–1) whereas the SAF and the PFZ had the lowest concentrations (Table 2). Surface distribution of nanophytoplankton (Fig. 4b) was similar to that of pi-coplankton except at the STF, where they did not exhibit any special feature. Nanoplankton abundance (up to 8 × 10⁶cells l–1) was about half that of picoplankton. In sub-antarctic waters, their abundance was low (~106cells l–1) (Table 2). Cyanobacteria were only present in subtropi-cal waters (>12.5°C) (Fig. 4c) and their peaks of abun-dance (2 to 5 ×10⁷cells l–1) occurred in the warmer wa-ters of the STZ and in the AF (Table 2). In the northern subtropical waters, cyanobacteria were dominant and contributed 68% to total phytoplankton numbers, whereas picoeukaryotes only contributed 23%. On the other hand, in the southern STZ, picoeukaryotes were dominant (61%). In the cold and low-salinity waters of the PFZ, picoplanktonic cells were dominant; they con-tributed 76% to total phytoplankton abundance com-pared to 15% for nanoplankton.
Heterotrophic bacteria
Heterotrophic bacteria concentrations ranged from 0.5 × 10⁶ to > 2 × 10⁶ cells ml–1 (Fig. 4d). They were present throughout the entire area investigated. However, their abundance remained at <1.2 × 10⁶ cells ml–1 south of the STF. Peak abundance (up to 2.5 × 10⁶ cells ml–1) was observed in the STZ (Table 2).
Microscope analysis of the phytoplankton community
Phytoplankton populations were composed, in order of decreasing abundance, of picoplankton (~2 µm) and naked nanoflagellates (3 to 20 µm), dinoflagellates (8 to 300 µm), coccolithophorids (5 to 30 µm) and diatoms (5 to 600 µm). Variations in cell numbers of the major phytoplankton groups in surface waters were
Fig. 4. Surface distribution of (a) picoplankton, (b) nanoplankton, (c) cyanobacteria and (d) total bacteria as measured by flow cytometry (FCM)
Fig. 5. Surface distribution of (a) picoplankton plus nanoflagellates (< 20 µm), (b) dinoflagellates, (c) coccolithophorids and (d) diatoms measured by microscope counting
Cluster Picoplankton Nanoplankton Pico- + nano- Dinoflagellates Cyano- Coccolitho- Diatoms Total (×106cells l–1) (×106cells l–1) flagellates (×103cells l–1) bacteria phorids (×103cells l–1) bacteria
(×106cells l–1) (×106cells l–1) (×103cells l–1) (×106cells l–1) Cluster 1 (PFZ) Mean (± SD) 3.7 ± 1.3 0.8 ± 0.3 0.25 ± 0.12 41.9 ± 29.8 0.6 ± 1.3 136.1 ± 62.6 19.9 ± 9.8 0.6 ± 0.3 Range 1.3–6.5 0.2–1.5 0.09–0.50 10.5–110.0 0.0–6.6 13.1–265.3 6.6–36.8 0.3–1.9 Sample no. 37 37 14 14 38 14 14 38 Cluster 2 (STZ) Mean (± SD) 4.9 ± 1.8 2.1 ± 1.2 0.8 ± 0.7 232.0 ± 119.4 4.8 ± 7.9 164.4 ± 73.0 69.3 ± 71.2 1.6 ± 0.4 Range 0.9 –12.0 0.6–6.3 0.04–5.01 50.2–519.3 0.0–52.1 59.6–337.3 2.1–399.5 0.7–0.3 Sample no. 162 162 40 40 161 40 40 137 Cluster 3 (AF) Mean (± SD) 3.1 ± 1.4 1.4 ± 0.3 1.0 ± 0.5 144.3 ± 81.2 11.7 ± 9.6 171.6 ± 77.7 30.5 ± 16.8 1.7 ± 0.4 range 1.4–7.5 0.7–2.2 0.27–1.93 37.9–307.7 0.4–40.3 97.3–307.7 15.5–68.4 0.7–2.7 Sample no. 32 32 10 10 34 10 10 25
Cluster 4 (North AF)
Mean (± SD) 3.1 ± 1.4 1.7 ± 2.1 1.70 ± 1.76 58.5 ± 1.6 23.5 ± 11.9 153.5 ± 77.8 22.9 ± 2.6 1.4 ± 0.2
Range 1.1–6.6 0.6–8.8 0.46–3.70 57.3–59.6 0–52 98.5–208.6 6.9–38.9 1.1–1.8
Sample no. 16 16 2 2 18 2 2 15
Table 2. Picoplankton, nanoplankton, pico- and nanoflagellates, dinoflagellates, cyanobacteria, coccolithophorids, diatoms and total bacteria in the 4 hydrochemical clusters determined by statistical analysis. Region abbreviations as in Table 1
generally associated with changes in the frontal struc-ture. A SE-NW positive gradient was observed in cell abundance. The combined groups of picoplankton plus naked nanoflagellates were remarkably similar south and north of the STF edge (cell numbers aver-aged < 2 × 10⁵ l–1: Fig. 5a). Maxima of 2.0 to 5.0 × 10⁶ cells l–1 were noted in the STZ and north of the AF (3.7 ×10⁶l–1) (Table 2). Nanoflagellates comprised prymnesiophytes, prasinophytes, cryptophytes and de-flagellated, oval-shaped monads.
In the STZ, dinoflagellates varied between 2.0 × 10⁵ l–1 and ca. 4.0 × 10⁵ l–1 (Table 2). Maxima were recorded near the western STF meander and the northern part of the STF, with concentrations of 5.2 and 4.3× 10⁵cells l–1, respectively (Fig. 5b). South of the SAF, dinoflagellate numbers were lower than 5 ×10⁴l–1 and consisted mainly of small gymnodinioid cells (<18 µm) and Prorocentrum spp. A great change occurred within the STF, where both cell abundance and species numbers increased. Oxytoxum laticeps, present in very small quantities south of the STF, became dominant (3 × 10⁴ l–1), and was followed by
O. variabile, O. parvum, several species of Gonyaulax,
larger (> 20 µm) Gyrodinium spp., Gymnodinium spp.,
Prorocentrum spp., and Ceratium fusus. In the STZ,
further new species appeared in addition to those at the STF: various Prorocentrum spp. (P. rostratum, P.
magnum, P. dentatum, P. triestinum), Ceratium linea-tum, C. pentagonum, and large (40 to 70 µm) Gymno-dinium/Gyrodinium spp. Oxytoxum laticeps and small
gymnodinioid cells also remained dominant in this area. Quite a similar dinoflagellate species composi-tion was observed at the AF.
Southwards in the PFZ, the numbers of coccol-ithophorids (max. 2.7 cells × 105l–1) were 4- to 5-fold greater than those of dinoflagellates. Northwards they
were generally outnumbered by dinoflagellates at the STF and in the STZ (Fig. 5c). Maxima (3.4 ×10⁵cells l–1) were observed in the central part of the STZ (Table 2).
Emiliania huxleyi was the dominant species throughout
the entire area of the study. Other frequently found spe-cies, with numbers increasing in the STZ, included
Gephyrocapsa sp., Dactylethra sp., Halopappus sp.,
whereas species such as Syracosphaera sp. and
Calyp-trosphaera sp. were common north of the STF.
Diatoms were the least abundant group in the area investigated (Fig. 5d). Average cell numbers ranged between 2 ×10⁴l–1in the PFZ to 7 ×10⁴l–1in the STZ (Table 2). The highest cell numbers (8 to 12 ×104l–1) were found in the central STZ, with a maximum of 1.2×10⁵l–1north of the STF edge. Another peak was encountered within the STF (4 × 10⁵ l–1). Within the AF, cell numbers were lower (average 3.0 × 10⁴ l–1). Diatoms were represented mainly by a few species of
Pseudonitzschia (e.g. P. turgidula, P. heimii, P. deli-catissima) which reached a peak in subtropical waters.
Various species of Nitzschia (N. longissima, N.
closte-rium, N. bicapitata) and Thalassiothrix spp. were also
common in the STZ.
During the survey, Phaeocystis antarctica was only observed in a few samples from the northern SAF–STF edge, with highest counts of 6 ×10⁴l–1north of the STF (data not shown).
Statistical analysis
PCA was used to determine the influence of physical and chemical parameters (temperature, salinity, nitrates, silicic acid and pCO2) on phytoplankton community dis-tribution in the study area. Two principal components were extracted which account for 95.0% of the variabil-ity in the original data. The first principal component (PC1) accounts for 73.6% of the variance and gives pos-itive weighting to nitrates and pCO2, and negative weighting to salinity and temperature (Fig. 6). The sec-ond principal component (PC2) accounts for 21.4% of the variance and gives general positive weights to all para-meters, with the highest weight to silicates.
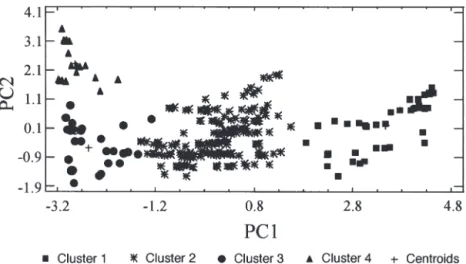
A hierarchical cluster analysis applied with the 2 first principal components as variables distinguished 4 clusters. Clusters 1, 2 and 3 are well separated along the PC1 axis, and PC2 allows the discrimination between Clusters 3 and 4. (Fig. 7). The correspondence between clusters and hydrological structures clearly appears in Fig. 8. Cluster 1 regroups stations located in the PFZ; Cluster 2 is occupied by stations located in the STZ; Cluster 3 gathers stations located in the AF region. Cluster 4, located north of the AF, is charac-terized by the highest concentrations of silicates (1 to 1.4 µM).
Fig. 6. Principal components analysis: plots of component weights
DISCUSSION
One major point of interest in the investigated area is that it covers the zone in which 3 oceanic fronts (SAF, STF and AF) converge. It therefore encompasses large gradients of temperature (10.0 to 16.5°C) and salinity (33.6 to 35.2) over a short distance (~170 km) in the northwards transition from subantarctic to subtropical waters. Statistical analysis confirms that physicochem-ical parameters were determinant in the distinction of 2 main regions, the southern PFZ and the northern STZ separated by a merged frontal system.
In the PFZ (Cluster 1) chl a concentrations were low (< 0.3 µg l–1) despite the presence of large amounts of nitrate (>15 µM). However, low concentrations of
sili-cic acid were detected (0.7 µM). This sit-uation is typical of the PFZ waters dur-ing late summer (Dafner & Mordasova 1994, Fiala et al. 1998a, Kopczynska et al. 2001). Particulate biogenic silica con-centration in the surface waters was low and never exceeded 0.2 µmol l–1, reflect-ing a weak diatom contribution to phyto-plankton biomass. Data collected during the same cruise (Leblanc et al. 2002) suggested that the BSi accumulation could be the result of a bloom preceding the cruise period and/or an allochtonous input by lateral advection. Phytoplank-ton cell numbers were low and pico-plankton was dominant, a general fea-ture observed in different seasons in the Southern Ocean (Fiala et al. 2002). Picoplankton, nanoflagellates and coc-colithophorids exceeded dinoflagellates and diatoms in numbers. This is consis-tent with data recorded during late sum-mer to the south of Africa in the northern part of the PFZ (Kopczynska et al. 1986). In the PFZ, where temperature and salinity were comparatively low, pCO2 was close to equilibrium (~360 µatm). As phytoplankton biomass was low and the upper mixed layer was shallow (Sed-wick et al. 2002), pCO2was weakly in-fluenced by biological activity or by a CO2 supply from deep water. Therefore, it was the air–sea CO2 exchange, enhanced by strong winds encountered in the region, that played an important role in pCO2 dynamics by maintaining pCO2close to saturation.
Field experiments conducted during the cruise (Blain et al. 2002, Sedwick et al. 2002) indicated that dissolved iron availability was the primary limiting factor to nitrate drawdown and phytoplankton growth in the PFZ. On the other hand, low silicic acid availability exerted a secondary limitation on the diatom growth rate. Recent studies have shown that iron and/or silicate are limit-ing phytoplankton growth in different regions of the Southern Ocean (Sedwick et al. 1999, Boyd & Law 2001, Hutchins et al. 2001).
The confluence of the SAF and STF reduced the SAZ to a very narrow band. The general trend of the merg-ing SAF/STF front was southwest to northeast. The convergent front marked the transition between warm subtropical waters and cold subantarctic waters. A drastic drop in the nitrate values from southeast to northwest within the STF and in the STZ was
ob-Fig. 8. Clustering of sample stations derived from statistical analysis Fig. 7. Two-dimensional scatterplot of the clustered observations (261 sampled stations) versus the 2 variables: first principal component (PC1) and second
served, and suggested an active nutrient uptake by the preceding phytoplankton bloom reported about a month earlier from SeaWiFS images (Park et al. 2002). In the STZ surface waters, chl a concentrations in-creased slightly (< 0.4 µg l–1), but remained lower than those observed during other seasons (Weeks & Shillington 1996, Bradford-Grieve et al. 1997). Despite low concentrations, nitrates were not the main factor limiting primary production. As in the PFZ waters, dis-solved iron availability associated with low orthosilicic acid concentrations limited phytoplankton growth (Sed-wick et al. 2002). Low BSi concentrations reflected the low contribution of diatoms to phytoplankton biomass. Pico- and nano-size cells dominated the phytoplankton assemblage. Their distribution was patchy and the maximum counts (measured by flow cytometry analy-sis) of pico- and nanoplankton cells were 107and 5 × 10⁶ cells l–1, respectively. Dominance of the small phytoplankton size fractions in the subtropical waters was also observed by Bradford-Grieve et al. (1997), Fouilland et al. (1999) and Froneman et al. (2001). Cyanobacteria dominated the pico-size fraction. Their distribution appeared to be mainly controlled by tem-perature, as they grew preferentially in warm (>15°C) water masses where they constituted the dominant population. This is consistent with observations of Murphy & Haugen (1985), who reported that de-creases in cyanobacteria abundance correlate with decreasing temperature in the North Atlantic Ocean. The cyanobacteria abundance observed in the STZ was of the same order of magnitude as that reported for the North Atlantic (Murphy & Haugen 1985, Veld-huis et al. 1993). The absence of prochlorophytes at the latitudes sampled was consistent with observations showing their disappearance at latitudes > 43° S (Fouil-land et al. 1999). The STF is the scene of a dramatic northwards increase in cell quantities and species number of dinoflagellates. This change is probably attributable to an increase in water temperature which promotes the development of warm-water dinoflagel-late species. Chl a concentrations were generally low within the STZ, but they increased to a maximum of 0.8 µg l–1at the northeast border of the STF where the AF and the STF/SAF were in close proximity. This value, although high, was lower than values observed by Weeks & Shillington (1996) and Read et al. (2000) in the Southwest Indian Ocean frontal region. The chl a peak is attributable to the development of diatoms and cyanobacteria. Peak chl a concentration and cell abun-dance were most probably due to the presence of a cyclonic eddy located northeast of the study grid which had recently detached from the SAF, as revealed by SeaWiFS images (Park et al. 2002). These images also showed that chl a concentrations were higher in the eddy edge than in the eddy core. This is consistent
with previous studies conducted in the STF south of Africa (Dower & Lucas 1993, Froneman et al. 1999).
Phytoplankton assemblages found in the Crozet Basin show similarities with regard to major groups and species composition to phytoplankton communi-ties observed in late summer in the subantarctic region south of Africa (Kopczynska et al. 1986) and south of Australia (Kopczynska et al. 2001). In the present study and the 2 previous studies of Kopczynska et al. (1986, 2001), nanoflagellates and dinoflagellates increased both in cell densities and species numbers north of the PF towards the STZ. Diatoms were the least abundant group. Representatives of the genus Pseudonitzschia, dominant among diatoms in the Crozet Basin, have been previously reported to be typical north of the PF (Hasle 1969, Steyaert 1973, Kopczynska et al. 1986). Dinoflagellates were dominated everywhere by the nano-sized (< 20 µm) genera Gymnodinium,
Gyro-dinium and Prorocentrum. The highest differences in
the species composition of this group were observed between the STZ of the Indian Ocean and south of Australia, and are attributable to the larger micro-sized (> 20 µm) species (Kopczynska et al. 2001). Also common to the present study and previous studies (Kopczynska et al. 1986, McKenzie & Cox 1991, Kopczynska et al. 2001) is the observation that several species of diatoms (e.g. Nitzschia bicapitata, N.
sub-pacifica, Thalassiothrix delicatula) and dinoflagellates (Ceratium pentagonum, C. lineatum, Oxytoxum spp.)
were only encountered north of the PF. The rich flora of dinoflagellates and coccolithophorids found in the present study is typical of warm waters of the South Indian Ocean (Taylor 1976, Heimdal 1997).
Summer bacterial abundances (0.5 to 2.5 ×10⁶cells ml–1) observed in the Crozet Basin were in a range of those (1.2 to 2 ×10⁶cells ml–1) reported by Lochte et al. (1997) for the Atlantic sector of the PF during spring 1990, but were larger than abundances (0.2 to 0.5 × 10⁶ cells ml–1) recorded near the Kerguelen Islands during the ‘Antares 3’ cruise in October 1995 (M. Denis unpubl. data). Such differences could result from an uncoupling or time-lag between phytoplankton and bacterioplankton development. In line with this expla-nation, Billen & Becquevort (1991) observed, in Prydz Bay and the Weddell Sea, a time-lag of about 15 to 30 d between the maxima of phytoplankton and bacterial biomasses. Similarly, bacterial numbers reached maxi-mum values approximately 1 mo after blooms of
Phaeo-cystis pouchetii in Antarctic coastal waters (Gibson et
al. 1990, Davidson & Marchant 1992).
Such an uncoupling can be explained in several ways, either by extremely low exudation of dissolved organic carbon, by phytoplankton, by low bacterial uptake or conversion of organic material, by repression of the bacterial metabolism due to low temperatures, or
by high grazing pressure (Lochte et al. 1997). The pre-sent study was conducted during a post-bloom period in a region where phytoplankton growth is stimulated by the frontal hydrodynamics. This would explain the fact that bacterial concentrations were larger than those observed south of the Kerguelen Islands in Janu-ary to March 1994 (0.1 to 0.6 ×10⁶ cells ml–1, Talbot 1995) or south of Tasmania in February 1999 (2 to 4×10⁵cell ml–1, Hall & Safi 2001).
The surface signatures of the fronts are clearly dis-tinguishable in the pattern of pCO2. The distribution of pCO2 mirrored remarkably the meso-scale salinity distribution rather than temperature distribution. This was expected because in the PF area, cold and warm core eddy-like features show up more clearly in salin-ity than in temperature, as the latter is modified by atmospheric heat exchanges (Read et al. 2000). During the cruise, this phenomenon was likely to have been enhanced as a consequence of the narrowness of the frontal band. Furthermore, atmospheric heat exchange influences the pCO2through the effect of temperature on thermodynamic equilibrium constants of the car-bonate system. Taking into account the overall distrib-ution of pCO2 during the cruise, atmospheric heat exchange enhanced the gradients of pCO2 at the fronts. As the northern warm and CO2-undersaturated waters approached the fronts, they tended to cool with a concomitant decrease in pCO2. On the other hand, the southern cold and slightly supersaturated waters tended to warm up and, conversely, pCO2increased in the vicinity of the fronts. The large northwards drop in pCO2is linked to the overall positive S-N gradient of chl a. However, at the mesoscale, no significant drops in pCO2were associated with the chl a maximum.
Furthermore, in the northeastern part of the survey area, the lowest pCO2 values were associated with both a minimum in nutrients concentration and a maxi-mum in bacteria abundance, while chl a did not exhibit significant changes. The minimum concentration of nutrients and maximum number of bacteria were prob-ably the consequence of a development of strong pri-mary production prior to the cruise that led to the pCO2 minimum. Thereafter, the distribution of pCO2 gener-ally appears to have reflected the impact of the bloom period preceding the cruise, indicating that the signa-ture of the CO2system distribution bloom remained for several weeks to months.
From the distribution of different biogeochemical parameters, the Crozet Basin frontal region appears to be a non-exporting system at the end of summer. This conclusion is particularly supported by the low contri-bution of large cells as well as the low contricontri-bution of siliceous organisms to the total phytoplankton. Biolog-ical activity was very low at that time of the year, as evidenced by the stronger dependence of pCO2 on
hydrological structures. These results are also con-firmed by the low primary production rates measured during the cruise (Leblanc et al. 2002). The present study period (January–February) marked the end of a productive period in that area, phytoplankton produc-tion being hindered by a combinaproduc-tion of limiting re-sources including iron and silicic acid (Sedwick et al. 2002). Our results compare very well with the situation observed in the same season in the same sub-systems in the Australian sector, where phytoplankton were dominated by non-siliceous organisms (Kopczynska et al. 2001) and exhibited the same kind of limitation by iron and silicic acid (Sedwick et al. 1999, Quéguiner 2001).
Acknowledgements. This work is a French contribution to the
SO-JGOFS program. It was supported by the French Polar Institute (IPEV) and the INSU-CNRS. This research was partly financed by the Polonium Program of scientific cooper-ation between Poland and France. It was also partly con-ducted under grants A4/DD/B14 and EV/12/7E within the Scientific Research on the Antarctic supported by the Belgian Office for Scientific, Technical and Cultural Affairs. We thank the captain, officers and crew of RV ‘Marion Dufresne 2’ and B. Ollivier for outstanding on board support. Special thanks to G. Grégori for stimulating discussions, Y. H. Park for con-structive comments and C. Bangy for her help in running the flow cytometer. The comments of 2 anonymous reviewers greatly assisted in improving this manuscript.
LITERATURE CITED
Barange M, Pakhomov EA, Perissinotto R, Froneman PW, Verheye HM, Taunton-Clark J, Lucas MI (1998) Pelagic community structure of the Subtropical Convergence region south of Africa and in the mid-Atlantic Ocean. Deep-Sea Res Part I 45:1663–1687
Bathmann UV, Scharek R, Klaas C, Dubischar CD, Smetacek V (1997) Spring development of phytoplankton biomass and composition in major water masses of the Atlantic sec-tor of the Southern Ocean. Deep-Sea Res Part II 44:51–67 Billen G, Becquevort S (1991) Phytoplankton-bacteria rela-tionship in the Antarctic marine ecosystem. Polar Res 10: 245–253
Blain S, Tréguer P, Belviso S, Bucciarelli E and 8 others (2001) A biogeochemical study of the island mass effect in the context of the iron hypothesis: Kerguelen Islands, South-ern Ocean. Deep-Sea Res Part I 48:163–187
Blain S, Sedwick PN, Griffiths FB, Quéguiner B, Bucciarelli E, Fiala M, Pondaven P, Tréguer P (2002) Quantification of algal iron requirements in the Subantarctic Southern Ocean (Indian sector). Deep-Sea Res Part II 49:3255–3273 Boyd PW, Law CS (2001) The Southern Ocean Iron Release Experiment (SOIREE) — introduction and summary. Deep-Sea Res Part II 48:2425–2438
Bradford-Grieve JM, Chang FH, Gall M, Pickmere S, Richards F (1997) Size-fractionated phytoplankton stand-ing stocks and primary production durstand-ing austral winter and spring 1993 in the Subtropical Convergence region near New Zealand. NZ J Mar Freshw Res 31:201–224 Bradford-Grieve JM, Boyd PW, Chang FH, Chiswell S and 5
in the Subtropical Front region east of New Zealand in austral winter and spring 1993. J Plankton Res 21:405–428 Clementson LA, Parslow JS, Griffiths FB, Lyne VD and 6 oth-ers (1998) Controls on phytoplankton production in the Australasian sector of the subtropical convergence. Deep-Sea Res Part I 45:1627–1661
Copin-Montégut C (1988) A new formula for the effect of tem-perature on the partial pressure of carbon dioxide in sea-water. Mar Chem 25:29–37
Copin-Montégut C (1989) A new formula for the effect of tem-perature on the partial pressure of carbon dioxide in sea-water: Corrigendum. Mar Chem 27:143–144
Dafner EV, Mordasova NV (1994) Influence of biotic factors on the hydrochemical structure of surface water in the Polar Frontal Zone of the Atlantic Antarctic. Mar Chem 45: 137–148
Davidson AT, Marchant HJ (1992) Protist abundance and car-bon concentration during a Phaeocystis-dominated bloom at an Antarctic coastal site. Polar Biol 12:387–395 Deacon GER (1982) Physical and biological zonation in the
Southern Ocean. Deep-Sea Res 29:1–15
Dower KM, Lucas MI (1993) Photosynthesis-irradiance rela-tionship and production associated with a warm-core ring shed from the Agulhas Retroflection south of Africa. Mar Ecol Prog Ser 95:141–154
El-Sayed SZ, Weber LH (1982) Spatial and temporal varia-tions in phytoplankton biomass and primary productivity in the southwest Atlantic and Scotia Sea. Polar Biol 1: 83–90
Fiala M, Kopczynska EE, Jeandel C, Oriol L, Vetion G (1998a) Seasonal and interannual variability of size-fractionated phytoplankton biomass and community structure at sta-tion Kerfix, off the Kerguelen Islands, Antarctica. J Plank-ton Res 20:1341–1356
Fiala M, Semeneh M, Oriol L (1998b) Size-fractionated phyto-plankton biomass and species composition in the Indian sector of the Southern Ocean during austral summer. J Mar Syst 17:179–194
Fiala M, Machado MC, Oriol L (2002) Phytoplankton distribu-tion in the Indian sector of the Southern Ocean during spring. Deep-Sea Res Part II 49:1867–1880
Fouilland E, Descolas-Gros C, Courties C, Pons V (1999) Au-totrophic carbon assimilation and biomass from size-frac-tionated phytoplankton in the surface waters across the sub-tropical frontal zone (Indian Ocean). Polar Biol 21:90–96 Frankignoulle M, Borges A, Biondo R (2001) A new design of
equilibrator to monitor carbon dioxide in highly dynamic and turbid environments. Water Res 35:1344–1347 Franks PJS (1992) Phytoplankton blooms at fronts: patterns,
scales, and physical forcing mechanisms. Rev Aquat Sci 6: 121–137
Froneman PW, McQuaid CD, Perissinotto R (1995) Biogeo-graphic structure of microphytoplankton assemblages of the south Atlantic and Southern Ocean during austral summer. J Plankton Res 17:1791–1802
Froneman PW, McQuaid CD, Laubscher RK (1999) Size-frac-tionated primary production studies in the vicinity of the Subtropical Front and an adjacent warm-core eddy south of Africa in austral winter. J Plankton Res 21:2019–2035 Froneman PW, Laubscher RK, McQuaid CD (2001) Size-fractionated primary production in the south Atlantic and Atlantic sectors of the Southern Ocean. J Plankton Res 23: 611–622
Furuya K, Hasumoto H, Nakai T, Nemoto T (1986) Phyto-plankton in the Subtropical Convergence during the aus-tral summer: community structure and growth activity. Deep-Sea Res 33:621–630
Gall M, Hawes I (1999) Predicting rates of primary production in the vicinity of the Subtropical Convergence east of New Zealand. NZ J Mar Freshw Res 33:443–455
Gamberoni L, Geronimi J, Jeanin PF, Murail JF (1982) Study of frontal zones in the Crozet-Kerguelen region. Oceanol Acta 6:289–299
Gibson JAE, Garrick RC, Burton HR (1990) Seasonal fluctua-tion of bacterial numbers near the Antarctic continent. Proc Natl Inst Polar Res (NIPR) Symp Polar Biol 3:16–22 Hall JA, Safi K (2001) The impact of in situ Fe fertilisation on the microbial food web in the Southern Ocean. Deep-Sea Res Part II 48:2591–2613
Hasle GR (1969) An analysis of the phytoplankton of the Pacific Southern Ocean; abundance, composition and distribution during the Bratteg Exp. 1947–48. Hvalråd Skr 52:1–168 Heimdal BR (1997) Modern coccolithophorids. In: Tomas CR
(ed) Identifying marine phytoplankton, Academic Press, San Diego, p 731–831
Hense I, Bathmann UV, Timmermann R (2000) Plankton dynamics in frontal systems of the Southern Ocean. J Mar Syst 27:235–252
Hutchins DA, Sedwick PN, DiTullio GR, Boyd PW, Quéguiner B, Griffiths FB, Crossley AC (2001) Control of phytoplankton growth by iron and silicic acid availability in the Sub-antarctic Southern Ocean: experimental results from the SAZ project. J Geophys Res 106:31559–31572
Kopczynska EE, Weber LH, El-Sayed SZ (1986) Phytoplank-ton species composition and abundance in the Indian sector of the Antarctic Ocean. Polar Biol 6:161–169 Kopczynska EE, Dehairs F, Elskens M, Wright S (2001)
Phyto-plankton and microzooPhyto-plankton variability between the Subtropical and Polar Fronts south of Australia: thriving under regenerative and new production in late summer. J Geophys Res 106:31597–31610
Laubscher, RK, Perissinotto R, McQuaid CD (1993) Phyto-plankton production and biomass at frontal zones in the Atlantic sector of the Southern Ocean. Polar Biol 13: 471–481
Leblanc K, Quéguiner B, Fiala M, Blain S, Morvan J, Cor-vaisier R (2002) Particulate biogenic silica and carbon pro-duction rates and particulate matter distribution in the Indian sector of the Subantarctic Ocean. Deep-Sea Res Part II 49:3189–3206
Li WKW (1994) Primary production of prochlorophytes, cyanobacteria, and eukaryotic ultraphytoplankton: mea-surements from flow cytometric sorting. Limnol Oceanogr 39:169–175
Lochte K, Bjørnsen PK, Giesenhagen H, Weber A (1997) Bac-terial standing stock and production and their relation to phytoplankton in the Southern Ocean. Deep-Sea Res Part II 44:321–340
McKenzie CH, Cox ER (1991) Spatial and seasonal changes in the species composition of armoured dinoflagellates in the Southwestern Atlantic Ocean. Polar Biol 11:139–144 Metzl N, Beauverger C, Brunet C, Goyet C, Poisson A (1991)
Surface water carbon dioxide in the southwest Indian sec-tor of the Southern Ocean: a highly variable CO2source/ sink region in summer. Mar Chem 34:85–95
Metzl N, Louanchi F, Poisson A (1998) Seasonal and interan-nual variations of the sea surface carbon dioxide in the subtropical Indian Ocean. Mar Chem 60:131–146 Metzl N, Tilbrook B, Poisson A (1999) The annual fCO2cycle
and the air-sea CO2 flux in the sub-Antarctic Ocean. Tellus 51B:849–861
Murphy LS, Haugen EM (1985) The distribution and abun-dance of phototrophic ultraplankton in the North Atlantic. Limnol Oceanogr 30:47–58
Nelson DM, Smith WO, Muench RD, Gordon LI, Sullivan CW, Husby DM (1989) Particulate matter and nutrient distribu-tions in the ice-edge zone during late summer. Deep-Sea Res 36:191–209
Neveux J, Panouse M (1987) Spectrofluorometric determina-tion of chlorophylls and pheophytins. Arch Hydrobiol 109: 567–581
Nowlin WD Jr, Klinck JM (1986) The physics of the Antarctic Circumpolar Current. Rev Geophys 24:469–491
Paasche E (1973) Silicon and the ecology of marine plankton diatoms. I. Thalassiosira pseudonana (Cyclotella nana) grown in a chemostat with the silicate as limiting nutrient. Mar Biol 19:117–126
Pakhomov EA, Froneman PW (1999) The Prince Edward Islands pelagic ecosystem, south Indian Ocean: a review of achievements, 1976–1990. J Mar Syst 18:355–367 Pakhomov EA, McQuaid CD (1996) Distribution of surface zooplankton and seabirds across the Southern Ocean. Polar Biol 16:271–286
Park YH, Gamberoni L, Charriaud E (1991) Frontal structure and transport of the Antarctic Circumpolar Current in the South Indian sector, 40–80° E. Mar Chem 35:45–62 Park YH, Gamberoni L, Charriaud E (1993) Frontal structure,
water masses and circulation in the Crozet Basin. J Geo-phys Res 98:12361–12385
Park YH, Pollard RT, Read JF, Leboucher V (2002) A quasi-synoptic view of the frontal circulation in the Crozet basin during the ‘Antares-4’ cruise. Deep-Sea Res Part II 49: 1823–1842
Perissinotto R, Laubscher RK, McQuaid CD (1992) Marine pro-ductivity enhancement around Bouvet and the South Sand-wich Islands (Southern Ocean). Mar Ecol Prog Ser 88:41–53 Perissinotto R, Lutjeharms JRE, Ballegooyen van RC (2000) Biological-physical interactions and pelagic productivity at the Prince Edward Islands, Southern Ocean. J Mar Syst 24:327–341
Piola AR, Figueroa HA, Bianchi AA (1987) Some aspects of the surface circulation south of 20° S revealed by First Global GARP Experiment drifters. J Geophys Res 92: 5101–5114
Prieur L, Sournia A (1994) Processes and fluxes in the geostrophic Almeria-Oran front. J Mar Syst 5:187–203 Quéguiner B (2001) Biogenic silica production in the
Aus-tralian sector of the Sub-Antarctic Zone of the Southern Ocean in late summer 1998. J Geophys Res 106: 31627–31637
Ragueneau O, Tréguer P (1994) Determination of biogenic silica in coastal waters: applicability and limits of the alka-line digestion method. Mar Chem 45:43–51
Read JF, Lucas MI, Holley SE, Pollard RT (2000)
Phytoplank-ton, nutrients and hydrography in the frontal zone be-tween the Southwest Indian Subtropical gyre and the Southern Ocean. Deep-Sea Res Part I 47:2341–2368 Roberts PE (1980) Surface distribution of albacore tuna,
Thunnus alalunga Bonaterre, in relation to the
Subtropi-cal Convergence Zone east of New Zealand. NZ J Mar Freshw Res 14:373–380
Sedwick PN, Ditullio GR, Hutchins DA, Boyd PW, Griffiths FB, Crossley AC, Trull TW, Quéguiner B (1999) Limitation of algal production by iron and silicic acid deficiency in the Australian Subantarctic region. Geophys Res Lett 26: 2865–2868
Sedwick PN, Blain S, Quéguiner B, Griffiths FB, Fiala M, Bucciarelli E, Denis M (2002) Chemical limitation on phytoplankton growth in the Crozet Basin, Subantarctic Southern Ocean. Deep-Sea Res Part II 49:3327–3349 Smith WO Jr, Nelson DN (1990) Phytoplankton growth and
new production in the Weddell Sea marginal ice zone in the austral spring and autumn. Limnol Oceanogr 35: 809–821
Steyaert J (1973) Distribution of plankton diatoms along an African-Antarctic transect. Invest Pesq (Barc) 37:295–328 Sullivan CW, Arrigo KR, McClain CR, Comiso JC, Firestone J (1993) Distributions of phytoplankton blooms in the South-ern Ocean. Science 262:1382–1387
Talbot V (1995) Activité protéolytique et dynamique bactéri-enne en Océan Austral. Thesis, Université Aix-Marseille II Taylor FJR (1976) Dinoflagellates from the international
Indian Ocean expedition. Bibl Bot 132:1–234
Tréguer P, Le Corre P (1975) Manuel d’analyses des sels nutri-tifs dans l’eau de mer. Utilisation de l’AutoAnalyzer II. Document Université de Bretagne Occidentale, Brest Trousselier M, Courties C, Zettlemaier S (1995) Flow
cyto-metric analysis of coastal lagoon bacterioplankton and picoplankton: fixation and storage effects. Estuar Coast Shelf Sci 40:621–623
Utermöhl H (1958) Zur Vervollkommnung der quantitativen Phytoplankton-Methodik. Mitt Int Ver Theor Angew Limnol 9:1–38
Van Ballegooyen RC, Grundlingh Ml, Lutjeharms JRE (1994) Eddy fluxes of heat and salt from the southwest Indian Ocean into the southeast Atlantic Ocean: a case study. J Geophys Res 99:14053–14070
Veldhuis MJW, Kraay GW, Gieskes WWC (1993) Growth and fluorescence characteristics of ultraplankton on a north-south transect in the eastern North Atlantic. Deep-Sea Res Part II 40:609–626
Weeks SJ, Shillington FA (1996) Phytoplankton pigment distri-bution and frontal structure in the subtropical convergence region south of Africa. Deep-Sea Res Part I 43:739–768
Editorial responsibility: Otto Kinne (Editor), Oldendorf/Luhe, Germany
Submitted: February 4, 2002; Accepted: September 26, 2002 Proofs received from author(s): February 13, 2003