IMPLICATION DE LA RÉTENTION FORESTIÈRE EN AMÉNAGEMENT ÉCOSYSTÉMIQUE DANS LA CONCILIATION DES BESOINS ÉCOLOGIQUES
ET SOCIAUX
THÈSE
PRÉSENTÉE
COMME EXIGENCE PARTIELLE
DU DOCTORAT EN SCIENCES DE L'ENVIRONNEMENT
PAR
CYNTHIA PATRY
Avertissement
La diffusion de cette thèse se fait dans le respect des droits de son auteur, qui a signé le formulaire Autorisation de reproduire et de diffuser un travail de recherche de cycles supérieurs (SDU-522 - Rév.01-2006). Cette autorisation stipule que «conformément à l'article 11 du Règlement no 8 des études de cycles supérieurs, [l'auteur] concède à l'Université du Québec à Montréal une licence non exclusive d'utilisation et de publication de la totalité ou d'une partie importante de [son] travail de recherche pour des fins pédagogiques et non commerciales. Plus précisément, [l'auteur] autorise l'Université du Québec
à
Montréalà
reproduire, diffuser, prêter, distribuer ou vendre des copies de [son] travail de recherche à des fins non commerciales sur quelque support que ce soit, y compris l'Internet. Cette licence et cette autorisation n'entraînent pas une renonciation de [la] part [de l'auteur]à
[ses] droits moraux nià
[ses] droits de propriété intellectuelle. Sauf entente contraire, [l'auteur] conserve la liberté de diffuser et de commercialiser ou non ce travail dont [il] possède un exemplaire.»La présente thèse est le fruit d'un travail de collaboration entre mes directeur et co-directeur Christian Messier et Daniel Kneeshaw, ainsi que l'aide inestimable de mon comité de thèse incluant Stephen Wyatt et Isabelle Aubin. J'ai été en charge de 1 'élaboration des objectifs et hypothèses de recherche, de la planification des chapitres, de l'échantillonnage terrain, ainsi que de l'analyse des données et de la rédaction des articles. Mon comité de thèse a été à mes côtés à chaque étape pour discuter du contenu scientifique et des approches méthodologiques et analytiques à adopter. Je tiens à souligner que Frank Grenon ainsi que Stephen Wyatt ont participé aux discussions concernant la premier chapitre ainsi qu'à son amélioration. Pour le second chapitre Isabelle Aubin, Timo Kuuluvainen et Anneli Uotila ont grandement contribué au raffinement des idées, aux analyses statistiques, ainsi qu'à la relecture du manuscrit. En ce qui concerne le troisième chapitre Stephen Wyatt, ainsi que Nicolas Milot ont participé au brassage des idées, ainsi qu'à la relecture et aux corrections du manuscrit. Cette thèse est présentée sous la forme de trois articles scientifiques rédigés en anglais. Au moment du dépôt de cette thèse le premier chapitre est publié dans le Forestry Chronicle du mois de juillet/ août 2013, le second chapitre est en cours de préparation pour sa soumission à la revue Forest ecosystem and management et le troisième chapitre pour soumission à Forest Policy and Economies.
Je tiens tout d'abord à remercier chaleureusement Christian Messier, mon directeur, qui a cru en mon potentiel, en mes idées, en mon projet. Grâce à lui j'ai pu apporter une envergure internationale à mon projet et j'ai bénéficié de nombreuses opportunités fortes enrichissantes. Il a su rendre mon cheminement à travers le doctorat plaisant et humain. Merci également à Daniel Kneeshaw, mon codirecteur. J'ai grandement apprécié son dévouement envers ses étudiants. Je me suis sentie supportée, car il a été présent à toutes les étapes de ma thèse. Je ne pourrais non plus passer sous silence le grand dévouement d'Isabelle Aubin et de Stephen Wyatt, les deux autres membres de mon comité de thèse. Ils m'ont fourni une aide inestimable pour l'écriture de la thèse, notamment, la conception des chapitres. Merci de même aux co-auteurs des articles, Timo Kuuluvainen, Maija Saleman, Anneli Uotila, Frank Grenon et Nicolas Mi lot pour leurs commentaires des plus pertinents.
De plus, je suis très heureuse d'avoir été accueillie au sein du CEF où j'ai reçu une aide financière et technique précieuse. Merci particulièrement à Mélanie Desrochers, Daniel Lesieur, William Parson, Stéphane Daigle et Luc Lauzon. Merci également aux Produits Forestier Resolu, au METLA ainsi qu'à Irving qui m'ont beaucoup aidé dans la logistique de terrain. À 1' intérieur de ces institutions, merci à Luc Généreux, Mathieu Girard et Nadyre Beaulieu chez Produit Résolu, à Gaétan Pelletier et Pamela Poitras chez Irving et à Maija Salemaa au METLA. Je tiens à remercier tout particulièrement Ilona Lehtokoski qui a fait un énorme travail de recherche de sites avec son projet de maîtrise, ce qui m'a beaucoup facilité la tâche en plus de m'aider grandement lors de ma campagne d'échantillonnage au Canada et
en Finlande. Je suis très heureuse d'avoir également collaboré à son projet de
recherche.
Je remercie également le FQRNT, CRNSG, la fondation de I'UQAM et le CEF pour leur soutien financier. J'ai apprécié le grand dévouement de mes aides de terrain,
Mélanie Arsenault, Ilona Lehtokoski et Mathieu Messier. De même que ma famille adoptive finnoise Pirkko et Jorma Lehtokoski. Le volet social n'aurait pu être possible sans la collaboration d'Yves Grafteaux et Renée Tellier, respectivement coordonnateurs des tables GIRT du Témiscamingue et de la Mauricie. Un merci chaleureux à tous les participants à l'étude qui ont consacré du temps à remplir le questionnaire et qui rn' ont écrit des commentaires relativement à leurs préoccupations concernant la forêt. Je souhaite également remercier les professeurs et amis de l'Institut des Sciences de l'Environnement et du Centre d'étude de la forêt qui ont rendu agréable mon passage au sein de ces institutions, tout particulièrement les membres du labo Messier. Grâce à vous, j'ai apprécié chaque jour passé à l'université, car vous avez su me divertir et me réconforter, ainsi que m'aider à passer à travers de cette belle épreuve. Désolée Tia (ma chatte) et Kimo (mon chien) de ne pas avoir pris en considération vos suggestions (ex. : kklkkkkkkkklkjlh). Merci à René Cloutier pour la révision de mes textes et ses suggestions syntaxiques. Et finalement un merci du fond du coeur à mes parents et amis qui m'ont soutenue dans cette belle aventure.
"Nous changeons la terre plus rapidement que nous la comprenons"
(Vitousek et al., 1997)
ln culture, as weil as m nature, diversity holds the potential for innovation and opens he way for creative, non-linea solutions.
A V ANT PROPOS ... ii
REMERCIEMENTS ... iii
LISTE DES FIGURES ... viii
LISTE DES TABLEAUXIX RÉSUMÉ ... :x
INTRODUCTION ... 1
0.1 Objectif général ... 7
0.1.1 Question et sous-questions de recherche de la thèse : ... 7
CHAPITRE! INTENSIVE FORESTRY FILTERS NEGATIVELY PERSISTENCE UNDERSTORY VEGETATION TRAITS OVER TIME AND SPACE 1.2 Introduction ... Il 1.3 Mate rial and methods ... 13 1.3 .l Land use history ... 14 1.3.2 Site descriptions ... 15
1.3.4 Vegetation description ... 19 1.3.5 Statistical analysis ... 22
1.4 Results ... 24
1.4.1 Differences in environmental factors along the gradient of forest management intensity ... 24
1.4.2 Influence of the gradient of forest management intensity in Canada ... 25
1.4.3 Functional traits of understorey species on the red-list in Fin land ... 28
1.4.4 Comparison between intensive plantations in Canada and Finland ... 29
1.5 Discussion ... 31
1.5.1 Syndrome of colonisation traits in intensively managed forest. ... 31
1.5.2 Syndrome of persistence traits in red-list species, natural and extensively managed forest ... 34
vi
1.6 Conclusion ... 36
CHAPITRE Il HOW ST AKEHOLDERS PERCEIVE THE VALUE OF FOREST RETENTION AS A WA Y TO IMPROVE THE OPERA TIONALIZA TION OF ECOSYSTEM MANAGEMENT? ... 38 2.1 Introduction ... 40 2.2 Methods ... 43 2.3 Results ... 46 2.3 .1 Characterisation of respondents ... 46 2.3.2 Respondent values by groups ... 49
2.3.3 Perception of forest retention ... 56
2.4 Discussion ... 59
2.4.1 From theory to practice ... 59 2.4.2 Two conflicting visions of forest retention ... 61 2.4.3 Trust and constraints ... 65
2.5 Conclusion ... 66
CHAPITRE III FOREST ECOSYSTEM MANAGEMENT IN NORTH AMERICA: FROM TH EOR Y TO PRACTICE 3.1 Abstract. ... 69
3.3 Methods ... 75 3.4 Results ... : ... 78 3.4.1 ls END used as one of the conceptual bases to implement EM? ... 78
3.4.2 Since legacy elements are important for ecological processes and biodiversity, are the temporal and spatial scales proposed for retention elements appropriate to achieve EM objectives? ... 80
3.5 Discussion ... 88
3.5.1 Is END used as one ofthe conceptual bases to implement EM, and ifso, what strategies are used to de fine the natural forest of reference? ... 88
3.5.2 Since legacy elements are important for ecological processes and biodiversity, are the temporal and spatial scales proposed for retention elements appropriate to achieve EM objectives? ... 90
3.6 Conclusion ... 96
CONCLUSION 4.1 Découvertes ... 98
4.3 Propositions ... 104 APPENDICE A
GLOSAIRE DES CONCEPTS ... 109 APPENDICE B
QUESTIONNAIRE DU CHAPITRE 3 ... Ill RÉFÉRENCES ... 136
Figure Page 2.1 Source of information that stakeholders used to get informed about forest
management. The x axis re presents the percentage of positive responses for each group. A total of 400% means that ali respondents in each of the four groups used that type of information ... 48 2.2 Discriminant analysis of values for each stakeholer group. To understand values of
respondents we asked a set of 13 statements (letters A to M) derived from McFarlane and Boxall (20 1 0). ln figure 2.2, the arrows represent each statement. Scores of ali respondents for each statement were plotted in figure 2.2 (cube, cross, x and diamond). A discriminate analysis (ellipse of confidence 95%) allows us to visually compare the values of each group. Ellipse of confidence that touch are not significantly different, showing no significant difference between ENGO
representative and not industrial users and between not ENGO and researchers. lndustrial users were significantly different in their values compared to other groups. The cl oser a ellipse was to a statement or a set of statements meant that respondents
in that group agree with the statement and consequently had a higher score for that statement. ... 50 2.3 Leve! of dissatisfaction about the practices implemented in the last forest regime in
Que bec of 8 retention elements ... 57 2.4 Priori ti es of stakeholders about forest management.. ... 58 2.5 Obstacles to stakeholder priorities implementation ... 59 3.1 Theorical spatio-temporal objectives for retention elements. Visual representation of
the main spatiotemporal theoretical objectives with respect to the seven retention elements of concern and protected areas. The X-axis shows the three spatial scales and the Y -axis shows the two temporal scales that were considered. The order of elements within a sphere is irrelevant; it is the delimitation of a sphere that is important. ... 74
Tableau Page 1.1 Description and literature review of 9 vegetation traits and 1 ecological preference
positively ( +) or negatively ( -) associated with forest management intensity ... 21 1.2 Mean values of environmental factors, richness and Simpson 's diversity indices by
leve! of forest management intensity for two spatial scales. Statistical tests are performed between Canadian sites and th en between CI & FI... ... 25 1.3 Influence of the gradient of forest management intensity on the occurrence of
functional traits and traits related to the red-list emergent group ... 26 1.4 Species on the red-list of the Ministry of the environment in Finland threatened by
forest management. ... 29 2.1 Agreement of stakeholders on statements about forest values (from (McFarlane and
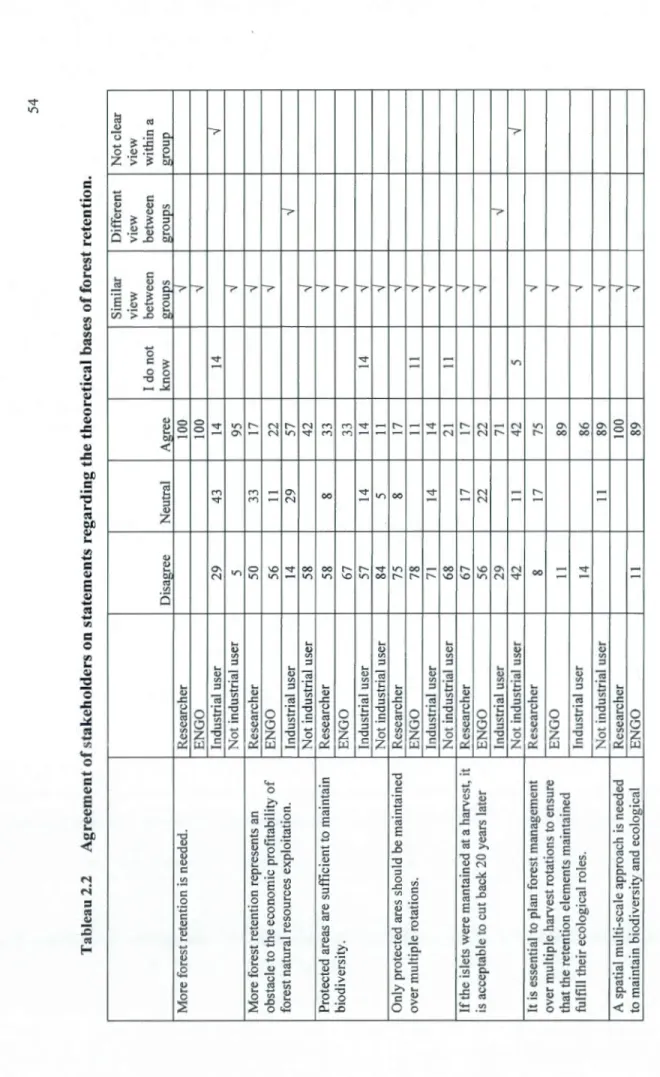
Boxall, 201 0) ... 52 2.2 Agreement of stakeholders on statements regarding the theoretical bases offorest
retention ... 54 3.1 Document title authors, location, land tenure and additional documents of the five
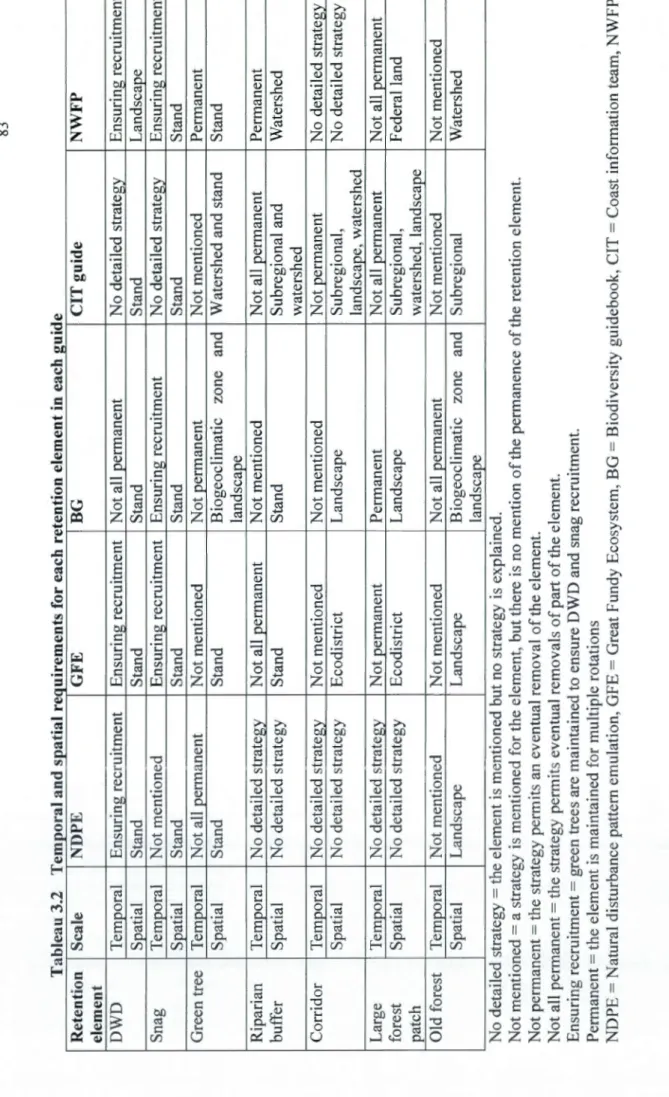
chosen guides relevant to the four regions ... 76 3.2 Temporal and spatial requirements for each retention element in each guide ... 83 3.3 Summary of strategies used by each guide for each retention element. ... 84 3.4 Principal weaknesses identified in five EM guides from North America, together
Un élément important et récurrent des stratégies d'aménagement écosystémique est la rétention d'une certaine proportion du couvert forestier, comme héritage biologique, et cela, autant au niveau du peuplement que du paysage, ainsi que dans le temps. Une rétention plus élevée (bois mort au sol, chicots, arbres vivants, corridors, bandes riveraines, larges ilots, vieilles forets et aires protégées) est-elle le gage d'une meilleure conciliation des besoins écologiques et sociaux?
Tout d'abord, quels sont les besoins écologiques reliés au maintien de la rétention forestière? L'impact d'un gradient d'intensification forestière sur la composition fonctionnelle (trait fonctionnel) de la strate herbacée a été testé. Une tendance vers la perte des traits de persistance (espèces sur la liste rouge) est observée avec l'intensification de l'aménagement. Cette perte est d'autant plus grande quand l'intensification s'effectue à différentes échelles spatiales et dans le temps.
Ensuite, un questionnaire internet a été administré à des parties prenantes de différentes affiliations (utilisateurs non industriel, les représentants des ONG en environnement et industriels) impliquées dans un processus décisionnel et des chercheurs en écologie afin de tester comment les parties prenantes acceptent les bases théoriques et priorisent la rétention forestière. Tous les répondants s'entendent sur les bases scientifiques (différentes échelles spatio-temporelles). Par contre, les industriels ont des préférences divergentes sur l'opérationnalisation de la rétention, adoptant le status quo vs une amélioration des pratiques actuelles.
Finalement, dans le but de mieux comprendre comment est opérationnalisé la rétention forestière, une revue des différentes stratégies de rétention forestière utilisées dans les guides en aménagement écosystémique à été réalisée. Le cadre théorique (émulation des perturbations naturelles ou non) et les échelles s patio-temporelles utilisées pour opérationaliser la rétention ont été comparés. Tous les guides, sauf le plus ancien, basent leur cadre théorique sur l'émulation des perturbations naturelles. Par contre, ils n'adaptent pas le contexte historique aux changements globaux actuels. L'aspect temporel de la rétention est très peu abordé, avec une grande majorité des stratégies sur le court terme. Une plus grande justification écologique ainsi qu'une meilleure interrelation des échelles spatiales seraient également souhaitable. Dans un contexte d'aménagement écosystémique, il est crucial d'arriver à proposer des stratégies de rétention concrètes qui sont pertinentes écologiquement et endossées par la majorité des groupes d'intérêts constituant les parties prenantes.
La délimitation entre les systèmes sociaux et écologiques est de plus en plus remise en cause avec l'augmentation de la population mondiale (Folke, 2006). L'humain est maintenant bien implanté dans la majorité des systèmes écologiques (Vitousek et al., 1997); en effet, il constitue dans bien des cas une espèce clé ("key species") dans la modification de l'environnement et ce, à plusieurs échelles spatiales (Zurlini et al., 2006). Plusieurs auteurs suggèrent de briser les frontières et d'aborder les problèmes environnementaux selon une approche plus intégratrice portant sur les socio-écosystèmes ou encore les systèmes socio-écologiques (SES) (Glaser el al., 2008).
Dans le socio-écosystème que constitue la forêt, il est maintenant reconnu que la création d'aires protégées est insuffisante pour assurer le maintien de la biodiversité forestière (Daily et Huang, 2001 ; Deal, 2001 ; Fischer el al., 2006 ; Helier et Zavaleta, 2009 ; Wiersma et Nudds, 2009) et satisfaire les multiples usagés de la forêt. Considérant que 92% des forêts mondiales sont hors réserve (F AO, 1999 cité dans (Lindenmayer et al., 2006)), une attention particulière doit être apportée à la matrice forestière aménagée qui devrait contribuer au maintien du plus grand nombre d'espèces (Folke et al., 1996; Lindenmayer et Franklin, 2002; Rayfield et al., 2008) et à l'harmonisation des usages. Depuis l'émergence de la foresterie industrielle, la matrice forestière a subi des changements majeurs en composition et structure qui menacent actuellement la survie des espèces les plus vulnérables (FAO, 1992). De façon générale, elle a été grandement simplifiée, menant entre autres à des forêts ayant une composition et une structure beaucoup plus homogènes à l'échelle du site (Puettmann et al., 2009) et à des proportions de vieilles forêts bien en dessous des seuils historiques (Cyr et al., 2009b ). Plusieurs études suggèrent que la perte des attributs des forêts anciennes, tels que le bois mort (Ehnstrom, 2001 ; Jonsson et al.,
2005), a un effet non négligeable sur la biodiversité et est parmi les enjeux les plus critiques en foresterie (Freedman et al., 1996 ; Gauthier et al., 2008a; Hanski, 2000; Noss, 1999 ; Whitman et Hagan, 2007). La connectivité du territoire a également grandement été modifée par rapport à la matrice forestière naturelle (Wedeles et Sleep, 2008). Dans certaines régions du monde, une restauration des écosystèmes forestiers est même nécessaire car on 'y retrouve pratiquement plus de forêts naturelles (Kuuluvainen, 2002).
Les problèmes issus du mode de gestion conventionnelle des ressources forestières ont mené à une perte de confiance de la patt du public envers les gestionnaires de la forêt (Shindler et al., 2002). Cette pression sociale grandissante a stimulé un changement de paradigme forestier, passant d'une exploitation basée sur le libre marché de la ressource ligneuse et la productivité des usines, vers le paradigme de l'exploitation durable des ressources forestières (Bengston, 1994 ; Kimmins, 2002).
Avec l'engouement pour Je développement durable des ressources, plusieurs concepts connexes gagnent actuellement en popularité, tels que l'aménagement écosystémique. Ce concept récent provient de la Conférence mondiale sur l'environnement humain à Stockholm de 1972 et de la Convention des Nations Unies sur Je droit de la mer de 1982 (FAO, 2003). Il a rapidement été repris en foresterie (Grumbine, 1994) et abondamment discuté depuis. Les définitions de 1 'aménagement écosystémique sont nombreuses. Toutefois, une revue de la littérature par Grumbine (1994) indique que dans l'atteinte du maintien de l'intégrité écologique, certains sous-objectifs sont récurrents, tels que: " (1) maintenir des populations viables in situ de 1 'ensemble des espèces indigènes; (2) représenter dans les aires protégées l'ensemble des types d'écosystèmes à travers leur aire de variabilité naturelle; (3) maintenir les processus évolutifs et écologiques (ex; perturbations naturelles); (4) aménager sur une période de temps suffisamment longue pour maintenir le potentiel
évolutif des espèces et des écosystèmes; et (5) accommoder les besoins humains et leur occupation du territoire à 1' intérieur de ces contraintes. "
Les forêts résiduelles, qui sont définies comme tout élément naturel retrouvé à une ou plusieurs échelles spatiales qui sera maintenu pour un certain temps dans la matrice forestière après une coupe ou une perturbation naturelle (incluant bois mort au sol, chicots, arbres vivants, corridors, bandes riveraines, larges ilots, vieilles forêts et aires protégées), se sont révélées être un élément central dans 1 'atteinte des objectifs soulevés par la gestion écosystémique. Elles jouent un rôle potentiellement crucial dans la résilience de ces écosystèmes après perturbation, contribuant avec le temps au maintien des attributs de forêts naturelles (Beese et al., 2003 ; Crête et al., 2004 ; Deans et al., 2003 ; Drapeau et lmbeau, 2006 ; Mitchell et Beese, 2002 ; Perron et al., 2008). Les seuils écologiques concernant la quantité, la disposition et la qualité des forêts résiduelles demeurent incertains (Lindenmayer et Franklin, 2002 ; Rosenvald et Lohmus, 2008).
Bien que les connaissances scientifiques soient encore partielles concernant l'impact de la rétention forestière sur la biodiversité et les fonctions des écosystèmes (Rosenvald et Lohmus, 2008), la majorité des études concluent qu'il faudrait faire davantage d'efforts afin de maintenir une portion plus importante de rétention forestière et ce, à plusieurs échelles temporelles et spatiales (Letres et al., 1999 ; Lindenmayer et Franklin, 2002). Les échelles spatiales sont souvent interdépendantes (Levin, 1992) car certains phénomènes
à
un échelle donnée d'pendent d c qui arrive à d'autres échelles sans toutefois être visible à toutes les échelles (Franklin,1993). Par exemple, trop longtemps la connectivité du territoire était assurée par une stratégie de rétention à l'échelle du peuplement, soit par le maintien de bandes riveraines. Les bandes riveraines risquent de ne pas satisfaire les besoins de connectivité aux échelles spatiales supérieures car leur répartition n'est pas nécessairement en fonction de lier les différentes parcelles de forêt. La temporalité de
la rétention est également très importante car la faune et la flore ont des besoins écologiques très variables. Des espèces habituées à des perturbations fréquentes ne nécessiteront pas la même continuité dans la rétention forestière que des espèces issues de milieux très stables (Armstrong et al., 2003 ; Hunter, 1999). Le principe de précaution (Matsuda, 2003) est de mise quand les besoins de continuité dans la rétention ne sont pas bien définis pour l'ensemble des espèces. Il est suggéré que l'analyse des patrons de distribution dans le temps et l'espace des éléments de rétention suite aux perturbations naturelles serait une manière prometteuse d'opérationnaliser la rétention forestière dans les limites de la variabilité naturelle des forêts (Armstrong et al., 2003).
Quoique la réduction de la rétention forestière dans le temps et l'espace risque d'affecter de nombreux taxons (Rosenvald et Lohmus, 2008), la présente étude propose d'évaluer l'impact des forêts résiduelles sur la dynamique végétale de so us-bois utilisant une approche par traits fonctionnels. Les études sur 1' impact des aménagements forestiers sur la strate de sous-bois sont souvent fragmentaires car elles se déroulent sur des échelles de temps et d'espace restreintes (Aiexandter et al., 2007 ; Beese et Bryant, 1999 ; Dovciak et al., 2006 ; Drever et Lertzman, 2003 ; Halpern, 2005 ; Macdonald et Fenniak, 2007 ; Rosenvald et Lohmus, 2008 ; Sullivan et Sullivan, 2001 ; Sullivan et al., 2008 ; Temesgen et al., 2006 ; Vanha-Majamaa et Jalonen, 2001). Peu évaluent l'impact sur une échelle de plus de 10 ans (Deal, 2001 ; Rose et Muir, 1997 ; Traut et Muir, 2000). De plus, l'influence du paysage sur ce taxon est peu documentée (Wilson et Puettmann, 2007). Généralement les recherches qui tentent d'évaluer l'impact des nouvelles pratiques forestières sur la biodiversité végétale se limitent à l'analyse de la richesse et de l'abondance, alors que les traits fonctionnels fournissent des informations complémentaires et cruciales sur le fonctionnement global de l'écosystème (Lavorel et Garnier, 2002 ; Naeem et al., 20 12). Les traits fonctionnels sont également utiles car ils permettent une comparaison de différents écosystèmes qui ont une composition en espèces
5
potentiellement différente, ma1s où les processus sont les mêmes (Bernhardt -Romermann et al., 2011).
L'aménagement du territoire à travers plusieurs échelles spatiales et temporelles est un idéal écologique qui est susceptible de poser plusieurs problèmes de nature humaine/sociale, tels que des problèmes de valeurs, de conception, de compréhension et d'opérationnalisation (Byron et al., 2011). En effet, le maintien de forêts résiduelles pose un problème de taille car cette action est en opposition avec le paradigme de la marchandisation de la forêt dans un contexte de libéralisme économique par le fait que le bois laissé représente des pertes financières et peut être perçu comme du gaspillage de la ressource ligneuse par certaines parties prenantes .
En aménagement écosystémique l'élaboration de stratégies passe de plus en plus par un long processus impliquant plusieurs acteurs du milieu forestier (Betts et Forbes, 2005 ; Coast Information Team, 2004 ; USDA et USD!, 1994). En effet, l'approche par parties prenantes ("stakeholder theory"), qui divise la prise de décision entre plusieurs acteurs du milieu (Freedman et McVea, 2001), est davantage favorisée en aménagement écosystémique que par le passé où les pouvoirs étaient concentrés au sein de 1' industrie forestière et des gouvernements (Chiasson et Leclerc, 20 13). Toutefois, en pratique certains groupes, tels que l'industrie forestière qui possède davantage de moyens, semblent encore dominer les débats (Houde et Sandberg, 2003). L'arrivée de nouveaux acteurs dans le processus décisionnel est susceptible d'améliorer la résilience du socio-écosystème, bien que ce ne soit pas systématiquement le cas. La justification étant que ceux-ci, en voulant défendre leurs idées et leurs intérêts, contribuent à enrichir le débat lorsque des perturbations surviennent, ce qui potentiellement va influencer positivement la capacité d'innovation et de renouvellement du système (Lebel et al., 2006). Certains chercheurs affirment que les décisions prises par voie de consensus et par une diversité d'acteurs locaux risquent d'être plus acceptées localement et durables dans
le temps, que des décisions prisent par des autorités centralisées (Brunson et al., 1992 ; Glasmeier et Farrigan, 2005).
Dans un monde où les parties prenantes ont de plus en plus de poids dans les décisions, il est capital de mieux comprendre comment ils comprennent les concepts scientifiques et intègrent la science dans leurs pratiques forestières. L'acceptabilité des nouvelles pratiques forestières doit être intégrée dans le processus de mise en œuvre de l'aménagement écosystémique. Cependant, cette question est moins fréquemment abordée dans la littérature (Brunson, 1996 ; Dekker et al., 2007 ; Slocombe, 1998) et plus difficilement intégrée dans la pratique (Butler et Koontz, 2005). Il est également important que les alternatives proposées par les parties prenantes, s'il en est, contribuent réellement aux enjeux écologiques qui ont motivé leur élaboration.
Le développement de concepts scientifiques, tels que l'aménagement écosystémique et la rétention forestière, ainsi que leur opérationnalisation représente tout un défi mais est essentiel à la bonne gestion de nos ressources naturelles (Harris, 20 12). L'implication d'un nombre accru de parties prenantes différentes dans le processus décisionnel issues par exemple d'affiliations ou de niveaux d'éducation différents, complexifie d'autant plus ce transfert de connaissances. Les concepts risquent de ne pas être compris par tous de la même manière, mais également les délais en vue de l'obtention de bénéfices découlant de l'opérationnalisation de ces concepts sont souvent mal compris (Harris, 20 12). Par x mple, le concept d'aménagement écosystémique a pris plusieurs années pour être compris et accepté par la majorité aux États-Unis (Bengston et al., 2001). Récemment certains scientifiques ont commencé à réclamer plus de "translational ecology", un terme qui signifie plus de transfert de la science vers les milieux pratiques. L'objectif étant que les praticiens (politiciens, fonctionnaires, industriels, etc.) soient à même d'intégrer à leurs prises de décision la meilleure science disponible (Schlesinger, 201 0).
7
Toutefois, pour réduire le fossé entre la science et la société il faut entre autres que les scientifiques s'impliquent dans la vie publique et utilisent d'autres moyens de communication (Bartonova, 20 12).
0.1 Objectif général
La présente thèse vise à mieux comprendre comment les connaissances scientifiques sont intégrées dans les pratiques de gestion. Les trois chapitres représentent chacun une des étapes menant à la mise en œuvre d'un concept théorique. La première étape consiste en la création des connaissances scientifiques suite à l'étude du système ciblé. La seconde étape comprend le processus décisionnel qui va agir comme filtre au niveau des connaissances disponibles pour, au final, ne retenir que les éléments qui satisferont aux priorités et valeurs des agents décisionnels. Et finalement, la dernière étape consiste en la création de mesures concrètes afin de mettre en œuvre le concept théorique, soit l'aménagement écosystémique, basé sur les décisions prises
à
la seconde étape. Puisque ce concept est très large et implique plusieurs facettes de l'aménagement, j'ai choisi de privilégier plus spécifiquement la rétention forestière. Une emphase particulière est portée sur l'efficacité des forêts résiduelles à maintenir à plusieurs échelles de temps et d'espace la résilience des socio-écosystèmes forestiers en assurant le maintien de la biodiversité et en favorisant l'acceptabilité des parties prenantes. D'où découle la question de ma recherche:0.1.1 Question et sous-questions de recherche de la thèse :
Comment la rétention forestière dans un contexte d'aménagement écosystémique contribue à concilier les besoins écologiques et sociaux?
1) Quels sont les besoins écologiques reliés à la rétention forestière? 2) Comment ces besoins sont compris et priorisés par les parties prenantes?
3) Comment la rétention forestière est mise en œuvre dans les stratégies
d'aménagement écosystémique?
Pour y répondre, trois sous-objectifs ont été élaborés : (1) analyser l'impact d'un gradient d'intensification de l'aménagement forestier (dans le temps et l'espace) sur la composition fonctionnelle de la strate de sous-bois ; (2) tester comment les parties prenantes impliquées dans un processus décisionnel acceptent les bases théoriques et priorisent la rétention forestière; et (3) faire la revue des différentes stratégies de rétention forestières utilisées dans les guides en aménagement écosystémique de la forêt tempérée en Amérique du Nord afin de déterminer si l'émulation des perturbations naturelles est une base scientifique dans les guides et si la rétention forestière est opérationnalisée à différentes échelles spatiales et temporelles. L'atteinte de ces objectifs permettra de mieux comprendre globalement comment la rétention forestière peut aider à la conciliation des besoins écologiques et sociaux lors de l'opérationnalisation du concept d'aménagement écosystémique. L'ordre des chapitres suit la logique expliquée plus haut concernant les étapes de la mise en œuvre d'un concept théorique, soit le développement des connaissances (chapitre 1 ), la prise en compte ou non de ces connaissances scientifiques (théorie) dans le processus décisionnel (chapitre 2) et finalement la création de stratégies concrètes d'opérationnalisation du concept (chapitre 3).
INTENSIVE FORESTRY FIL TERS NEGATIVEL Y PERSISTENCE UNDERSTORY VEGETATION TRAITS OVER TIME AND SPACE
Cynthia Patry,
Centre d'etude de la Foret, Departement des Sciences Biologiques, Universite du Quebec a Montreal, C.P. 8888, Suce. Centre-Ville, Montreal, Canada, H3C 3P8 patry.cynthia@courrier. ugam .ca
Daniel Kneeshaw
Centre d'etude de la Foret, Departement des Sciences Biologiques, Universite du Quebec a Montreal, C.P. 8888, Suce. Centre-Ville, Montreal, Canada, H3C 3P8. kneeshaw .dan ie l@ugam .ca
Isabelle Aubin
Service canadien des forêts, Centre de forestrie des rands Lacs, 1219 Queen St. East Sault Ste. Marie, Canada, P6A 2E5
Isabelle.Aubin@NRCan.gc.ca Timo.Kuuluvainen
University of Helsinki, Department of Forest Sciences
Faculty of Agriculture and Forestry, P.O.Box 27 (Latokartanonkaari 7), Finland, Fl-00014 Timo.Kuuluvainen@helsinki.fi
Anneli Uotila
Faculty of Forestry, University of Joensuu, P.O. Box Ill, FI-80 101 Joensuu, Finland. anneli.uotila@kolumbus.fi
Maija Salemaa
The Finnish Forest Research Institute, Vantaa, Finland, PO Box 18, FIN-01301 maija.salemaa@metla.fi
Christian Messier
Centre d'etude de la Foret, Departement des Sciences Biologiques, Universite du Quebec a Montreal, C.P. 8888, Suce. Centre-Ville, Montreal, Canada, H3C 3P8. messier.christian@uqam.ca
1.1 Abstract
Protected areas alone cannat maintain biodiversity. Therefore, it is necessary to create conditions appropriate for plants and wildlife in managed landscapes. We compared effects of different levels of historical forest management intensities at stand- and landscape-scales on functional responses of understorey plants. A gradient in intensity of forest management, spanning natural forests and extensively managed forests (naturally regenerated cuts) in Canada to intensively managed forests (plantations) in Canada and Fin land was analysed on the basis of functional traits of the understorey species present. Traits characteristic of red-listed Finnish understorey species were also used. Results showed strong trait filtering along a gradient of forest management intensity. In natural forests and extensively managed forests, where forest retention was high throughout time and space, persistence traits were maintained, i.e., perennial geophytes or chamaephytes with non-leafy stem foliage structure. At the opposite end of the gradient, in intensively managed plantations, where forest retention elements (i.e., dead wood and large forested patches) were reduced, filtering led to selection of species with colonisation traits, e.g., tall species with limited lateral extension. In Finnish plantations, the filter was stronger, with more colonisation traits being selected, e.g. graminoid therophytes dispersed by epizoochory. Jn both Canadian and Finnish plantations, depleted traits were the same as those on the Finnish red-list. These results show that intensive forestry conducted over a long period of time and over a broad landscape negatively affect understorey plant functional diversity as measured by functional traits.
1.2 Introduction
The historical extent and intensity of boreal forest exploitation has varied greatly geographically. Most European boreal forests have been exploited for centuries, leading to a modification in structure and composition. ln contrast, sorne boreal forests in Russia and North America still possess many characteristics of primary forests, due to their more recent history of colonisation and to less intensive forest industrialisation (Gustafsson et al., 201 0). The maintenance of retention elements, such as down woody debris (DWD) and patches of green trees, greatly depends on the degree to which forest management is intensified (Gustafsson et al., 2010). Old forests (> 150-years-old), which had been historically dominant in Finland (Kuuluvainen and Siitonen, 2013), were reduced by the 1800's to a third of the landscape area that they had formerly occupied and now have been practically eliminated (< 1% in Sweden) (Linder and Ostlund, 1998). Currently, most European boreal forests are young and even-aged (Kouki et al., 200 1 ). The same trend is occurring in the boreal forests of Canada, but to a lesser extent (Cyr et al., 2009a). Coarse woody debris (CWD), for examp1e, has been reduced by 90-98% of its historical levels in Fennoscandia (Siitonen, 2001) and by 30% in Canada (Pedlar et al., 2002). Forest management intensification has further resulted in a reduction of the hardwood component of the European boreal forest, particularly Eurasian aspen (Populus tremula L.) (Kouki et al., 2004). Consequently, many aspen-associated species are now threatened in Northern European countries (Kou ki et al., 2004 ). 1 n North America, the opposite trend is occurring, as pop1ar species have been increasing in abundance following forest harvesting (Carleton and Maclellan, 1994).
Such structural and compositional changes that are induced by intensive forest utilisation have adversely affected forest biodiversity (Hanski, 2000) and many forest processes (Bengtsson et al., 2000 ; Cardinal and Andrew, 2000). For examp1e, in intensively managed Finnish forests, 2247 species have been classified as threatened
and now appear on Finland's red-list. Of this list, about 31 herbaceous species are classified as being threatened by increased forest management practices (Rassi et al.,
201 0). However, this number varies greatly along the gradient of forest management
intensity (IUCN, 2012). To date, no threatened species that are associated with
Canada's less intensively managed boreal forest have been found on the IUCN Re d-List (IUCN, 2012)
A taxonomie approach has been traditionally used to evaluate the effects of
forest management intensification on biodiversity (Diaz and Cabido, 2001 ). At the
site-leve!, understorey species richness following management prescriptions can equal or exceed that of pre-management conditions, although the species pool is often
modified (Haeussler and Bergeron, 2004 ; Hasenauer and Kindermann, 2002 ;
Kembel et al., 2008 ; Newmaster et al., 2007 ; Peltzer et al., 2000). More recently,
the functional trait approach has been proposed as a method that complements the taxonomie approach, and which allows a more mechanistic understanding to be gained regarding the processes that are involved (Lavorel and Garnier, 2002 ; Naeem et al., 20 12). Further, the use of functional traits may provide advanced warning of
potential changes in a community prior to actual species !osses (Mouillot et al.,
20 12). For a given species pool within an ecos y stem, environmental pressures act as a
filter upon species and, consequently, the response of a given species will be
determined by its traits (Keddy, 1992). The use of a functional trait approach permits
different ecosystems with similar underlying processes, but potentially dissimilar species compositions to be compared (Aubin et al., 2007 ; Bernhardt-Romermann et al., 2011 ). Su ch an approach is th us ideally suited for a comparison of many sites across biogeoclimatically similar regions and continents such as the boreal regions of Western Europe and Canada. Y et, it is difficult to find natural forests in the boreal forest of western Europe; conversely, it is difficult to find stands and landscapes within the Canadian boreal forest that have been intensively managed for an extended period oftime (> 50 years).
The objective of this study was to compare the effects of an intensity gradient of forest management, as practiced in the boreal forest of Western Europe and Canada, on understorey vegetation functional trait composition at both the stand- and landscape-levels. We hypothesised that as forest management intensifies, traits that are related to processes such as dispersion and persistence will be filtered 1 differently, resulting in the creation of dissimilar syndromes2• A syndrome of colonisation traits should increase while a syndrome of persistence traits should decrease with the intensity of forest management (syndrome description, Table 1.1 ). Forest management intensity is determined by the amount of retention elements that are maintained through time, both at the stand and landscape scales, but also to other factors as site preparation and time between two rotations. To conduct this evaluation, three levels of forest management intensities were compared: high forest retention, which was maintained over time and space (natural forests and extensively managed forests in Canada); low forest retention, which was maintained at the stand-scale (intensively managed plantations in Canada that were surrounded by extensively managed forests); and low forest retention, which was maintained at both stand- and landscape-scales over time (intensively managed plantation landscapes in Fin land).
1.3 Material and methods
The effect of the management intensity gradient was tested in two steps. Because strong differences in functional traits between regions (Canada vs Finland) can mask important diffi r nees within a region, we fir t compared naturally
1 Trait filtering: "The process by which abiotic variables determine whether a species has the requisite traits to colonize, establish, and persist in a given environment " (Mouillot et al., 20 12)
2Syndrome: A set of functional traits selected by environmental conditions (LI oret et al.,2005)
regenerated forests following a natural disturbance in Canada (CN = Canada natural) with naturally regenerated forests following a partial or total eut (CE
=
Canada extensive), and intensively managed plantations, which had been thinned once or twice (Cl= Canada
intensive). In extensive management, no further management activities were performed after cutting and a greater amount of retention was left (Gustafsson et al., 201 0). ln general, eut rotations under intensive management were shorter than in extensively managed forest, i.e., about 70-80 years (Forestry Development Centre TAPIO, 2006)To extend the gradient of forest management intensity, a second analysis was performed that included Finnish boreal forest, which had a longer and more intensive land use history. This forest served as a proxy for the extreme end of the forest-use intensity gradient. We compared intensive plantations in Canada (Cl) with intensive plantations in Finland (FI
=
Finland intensive). The comparison between naturally regenerated forests in Canada and Finland was not possible, given the lack of naturally regenerated forests in the latter. Results were then compared with the traits of species found on the Finnish Red-List to evaluate whether they included the same traits that were lost in intensively managed forests.1.3.1 Land use history
The boreal forest of Quebec (Canada) underwent colonisation primarily for logging rather than for agricultural purposes (Blanchet, 201 0). Prior to the 19th century, agricultural expansion that was attributable to European colonisation of Canada occurred mainly in the southern regions of the country. lndustrial exploitation of the Canadian boreal forest only began in the early 20th century, with a focus on spruce harvesting for pulp and paper (Bouthillier, 2011). During this period, the forest industry began to expand further north into the boreal forest, primarily along the major river networks (Blanchet, 2010 ; Boucher et al., 2009). Y et, forest management in the boreal forest of Canada never reached the intensive leve! that had
been attained in the Fennoscandian countries. Large-scale intensively management of mono-culture plantations in Canada is only practiced on private lands in New Brunswick (Park and Wilson, 2007). For the past 30 years, the main forestry activity in Canada's boreal forest has been clear-cut logging of natural forest (Bock and Yan Rees, 2002), which may or may not be followed by planting. ln 2010, only 3% of Canada's forest was planted (Commonwealth Forestry Association, 201 0).
In contrast, much of the Scandinavian boreal forest has been intensively utilised for many centuries (Kuuluvainen and Siitonen, 20 13). In Norway, Sweden and Finland, the forest was greatly modified before the beginning of the forest industry. For example, slash and burn agriculture in Finland had a large-scale effect on forests that began as early as the 1
ih
century and which continued until the 191h century. During this period, tar production using Scots pine (Pinus sylvestris L.) as the main raw material, together with cattle grazing in the forests, also greatly affected forest ecosystems (Lilja, 2006). Intensive agricultural expansion concluded after World War II, at the same ti me as the arrivai of the forest industry (Ost! und et al., 1997). Sin ce the 1950's, the previously common practice of selective cutting was increasingly replaced by stand-leve! clear-cutting and even-aged forestry (Kuuluvainen and Siitonen, 2013). The synergy between agricultural expansion and development of intensive forestry in southern Scandinavia changed the landscape by fragmenting the forest into small patches, typically ranging from 0.5 to 10 ha in area (Kuuluvainen, 2002).1.3.2 Site descriptions
A total of 63 sites were sampled in Canada and Finland. To cover a gradient of forest management intensity, different types of forest were selected. Because the objective of this study was not to compare different stages of succession, ali sites that had been selected were between 30- and 70-years-old. In Canada, sites that had been disturbed before 1960 were excluded from the sampling of sites that were managed
using industrial techniques. Unfortunately, naturally regenerated forests on rich soils
proved very difficult to find in southern Finland, did not appear in the BioSoil
database3 (Hiederer et al., 2011) and, were not subsequently sampled. More than 80%
of ali harvested sites had been replanted, mainly with Norway spruce (Picea abies
(L.) Karst.) and Scots pine (METLA, 2011). Semi-natural forests are only found in
the north and northeast (Uotila and Kouki, 2005) or in old stands in advanced states
of stand development that were weil beyond the 30- to 70-year eut-off (Kuuluvainen
et al., 1996). Field work was undertaken in summer 201 0 in Canada and in summer 2011 in Fin land.
Sites in Canada were located in the boreal or hemi-boreal zone (Brandt, 2009):
in the upper Mauricie ofQuebec (72°62" W, 47 ° 60"N)4 for the natural and extensive
treatment; and in northeastern New Brunswick on private land (67°64" W, 47°34"N)
for the intensive plantations. Ali sites were located within a radius of 300 km, were
on mesic till soils, and were historically covered by mixedwood forests. ln naturally
regenerated sites, stands were dominated by balsam fir (Abies balsamea (L.) Miller),
trembling aspen (Populus tremuloides Michaux), paper or white birch (Betula
papyrifera Marshall), and black spruce (Picea mariana (Miller) BSP). ln Canada,
most of the selected plantations were pure stands of white spruce (Picea glauca
(Moench) Voss), but sorne were mixed with black spruce or red spruce (Picea rubens
Sargent). Ali Canadian plantations received 2 applications of herbicide shortly after
trees were planted, after which they were thinned once or twice. lt should be noted
that 20% of the landscape around plantations was in conservation. Annual
precipitation in both regions ranged between 900 and 1 1 00 mm, with a annual mean
temperature of3.3 °C (Environment Canada, 2012).
3
. Results of forest soil condition in Europe from a large scale soil survey.
4
ln Fin land, ali sites that we had selected were part of the pan-European project BIOSOIL (Hiederer et al., 2011) and were located across the southern boreal vegetation zone (61°82" E, 26 ° ll"N (Ahti et al., 1968). Selected Norway spruce plantations were classified as myrtillus sites with mesic till soil, or oxalis-myrtillus sites (Cajander, 1926) with mesic to moist nutrient-rich tills (BIOSOIL database (Hiederer et al., 2011 )). Silver birch (Betula pendula Roth) and Scots pi ne were frequently found in plantations. While no herbicides were applied in Finland, the plantations were thinned one or two times. Ali sites were historicaly forest, no sites had been previously used for agriculture or tar production. Annual precipitation in southern Finland is between 600 and 700 mm, and mean annual temperature is 5.5 °C (Finnish Meteorological Institute, 20 12).
ln their natural state, both regions would have been dominated by over-mature and old-growth stands (Kuuluvainen, 2009 ; Ost! und et al., 1997). The mean fi re interval is at !east 200 years in spruce-dominated forests of Fennoscandia (Wallenius, 2002) and in the regions that were sampled in Canada (Alvarez et al., 2011 ; Mosseler
et al., 2003). The assumption that species evolving under the same environmental pressures are adapted to react to disturbances in the same manner has previously been used to compare similar biomes in different geographical regions, e.g., lichen functional traits ac ross a gradient of land use in Europe (Stofer et al., 2006), understorey plants in various types of plantations (Aubin et al., 2008), or bird functional traits in Latin America under a gradient of coffee culture intensification (Phil pott et al., 2008). Therefore, we have adopted the same assumption in this study, viz., that very similar sets of functional traits are normally found in the understorey vegetation of natural forests of similar ecological context in both Canada and Finland.
1.3.3 Environmental variables
We measured key environmental variables that are known to affect understorey vegetation. These included soi! texture and fertility, with the latter being expressed in
terms of base cation content (Ca, Na, and K), stand structure ( canopy opening, basal area, and volume of CWD), and landscape composition (percentage of the landscape occupied by forest and agriculture fields). Environmental variables and species
occurrences were assessed in each sample plot. In each of the 63 sites, one sample plot (26m radius) was positioned more than 20 rn from an edge to avoid edge effects. Sites were located at !east 2 km from one another. The sample plot was delimited by four transects of 26 rn that were arranged in a cross aligned along the cardinal compass points. Depending on which variables were being assessed, measurements
were taken along and up to 2 rn on either side of the transect line.
1.3 .3 .1 Stand structure
At every 2 rn along each of the four transects, canopy openness was measured using a spherical crown densiometer (Ben Meadows Company, Janesville, WI). Ali trees that had a diameter at breast height (DBH, 1.3 rn) > 10 cm and which were within 2 rn either side of the transect line were measured to determine stand basal area (m2/ha).
To determine the volume of dead logs (V, m3/ha), line intersect sampling (Van Wagner, 1982) was performed along each transect. Cross-transect diameters (UNITS) were measured at the li ne intercepts of ali logs > Sem diameter (Angers et al., 2005). The volume of dead logs was then estimated using Van Wagner's revisied formula (Van Wagner, 1982):
V= KIL*L.d2
where
K is
a constant (1.234), dis the cross-transect diameter of log (cm) andL is the
transect length that was sampled (rn). To calculate the volume of dead snags and stumps, ali snags (:::: 1.3 rn tall, DBH:::: 5 cm) and stumps (with diameters:::: 5 cm at 30 cm above the sail surface) that were within 2 rn of either side of the transect linewere measured in terms of their diameters and heights. The total CWD volume, which included cross transect down log volumes, and the volumes of stumps and snags, which were calculated as cylinders, was estimated on a per hectare basis for each site.
1.3.3.2 Landscape composition
A landscape analysis was performed using Geobase Land Cover Circa 2000 (Geobase, 2011) for Canada and Corine Land Cover 2000 (European Environment Agency, 2000) for Finland. The percentage of forest and agriculture field was determined within a 2 km radius of each site.
1.3.3.3 Soit sampling
In Canada, 10 volumetrie sam pies of both the organic layer and the first 15 cm of the mineral soit were randomly sampled along the transect tines in each site. Water pH, texture (granulometry) (sand = 53 Jlm -2 mm, silt = 2 Jlm - 53 mm and clay=< 2 Jlm), Ca, Na and K (emoi/kg) concentration were determined in the laboratory for each mineral soit sam pie using the methods described by Thiffault et al. 's (2007). ln Finland, soit information was available from the BIOSOIL database for ail sites and similar analytical methods were used (Cools and De Vos, 2010 ; Hi ede rer et al., 20 Il).
1.3 .4 Vegetation description
At every 2 m interval along the four 26 m transect tines, species present within a 15-cm radius of this point were identified to the specie levet. Within 2 m of either si de of a transect, the presence of an understorey vegetation species was recorded, if it had not been recorded at any of the 52 sampling points. To calculate occurrence, herbaceous and woody species at a sampling point were each assigned a value of 1 when a species was present at the sample point, and a value of 0.5 for species that were present in the plot but not at any of the sampling points. The frequency of
occurrence(%) for a species was determined from the proportion of points in the plot where the species was present, divided by the total number of sample points (i.e., a total possible score of 52). Calculation also included the score of species that were present in the plot but not at any of the sampling points.
1.3.4.1 Traits
The trait approach that was used in this study focuses on the occurrence of response traits that are related to community structure and dynamics. Response traits are defined as "any trait the attribute of which varies in response to changes in environmental conditions" (Violle et al., 2007). Nine traits and one ecological performance measure (light requirement) were selected for the analysis as they were related to dispersal capacity and traits involving the capacity of a plant to be maintained (persistence) in a disturbed site after perturbation (Table 1.1 ). Most data on traits were found in the TOPIC (Aubin et al., 20 12), LEDA (Kleyer et al., 2008), and BIOFLOR (Kiotz et al., 2002) databases. When the information was not available in these databases, a literature search was undertaken.
Tableau 1.1 Description and litera ture review of 9 vegetation traits and 1 ecological preference positively (+)or negatively (-) associated with forest
management intensity
Traits/ecological Class References
preference
Raunkiaer life form Chamaephyte (herb/shrub, bud 1 mm to 25cm above ground) - (Aubin et al., 2007 , Geophyte (herb with underground bud)
-
Herm y et al., 1999,
Hemicryptophyte (herb with bud at the grou nd surface)-
Royo and Carlson,Mega or meso-phanerophyte ( ~8m in height)
-
2006)Micro or nan-phanerophyte (25cm to 8m in height) +
Therophyte (annual) +
Light requirement Intolerant + (Craig and Macdonald,
Mid tolerant 2009 ; Macdonald and
Tolerant
-
Fenniak, 2007)Life cycle Perrenial and biannual
-
(Brumelis and Carleton,An nuai + 1989
,
Peltzer et al.,2000)
Flowering Spring
-
(Gachet et al., 2007'
phenolo~y Sommer 1 fall + Graae and Sunde, 2000)
Height Numeric values (cm): Tall
=
>50cm + (Bock and Van Rees,2002
' Brume lis and
Carleton, 1989)
Foliage structure Not 12hanero12hyte (Aubin et al., 2007
,
Decumbent stem
-
Mclntyre et al., 1995)Erect leaves
-Erect leafy stem
-Stem bent in an arch-shaped
-Non-leafy stem
-Umbel-shaped stem -Rosette + Semi-rosette + Graminoid + Phanero12hyte . Multi-stemmed + One stem-Lateral extension Not 12hanero12hyte (Brumelis and Carleton,
Limited (Annuals and biennials, but also perennials not + 1989 ; Haeussler et al.,
propagating vegetatively) 2002
' Peltzer et al., Clonai compact (Perennials growing in dense tufts from buds + 2000)
on a rhizome or a root storage organ. Horizontal propagation is
Seed length
Clonai extensive (Perennials with obvious horizontal -propagation, either above or below ground. lncludes most species qualified as "phalanx" or "guerilla")
Phanerophyte
Limited (No form of vegetative propagation, not even
+
sprouting)Clonai compact (Vegetative propagation by sprouting or root
+
collar sprouts)Clonai intermediate (May include preceding forms, but also -layering and low levels of horizontal propagation by root suckers or rhizomes
Clonai extensive (May include preceding forms, but also high -levels of horizontal propagation by root suckers or rhizomes) Very small, <0.1 mm Small, 0.1 to 1.99 mm Medium, 2 to 2.99 mm Large, 3 to 4.99 mm Very lar~e, 5 to 40 mm
+
+
(Aubinet al.,
2009)Seed production Abundant (> 1 000 seed per shoot) Semi-abundant (20-1 000 seed per shoot) Few (1-20)
+
(Rowe, 1983)Seed dispersal Endozoochorous (animal ingestion including bird) Epizoochorous ( carried externally)
Anemochorous(wind)
+
+
(Aubin
et
al.
,
2007 ,Bradbury, 2004 , McLachlan and Bazely, 2001)
Positive sign (+) means that this class of a particular trait is favoured by intensification in forest management and part of a syndrome of colonization traits. On the contrary, a negative sign (-) means that this class is negatively associated with forest management intensity and part of a syndrome of persistence traits. For the seed dispersal vector, a species can have more than one class.
1.3.5 Statistical analysis
One ANOVA followed by Tukey means comparison tests and t-test were used to compare environmental factors among levels of forest management intensity. A ANOV A was done comparing Canada natural (CN), Canada extensive (CE) and Canada intensive (Cl), and at-test comparing Cl and Finland intensive (FI). We also performed fourth-corner analysis (Dray and Legendre, 2008) to highlight the functional trait(s) that was significantly associated with each leve! of forest
management intensity. This 'direct' approach relates plant traits to environmental variables by simultaneously analysing three matrices: L
= spec
ies occurrences that were measured in the field per plot; Q= species by fun
ctional traits; and R = plot by level of forest management intensity gradient. Dray and Legendre (2008) have presented five models of RLQ analysis; here, we used model 1, where cell values were permuted (9999 times) within the columns ofmatrix L. This model tests the null hypothesis that species are randomly distributed with respect to site characteristics. Like Aubin et al. (2009), we applied Hellinger transformation to species occurrences (data table L) prior to the analysis and adjusted the probabilities that resulted from significance tests of the global statistics in the fourth-corner matrix, using Holm's procedure (Dray and Legendre, 2008).To characterise sensitive species in Finland and to compare their traits with vegetation traits on intensively managed sites, emergent groups (EG) were delineated from the trait matrix of Finnish Red-List herbaceous species that were threatened by forest management. The red-list species were selected for analysis independently of the forest type (Cajander's 1926 classification) to which they belonged, because the objective was not to compare them with sampled plantations in Finland, but with rich forests soil in Canada. This red-list of species (i.e., extinct, critically endangered, endangered, vulnerable, and near-threatened) was prepared by the Ministry of the Environment in Finland and based on IUCN criteria (Rassi et al., 2010). The same hierarchical approach that was used by Aubin et al. (2009) was followed to delineate EG using classification methods. Traits related to phanerophytes were not included in the analysis. Gower's similarity coefficient (Gower, 1971) was calculated. This coefficient can handle both missing values and mixed data types (Legendre and Legendre, 1998). Based on these similarity matrices, species were clustered using Ward's hierarchical method, with cut-offs for defining clusters determined subjectively after vi sua! examination of the dendrogram.
Last, species richness and Simpson's diversity index were calculated for ali herbs and phanerophytes by leve! of forest management intensity. JMP 5.1 (SAS Institute, 2003) was used to perform ANOVA and t-test, followed by Tukey tests. The fourth-corner analysis and EG were performed in R (version 2.14.1 ), (R Development Core Team, 2011 ; Satake and Iwasa, 2006). Results were declared significant at p = 0.05.
1.4 Resu1ts
1.4.1 Differences m environmental factors along the gradient of forest management intensity
Agricultural fields were rare in the stands that were studied in Canada (absent in CN and CE, and marginal in CI), while representing a substantial portion of the Finnish territory that was surveyed (15 %). ln Canada, forests covered a significantly lower percentage of the landscape in areas of intensive plantation (75 %), compared to CN (87 %) and CE (90 %). This percentage was slightly greater than that observed in Finland (66 %) (Table 1.2).
At the stand scale, basal area (±35 m2 ha-1) and canopy openness (± 12 %) were similar among ali site types. In Canada, the percentage of conifers was greater in intensive plantations (CI), but naturally regenerated (CN and CE) were also largely dominated by conifers (about 70%). Intensive plantations in Finland (FI) had significantly fewer conifers (88 %) than plantations in Canada (96 %). Deciduous trees within the plantations were natural origin not planted. Intensive plantations had lower volumes of CWD (Cl = 28 m3 ha-1, FI =24m3 ha-1) than forests in CN (123 m3 ha-1) and CE (90m3 ha-1 ). The soils of the intensive plantation sites in Canada were more fertile than in other sites, given their significantly higher base cation concentrations (K, Na and Mg). A Iso, sail fertility of CI was higher than in other sites
Lands cape
Stand
by mineral soi] containing significantly more clay (37%) and Jess sand (23%), and higher pH compared to other sites (Table 1.2).
Tableau 1.2 Mean values of environmental factors, richness and Simpson's diversity indices by level offorest management intensity for two spatial scales. Statistical tests are per orme ~ d b tw e een C ana 1an d' SI 't es an d th en b tw e een CI & FI
Canada Canada vs Finland
CN CE Cl Cl FI
N= 10 N= lO N= l2 N= l2 N= 21
%Agriculture 0±0.06 A 0±0.04A 0.2±0.05 tl 0.2±3A 15±3 tl
%Forest 87±3 A 90±2A 75±3 B 75±5 A 66±4A
Basal area (m2/ha) 33±3 A 36±2A 36±2 A 36±3 A 42±2 A
%Conifer 75±5 A 67±4A 96±58 96±2A 88±2 B
%0peness 12±1 A 10±] A ]]±]A ]]±2A )4±) A
CWD (m3/ha) 123±14 A 90±J0A 28±13 B 28±6A 24±5 A
pH 3.86±0.1 AB 3.72±0.1 A 4.12±0.1 B 4.12±0.1 A 3.80±0.1 B SB (emoi/kg) 2.50±4 A 1.91±3 A 13.38±4 A 13.38±4 A 1.58±23 B
%Clay )4±) A )2±) A 37±] B 37±4A 10±3 B
%Sand 54±2A 57±] A 23±2 B 23±7A 52±5 B
Richness 29±2.0A 30±J4A 33±1.8 A 33±2.) A 27±161j
Simpson 0.95±0.003 A 0.95±0.003 A 0.95±0.003 A 0.96±0.005 A 0.94±0.003 B Two analyses are shown. The first one compared sem1-natural forests (CN), extens1vely managed forests (CE) and intensively managed forests (CI) in Canada. The second analysis compared intensively managed forests in Canada (CI) and in Finland (FI). A different letter indicates a significant difference at P<0.05 (one-way A NOVA followed by Tukey tests). Means are presented with the ir standard error (±). SB= Summ of bases.
1.4.2 Influence of the gradient of forest management intensity in Canada
In Canada, occurrences of functional traits were quite similar between CN and CE, but different from the Cl (Table 1.3). Most traits, with the exception of light requirement and traits related to seeds, exhibited significant differences between sites.
Occurence of geophytes, chamaephytes, and micro-phanerophytes are reduced in
intensive plantations, as are perennials in general. Phanerophytes with limited,
compacted lateral extension or with multiple stems were less abundant in CI than in the CN and CE. Among non-phanerophytes, plants with non-leafy stems and semi-rosettes were also less frequent, while hemicryptophytes and summer flowering
spec1es were more abundant within intensively managed plantations in Canada.
Species were also generally taller in plantations compared to CE. Decumbent, rosette
and erect leaves were more prevalent in CI. Species with foliage that was arranged in rosettes were also abundant in CN. In addition, non-woody species with limited compact lateral extension occurred in greater abundance in Cl.
Tableau 1.3 Influence of the gradient of forest management intensity on the
occurrence o ff une aona rats an
r
1 t 1 dt rat 1 s re 1 t d a e to t h e re - ast emergent group dr4th Red-list
4th corner corner emergent
Canada Canada groups
VS (n=31) Fin land CN CE Cl Cl FI 1 2 3 (16) (8) (7) Raunkiaer Chamaephyte
+
-
-+
x Geophyte+
-x
Hemicryptophyte-
-
+
+
-
x
x x
M icro-phanerophyte-
+
-Therophyte-
+
Light requirement Intolerant
-
+
x
Midtolerant
-
+
x
x
xTolerant
+
-x
x
Life cycle Perrenial
+
+
-
x x
x
Annual x
x
Flowering Spring
x
x
xphenology
Summer
-
+
x
xx
Height herbaceous Tall (>50cm)
-
+
x
x x
Foliage structure Decumbent
-
-+
+
-
xErectleaves
-
+
+
-x
Erectleafy stem